
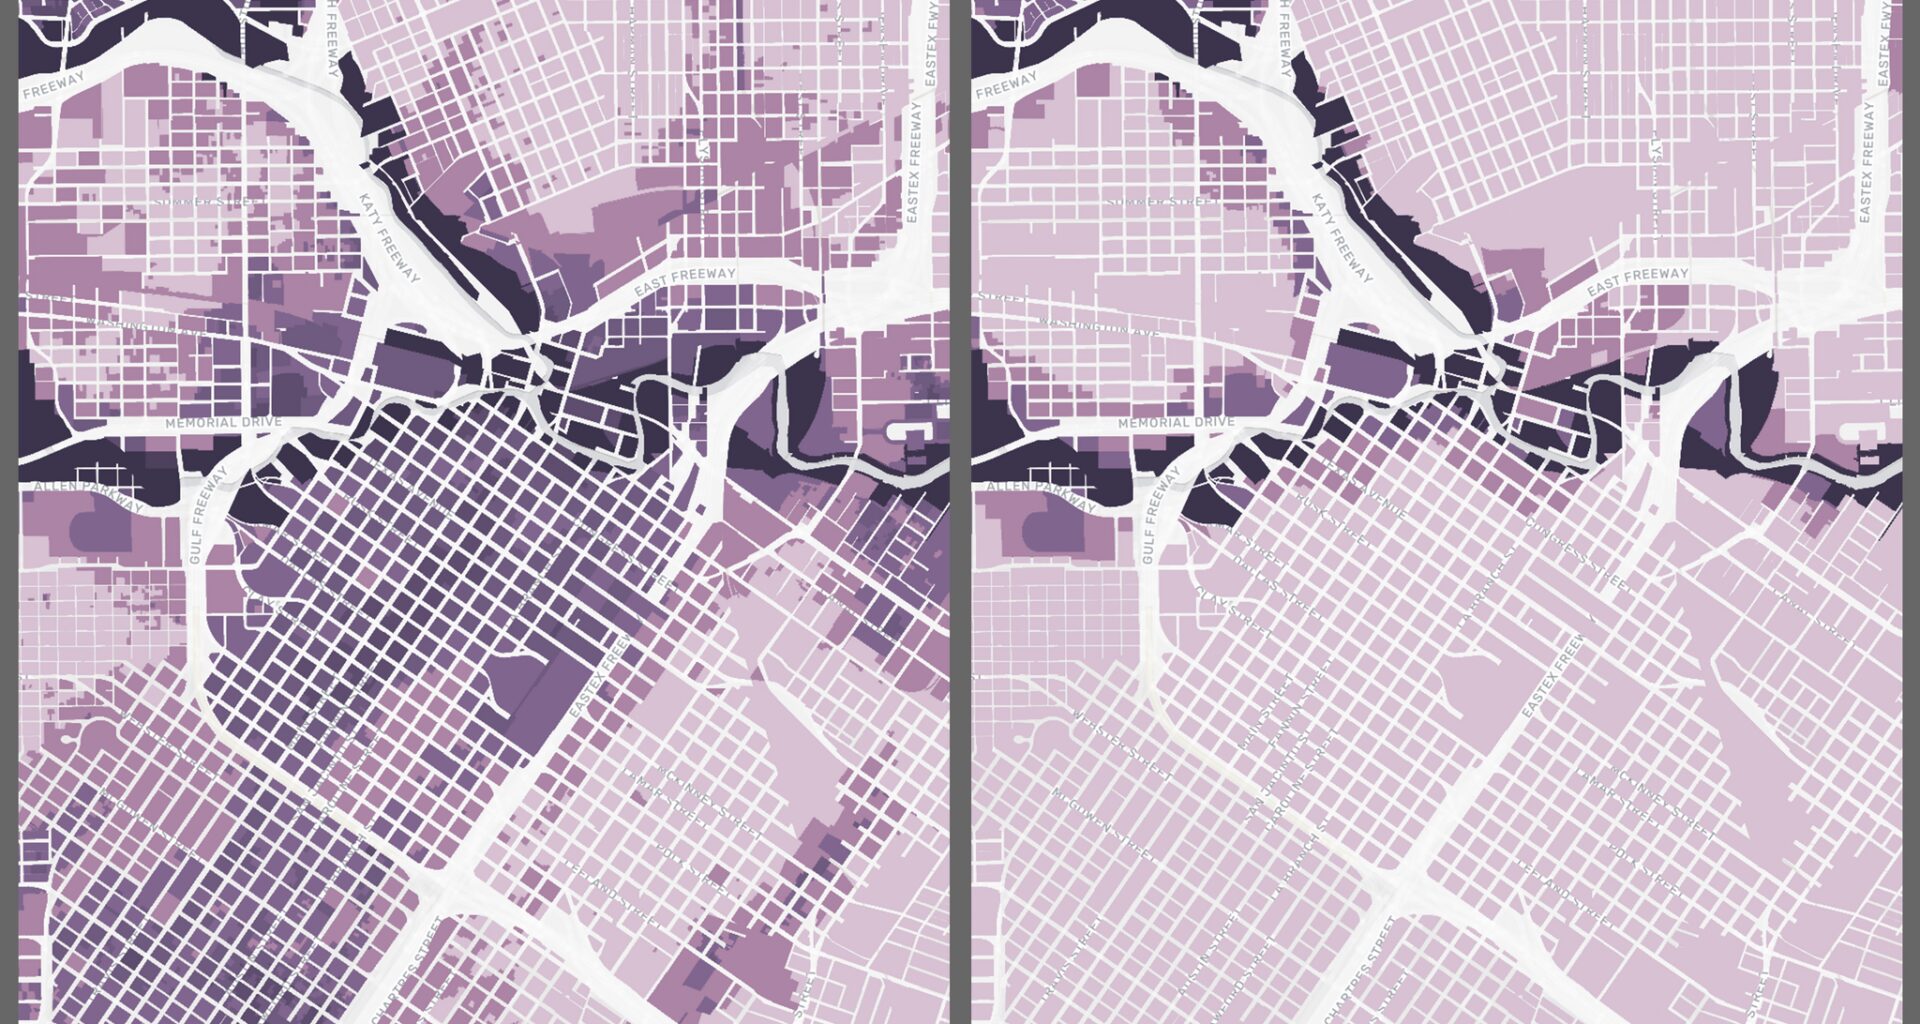
A Texas A&M University study shows far more Harris County properties may face serious flood risk than FEMA’s flood maps suggest.
Researchers from the university’s Institute for a Disaster Resilient Texas found that about 389,500 properties have at least a 1% chance of flood damage in any given year. That is more than twice the roughly 184,800 properties FEMA currently includes in its regulatory floodplain, which covers areas with the same level of flood risk.
Using data provided by the institute, the Houston Chronicle created a searchable map so Harris County residents can enter their address and see how their home’s estimated flood risk differs between FEMA’s assessments and those from IDRT.
The institute’s model shows substantially more flood risk than FEMA’s maps do in parts of west and west-central Houston, northeast Houston and downtown.
Article continues below this ad
Researchers say there are several reasons for the gap. One of the biggest is that FEMA’s current maps rely on out-of-date data, according to Wesley Highfield, a senior research scientist at IDRT.
Harris County has not had a comprehensive map update in almost two decades. FEMA is working on a proposed overhaul, but the new maps could still take years to finalize.
The two approaches also measure flood risk differently. FEMA uses engineering models to predict how water moves during a storm. IDRT’s data, on the other hand, draws from detailed federal flood insurance claims and analysis of past flood damage to estimate where properties are most at risk.
FEMA REMOVALS: A little-known appeal process has erased thousands of wealthy Harris County homes from floodplains
Article continues below this ad
Another distinction is that IDRT’s approach shows flood risk on a spectrum so residents would not think of themselves as simply “in” or “out” of the flood zone, said Laura Stearns, a research specialist at IDRT.
“There’s always flood risk around, especially somewhere like Houston,” Stearns said. “Even if you think you’re outside of the floodplain around one of these major channels, there is more localized flooding that’s happening.”
Here are three areas where the discrepancies between the two models are especially notable.
West and west-central Houston
Article continues below this ad
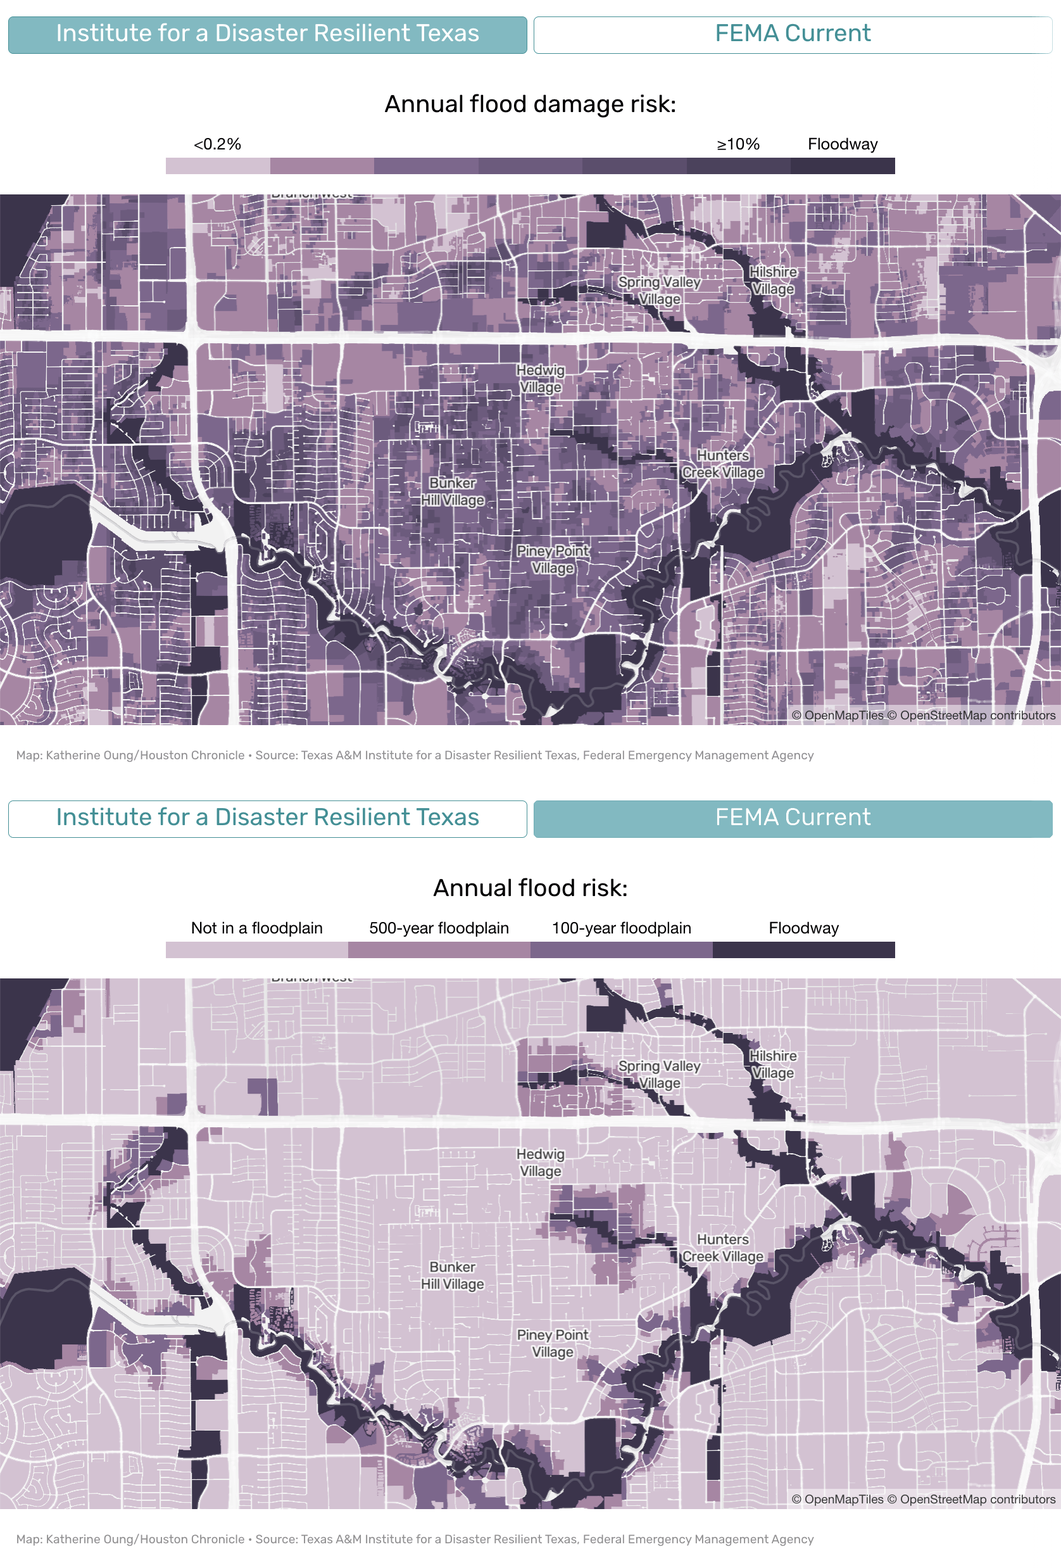
The clearest example is a broad stretch of west and west-central Houston just south of I-10. It starts around Uptown and Memorial and continues west along the Energy Corridor and farther west toward Katy.
Much of the cluster is located in the Buffalo Bayou watershed, which has been hit repeatedly during past storms. The Memorial Day flood in 2015, Tax Day flood in 2016 and Hurricane Harvey in 2017 all strained the system, local and federal studies show.
During Harvey, severe rainfall overwhelmed the watershed and filled the Addicks and Barker reservoirs to record levels. The U.S. Army Corps of Engineers was forced to release water from the reservoirs to protect the dams, leading to severe flooding in downstream neighborhoods.
The cluster includes six of the 10 Harris County ZIP codes with the largest percentage gaps between the two flood-risk assessments.
In each of those six ZIP codes – 77079, 77024, 77027, 77042, 77056 and 77094 – researchers found that over 50% of the properties in the area are in their 100-year floodplain but not FEMA’s maps. Altogether, that amounts to more than 22,000 high-risk properties that FEMA’s official maps may be missing, according to the IDRT research. Thousands more are located elsewhere across west and west-central Houston.
Article continues below this ad
Much of the additional risk captured by the institute’s model is in places not immediately along the bayou itself, said Sam Brody, the institute’s director. FEMA’s floodplain mainly shows where water is expected to spread when bayous and rivers rise. The IDRT model, on the other hand, also recognizes places likely to flood when heavy rain collects in streets and neighborhoods.
Brody said heavy development – including large parking lots, warehouses and other paved surfaces – may have elevated the flood risk there because now there is less open ground to absorb water during a storm.
“There’s just a huge amount of impervious surface along that corridor,” Brody said. “It’s an area of prolific growth and sprawl.”
Northeast Houston
Article continues below this ad
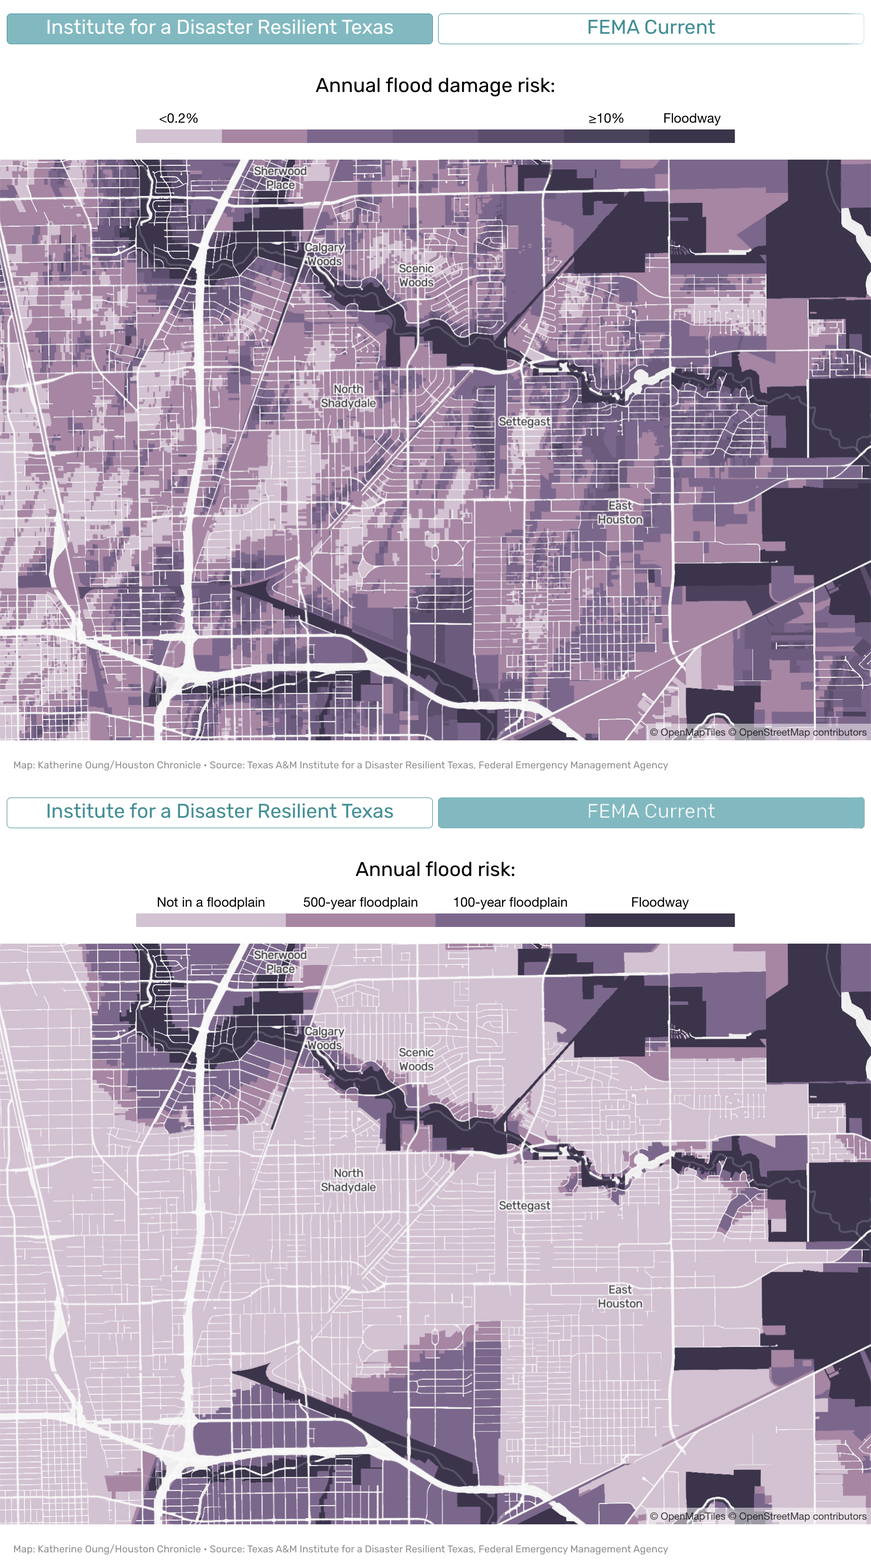
Another large gap appears on Houston’s Northeast side, particularly in lower-income neighborhoods such as Settegast and East Houston.
In ZIP codes 77028 and 77078, the institute identified about 8,000 properties with at least a 1% annual chance of flood damage. More than 6,900 of them fall outside FEMA’s current regulatory floodplain.
Notably, FEMA’s updated modeling is beginning to recognize more of that additional risk.
The federal agency’s new draft maps show significant floodplain expansions in northeast Houston. Residents and advocates from those communities have told the Chronicle that the new estimates are finally catching up to the chronic flooding they have long experienced on the ground.
Local studies have repeatedly highlighted insufficient drainage infrastructure in northeast Houston.
A city-commissioned Hunting Bayou watershed study flagged Settegast as one of the places where residents can experience flooding even in relatively common storms, citing insufficient roadside ditches and storm sewers.
Another city report found that water in East Houston often builds up on certain streets and low-lying areas when drainage systems cannot carry runoff away fast enough.
Brody said chronic flooding can be especially easy to overlook in lower-income and historically underserved communities, where fewer families carry flood insurance or have the means to formally report damage.
“There are so many flood impacts that we are missing as a society that go unnoticed because people don’t report them,” he said. “It’s a chronic problem.”
Downtown Houston
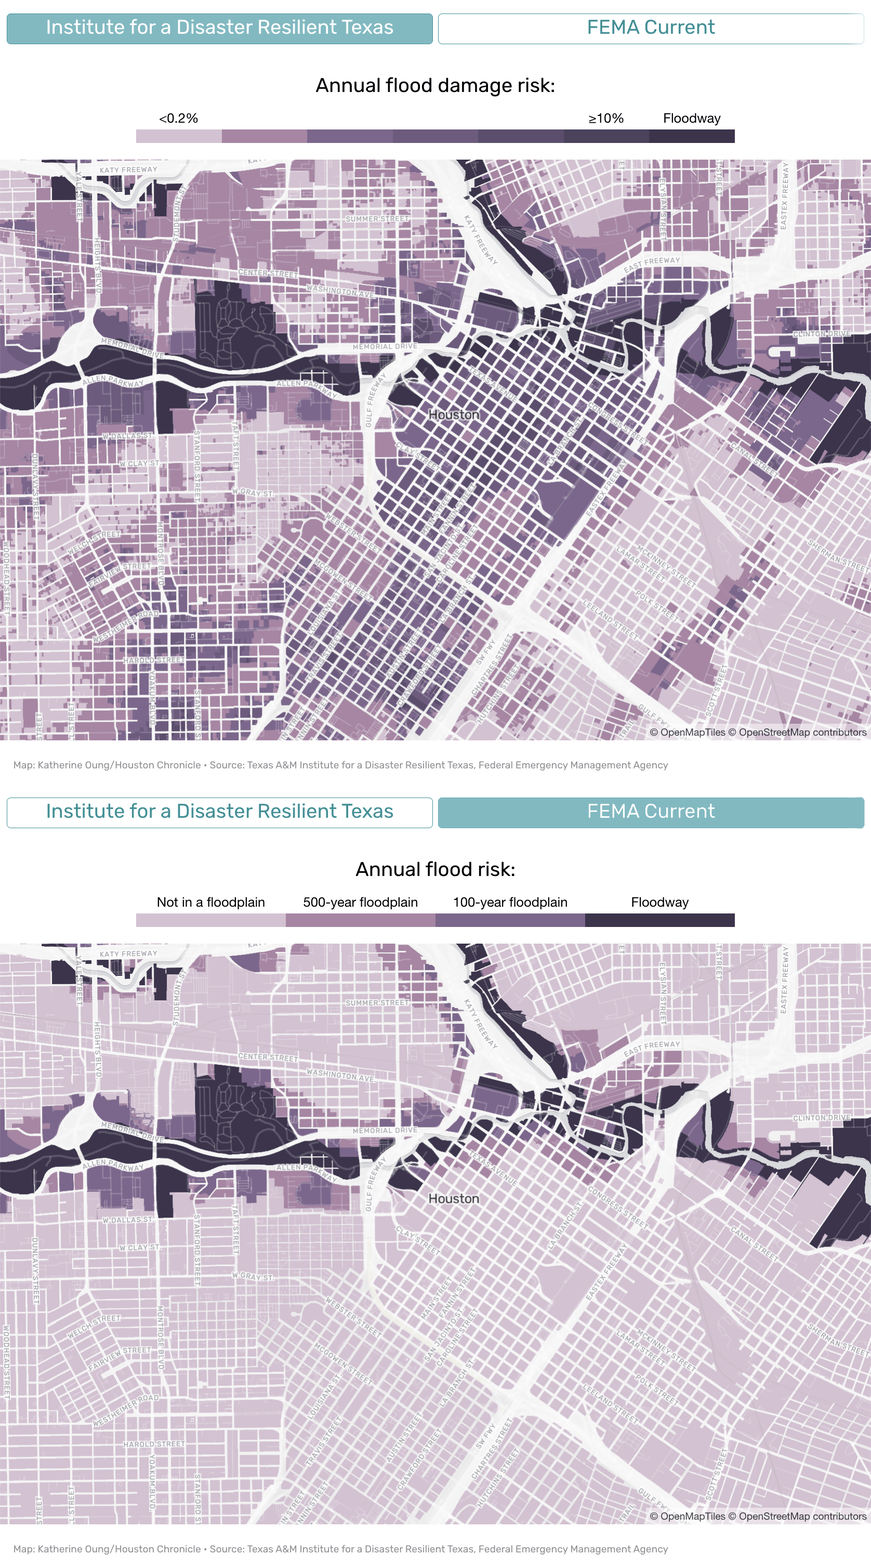
Downtown Houston is another key area where IDRT’s research shows a much higher level of flood risk than FEMA’s maps.
In ZIP codes 77002 and 77010 — a small area covering Houston’s core central business district — the institute found nearly 1,200 properties with at least a 1% annual chance of flood damage. Only about 70 are in FEMA’s current regulatory floodplain.
Downtown’s dense concentration of buildings, streets and pavement means rainfall is more likely to run off quickly into streets and drainage systems rather than soak into the soil.
Stearns said the area has recorded a large number of past flood damage claims well beyond FEMA’s floodplain boundaries.
During Tropical Storm Allison in 2001, for instance, downtown Houston sustained tens of millions of dollars in damage to buildings, the tunnel system, related infrastructure and parking garages, according to a Harris County report.
Researchers, however, cautioned against assuming any single factor explains the pattern, especially across such a small geographic area. Flooding can vary block by block depending on elevation, drainage, development and other local conditions. Even one chronically backed-up drain can influence where flood damage occurs, they said.
The broader takeaway, Stearns said, is that residents should look beyond whether their home’s floodplain designation would require them to purchase flood insurance. They should consider their home’s risk profile more holistically so they could better protect themselves and their property, she said.
“Right now, it’s always inherently tied back to that question of, ‘Am I in or out of this area where I have to pay more money to live in?’” Stearns said. “Our goal is to try to get away from that as much as we can.”