
A new study shows that the majority of faults underlying the Fort Worth Basin are as sensitive to changes in stress that could cause them to slip as those that have generated earthquakes in recent years.
Researchers with The University of Texas at Austin’s Bureau of Economic Geology, Stanford University and Southern Methodist University have created a comprehensive map of more than 250 faults totaling more than 1,800 miles in combined length, some of which extend under highly populated areas in the Dallas-Fort Worth region. The study, published July 23 in the Bulletin of the Seismological Society of America, found that the faults are relatively stable if left undisturbed, but that wastewater injection, a practice common during oil and gas operations, significantly increases the potential of the faults to slip if not managed properly.
“That means the whole system of faults is sensitive,” said lead author Peter Hennings, a bureau research scientist and the principal investigator at the Center for Integrated Seismicity Research (CISR).
The Fort Worth Basin saw a major increase in seismic activity from 2008 to 2015 as oil and gas operations increased, but a significant reduction in earthquakes the last four years as injection has slowed. Hennings said that people should be aware that the nature of the fault system means that many areas are susceptible to potentially hosting earthquakes, and that an upturn in oil and gas production that results in increased deep wastewater disposal could also bring an upturn in quakes if not properly managed.
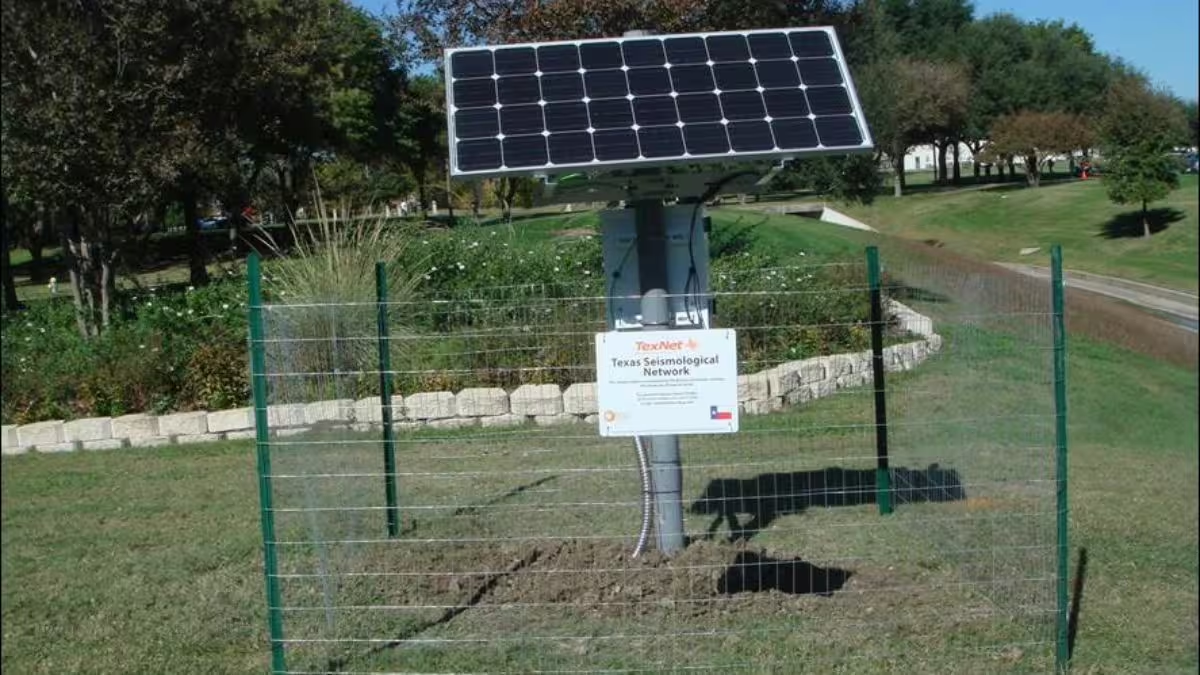
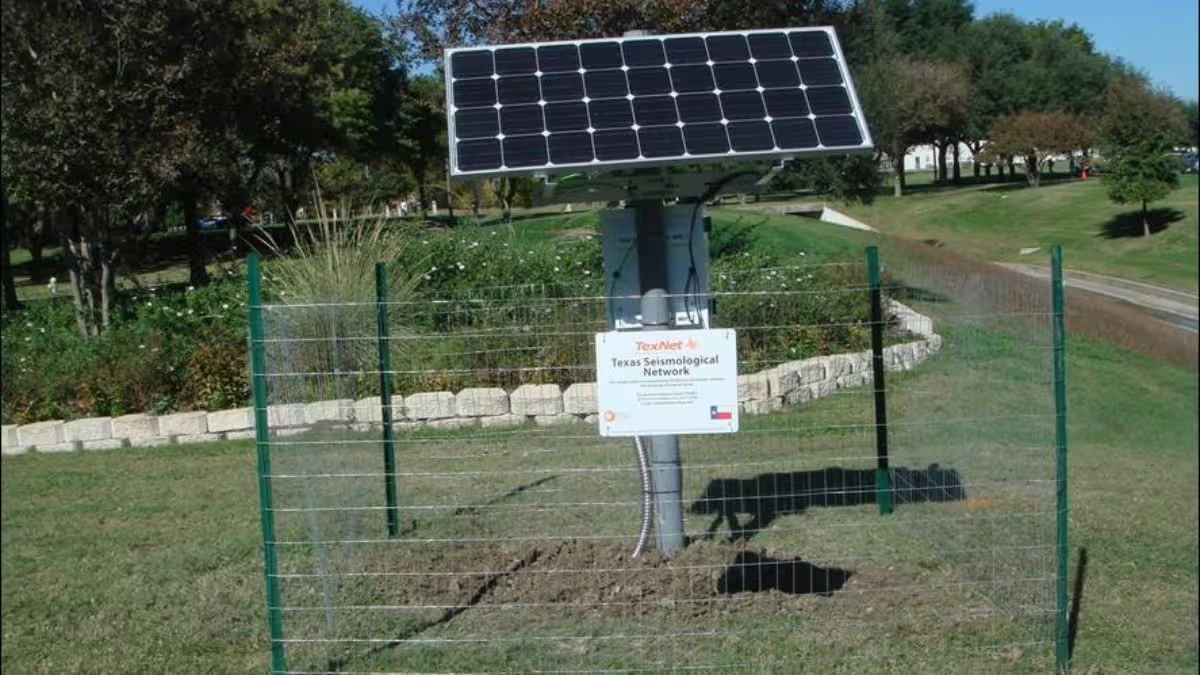
The new study included data from TexNet seismometers, like this one in Dallas, which monitor seismic activity across Texas. (Photo courtesy of The University of Texas at Austin)
SMU professor and study co-author Heather DeShon pointed out that the strongest earthquakes in the area have been magnitude 4, which is much less powerful than the major earthquakes that hit California earlier this month, but said that the region needs to prepare for the hazard.
“This study provides key information to allow the public, cities, state, the federal government and industry to understand potential hazards and to design effective public policies, regulations and mitigation strategies,” she said.
SMU compiled the earthquake history of the region – a step that identified the need for an updated fault map in the first place. Stanford provided a map of the tectonic stress in the region and the analysis methods used to determine fault sensitivity. UT developed the new fault map and lead the overall effort. The research also benefited from data provided by petroleum industry partners.
The team also created maps that show the sensitivity of the faults. One shows that the faults in their natural geologic condition are relatively stable and not expected to slip if left undisturbed. Another map shows the impact of general pressure to the subsurface caused by wastewater disposal and reveals that it significantly increases the likelihood for faults to slip.
“Industrial activities can increase the probability of triggering earthquakes before they would happen naturally, but there are steps we can take to reduce that probability,” said co-author Jens-Erik Lund Snee, a PhD student in Stanford’s Department of Geophysics in the School of Earth, Energy & Environmental Sciences (Stanford Earth).
Stanford professor and co-author Mark Zoback added that although this research focused on the Dallas-Fort Worth region, it creates a roadmap for those interested in investigating earthquake potential in other places.
“The methodology could be used in other areas where induced seismicity is of concern but development activities are just beginning, making it possible to identify potentially problematic faults before induced seismicity occurs,” said Zoback, the Benjamin M. Page Professor of Geophysics at Stanford Earth. “So it creates a framework for making decisions in the future.”
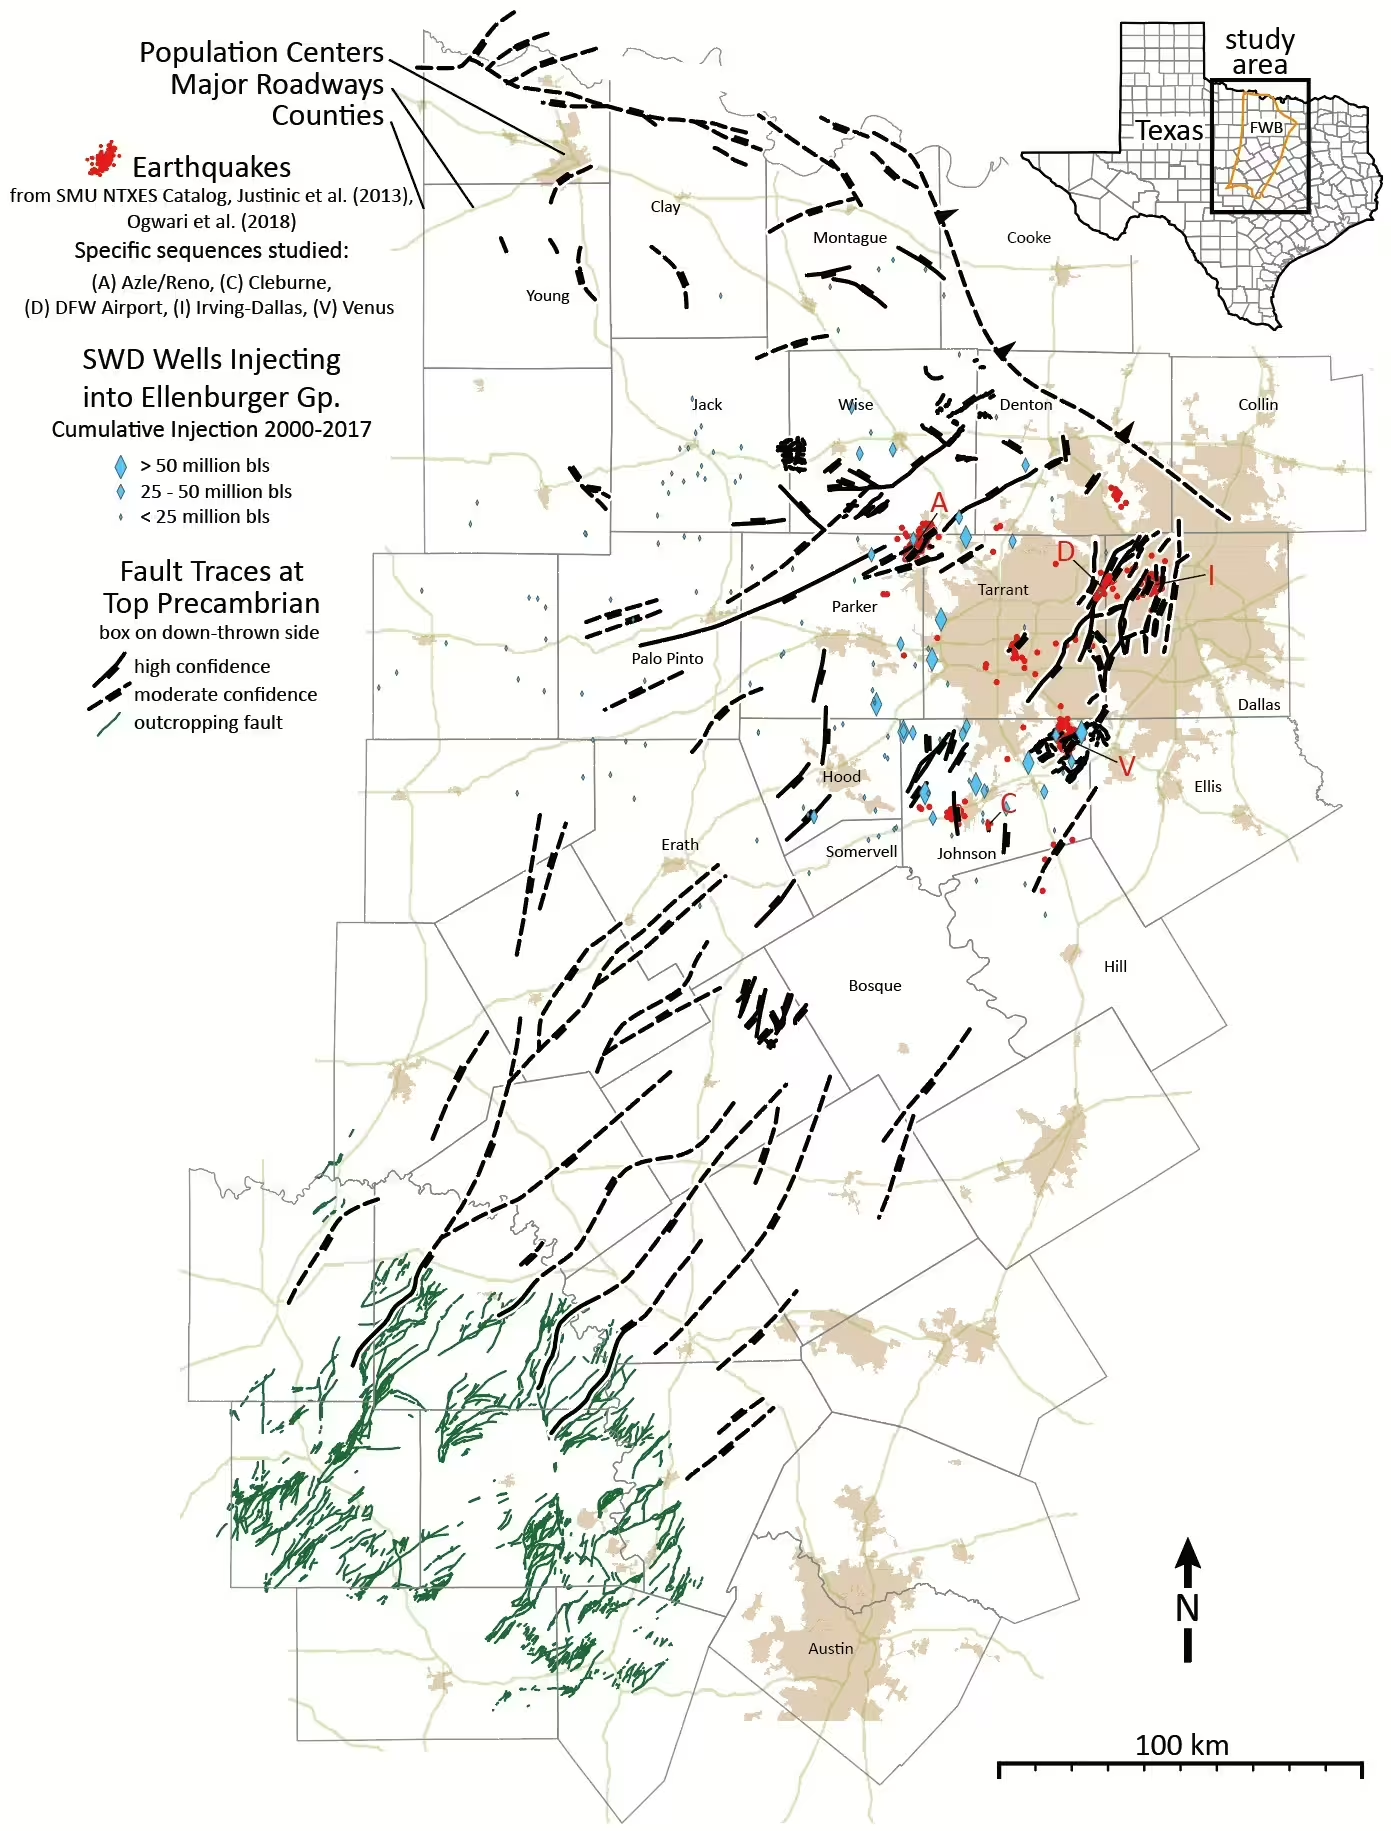
A simplified version of the fault map created by the team of researchers. The map includes faults that are visible at the surface (green) and faults that are underground (black). The solid line indicates underground faults that researchers were able to map at a high resolution. The dotted line indicates faults that were mapped at a medium resolution. According to the research, in the presence of wastewater injection activity, the majority of the faults in the area are as susceptible to slipping as those faults that have already produced earthquakes. The map also marks earthquake locations and waste-water injection well locations and amounts. (Image credit: Hennings et al.)