
The United States is the world’s largest aviation market by a stretch. A total of 890.1 million arriving and departing passengers last year saw the US trump the next biggest, China with 776.1 million, by well over 100 million passengers, according to data from the International Air Transport Association (IATA). The UK, which was the third-busiest country for passenger traffic, then recorded just 269.7 million people boarding and disembarking flights over the course of 2025, for context. Naturally, supporting such vast numbers of fliers in the US requires a string of mega-hubs.
In fact, four of the world’s ten busiest airports in 2025 were located in the US – more than any other country. These were  Hartsfield-Jackson Atlanta International Airport (ATL),
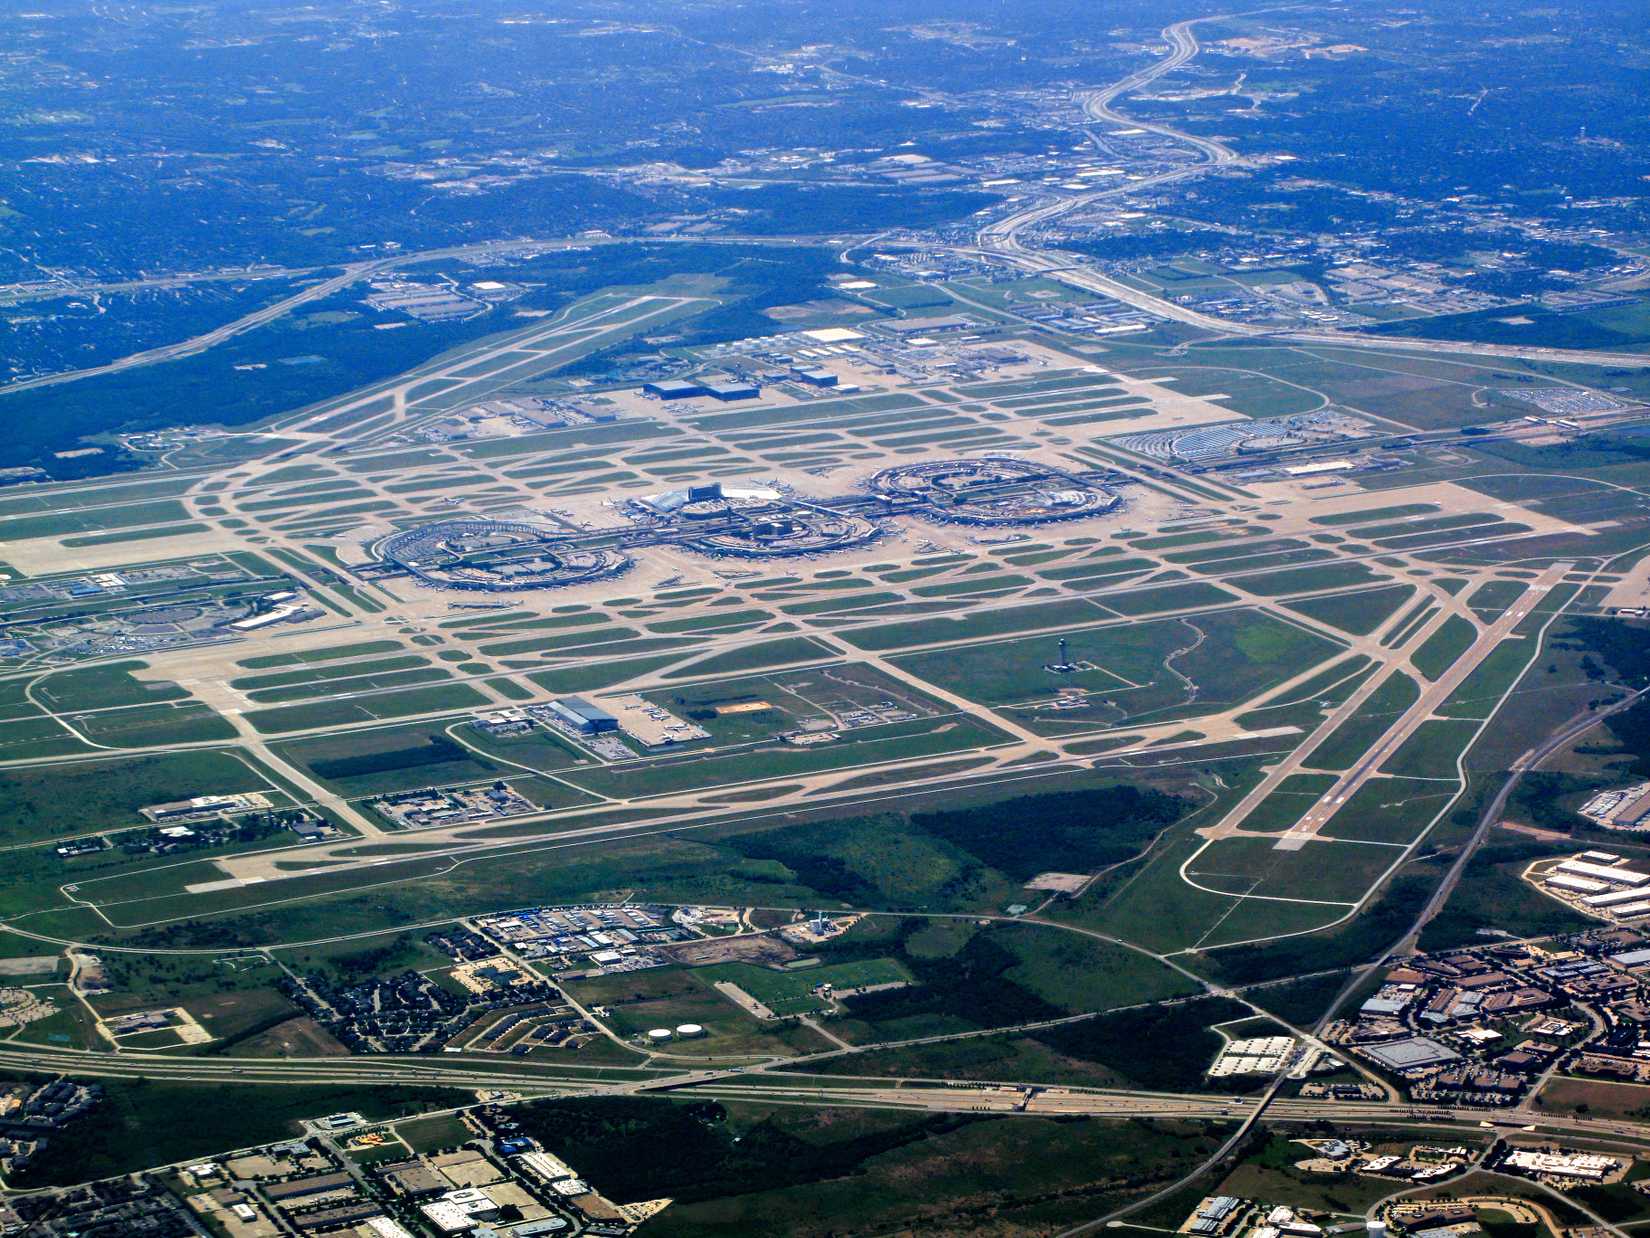
 Dallas/Fort Worth International Airport (DFW),
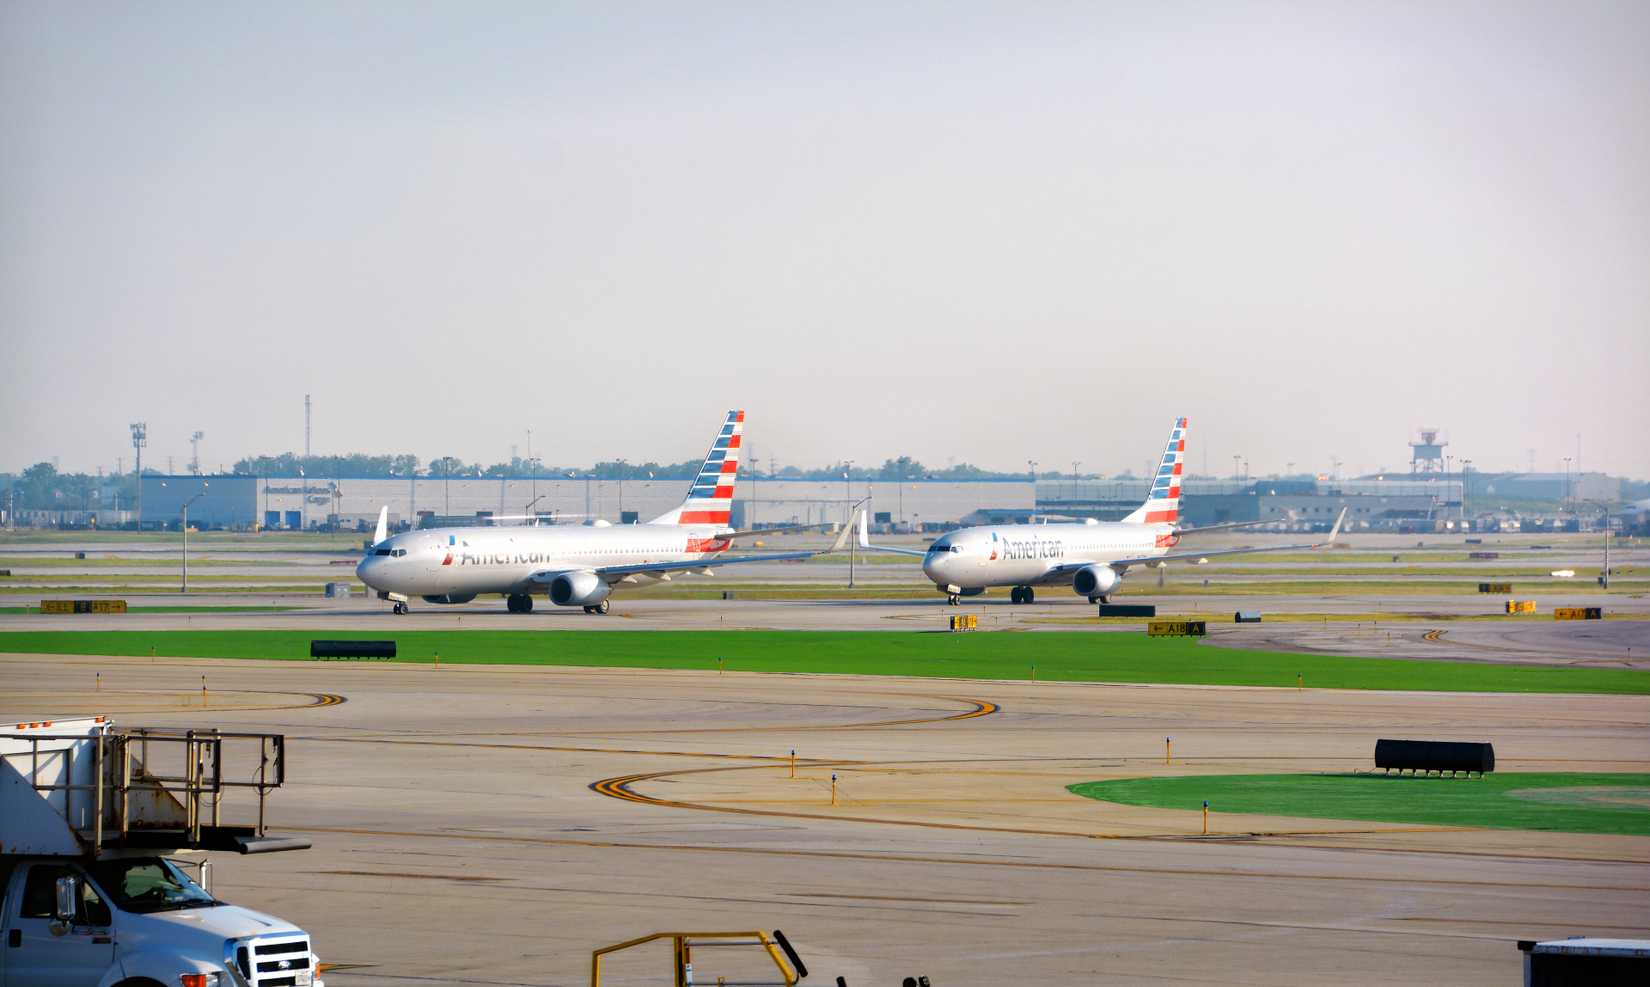
 Chicago O’Hare International Airport (ORD), and
 Denver International Airport (DEN), which, between them, handled in excess of 359 million people. Each’s share of traffic was far from equal, though, with Atlanta and Dallas accounting for just over a fifth of the US’ total traffic alone, for instance. So that begs the question: which one handled more, and is that likely to change anytime soon?
Atlanta Clearly Ahead On Passenger Traffic Last Year
Credit: Wikimedia Commons
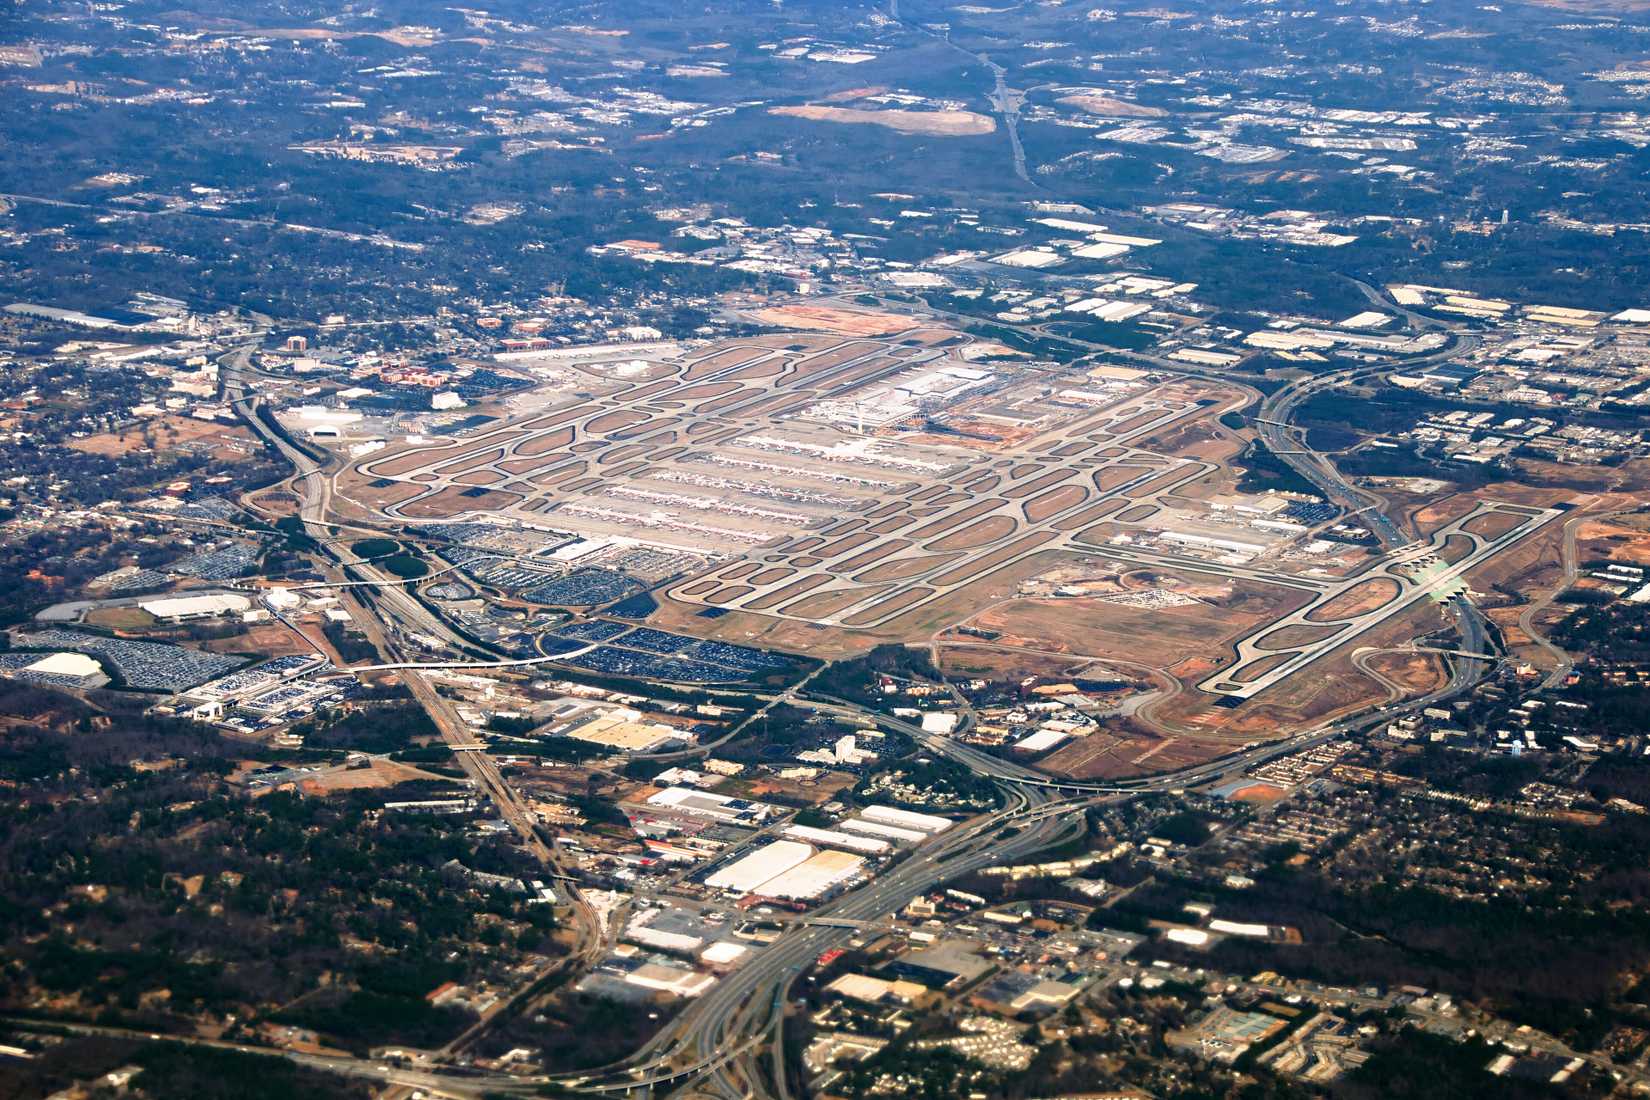
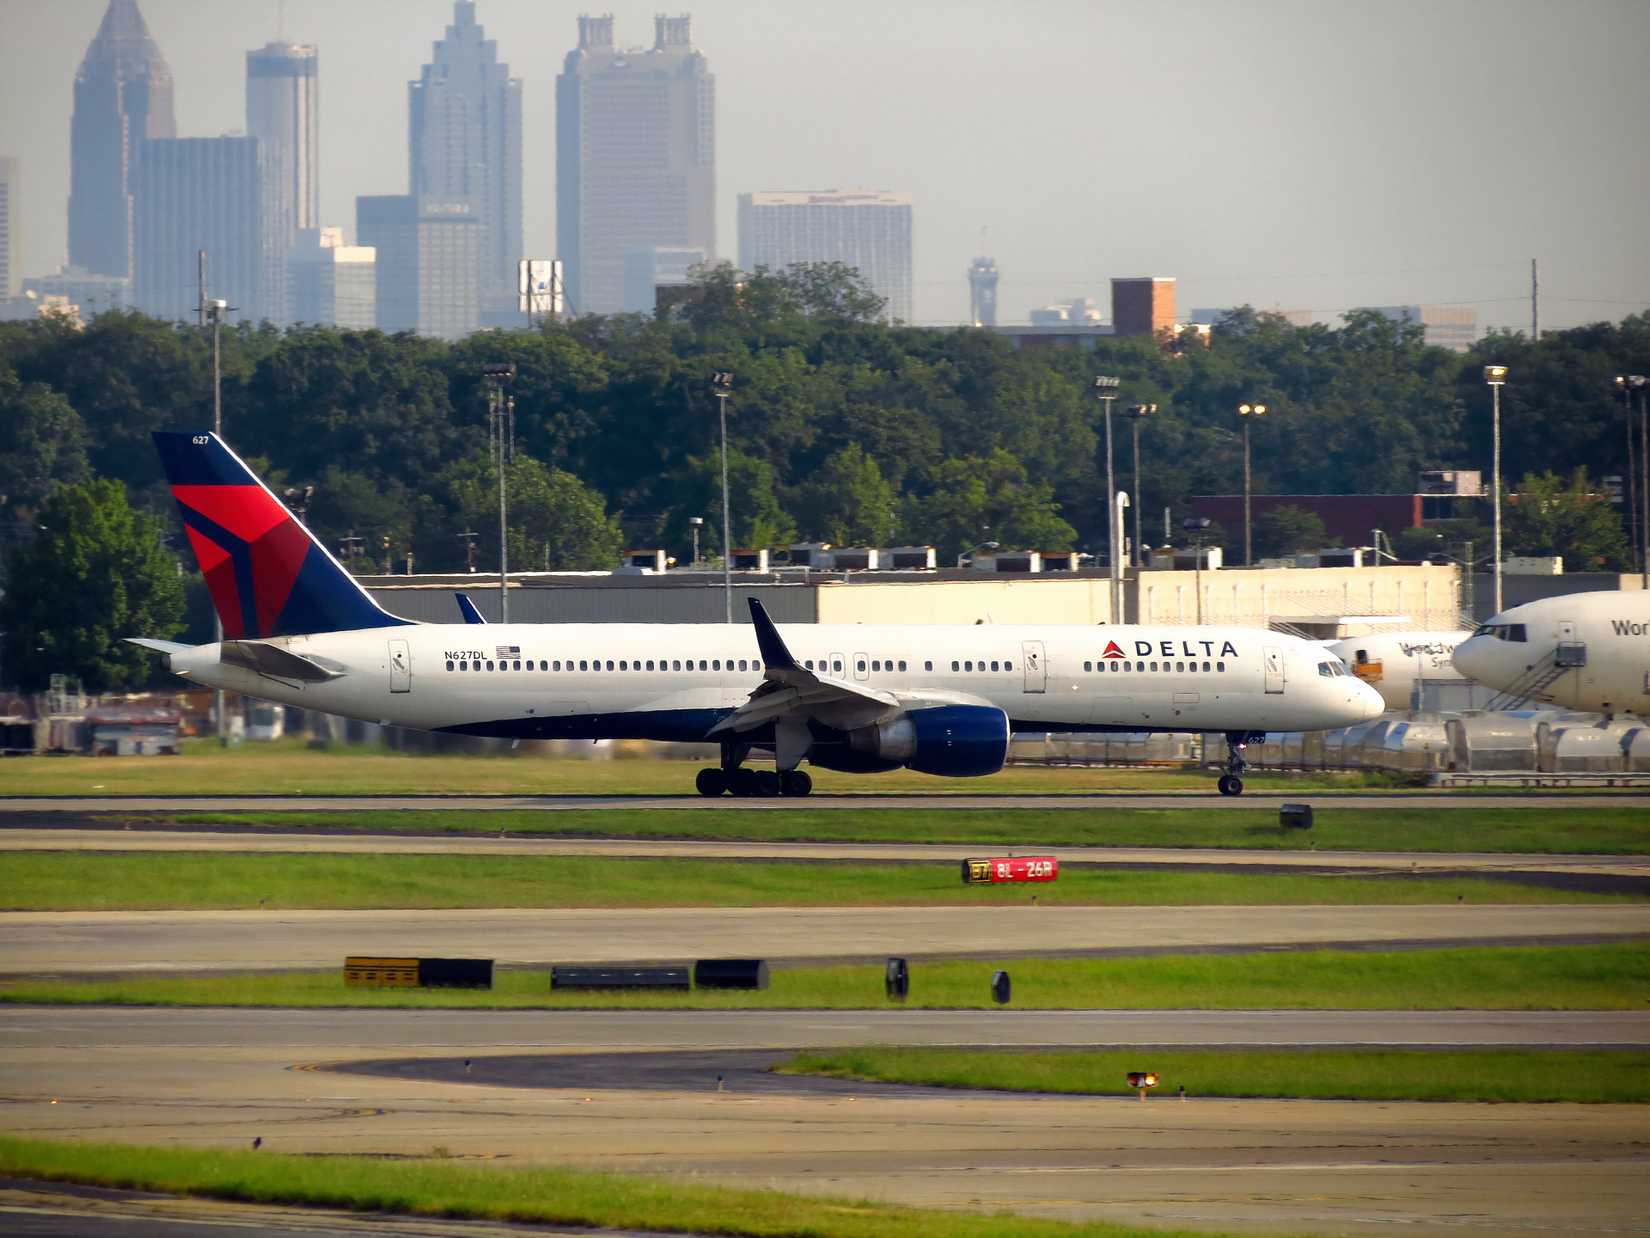
The short answer is black and white. Atlanta processed far more people last year than its counterparts. Some 106.3 million travelers, so almost 12% of all those who caught domestic flights or international services originating in or departing the US, used the hub, figures from global trade body Airports Council International show. That placed the Georgia-based hub as the only airport across the US, but also the world, to record footfall of over 100 million within the calendar year.
In contrast, Dallas welcomed almost 85.7 million departing and arriving fliers in 2025. While a far cry from the number seen at Atlanta, that was still almost a tenth of the US’ entire traffic passing through a single airport. It also meant the key hub in Texas was the fourth busiest globally in terms of footfall, sitting behind  Dubai International Airport (DXB) and
 Tokyo Haneda Airport (HND), as well as Atlanta, of course.
Top ten busiest airports by passenger traffic globally in 2025, from Airports Council International:
Rank
Airport
Passenger traffic
Change vs. 2024 (%)
1
Atlanta (ATL)
106,302,208
-1.6
2
Dubai (DXB)
95,192,160
+3.1
3
Tokyo (HND)
91,679,814
+6.7
4
Dallas/Fort Worth (DFW)
85,660,127
-2.5
5
Shanghai (PVG)
84,994,548
+10.7
6
Chicago (ORD)
84,856,018
+6.0
7
London (LHR)
84,482,126
+0.7
8
Istanbul (IST)
84,437,710
+5.5
9
Guangzhou (CAN)
83,582,952
+9.5
10
Denver (DEN)
82,427,962
+0.1
Both recorded softer figures than a year earlier, mind, with Atlanta welcoming 1.6% and Dallas processing 2.5% fewer people against 2024. While the drop at Atlanta was not enough to wipe out its lead at the top, Dallas’ weaker figures saw it move from third to fourth in the global rankings. But the story is not so simple, with the gap between these two busiest US hubs having appeared to narrow most recently. For now, though, Atlanta’s margin is protected in a large part by one key operator.
Delta Air Lines And American Airlines Key At Busiest US Hubs
Credit: Wikimedia Commons
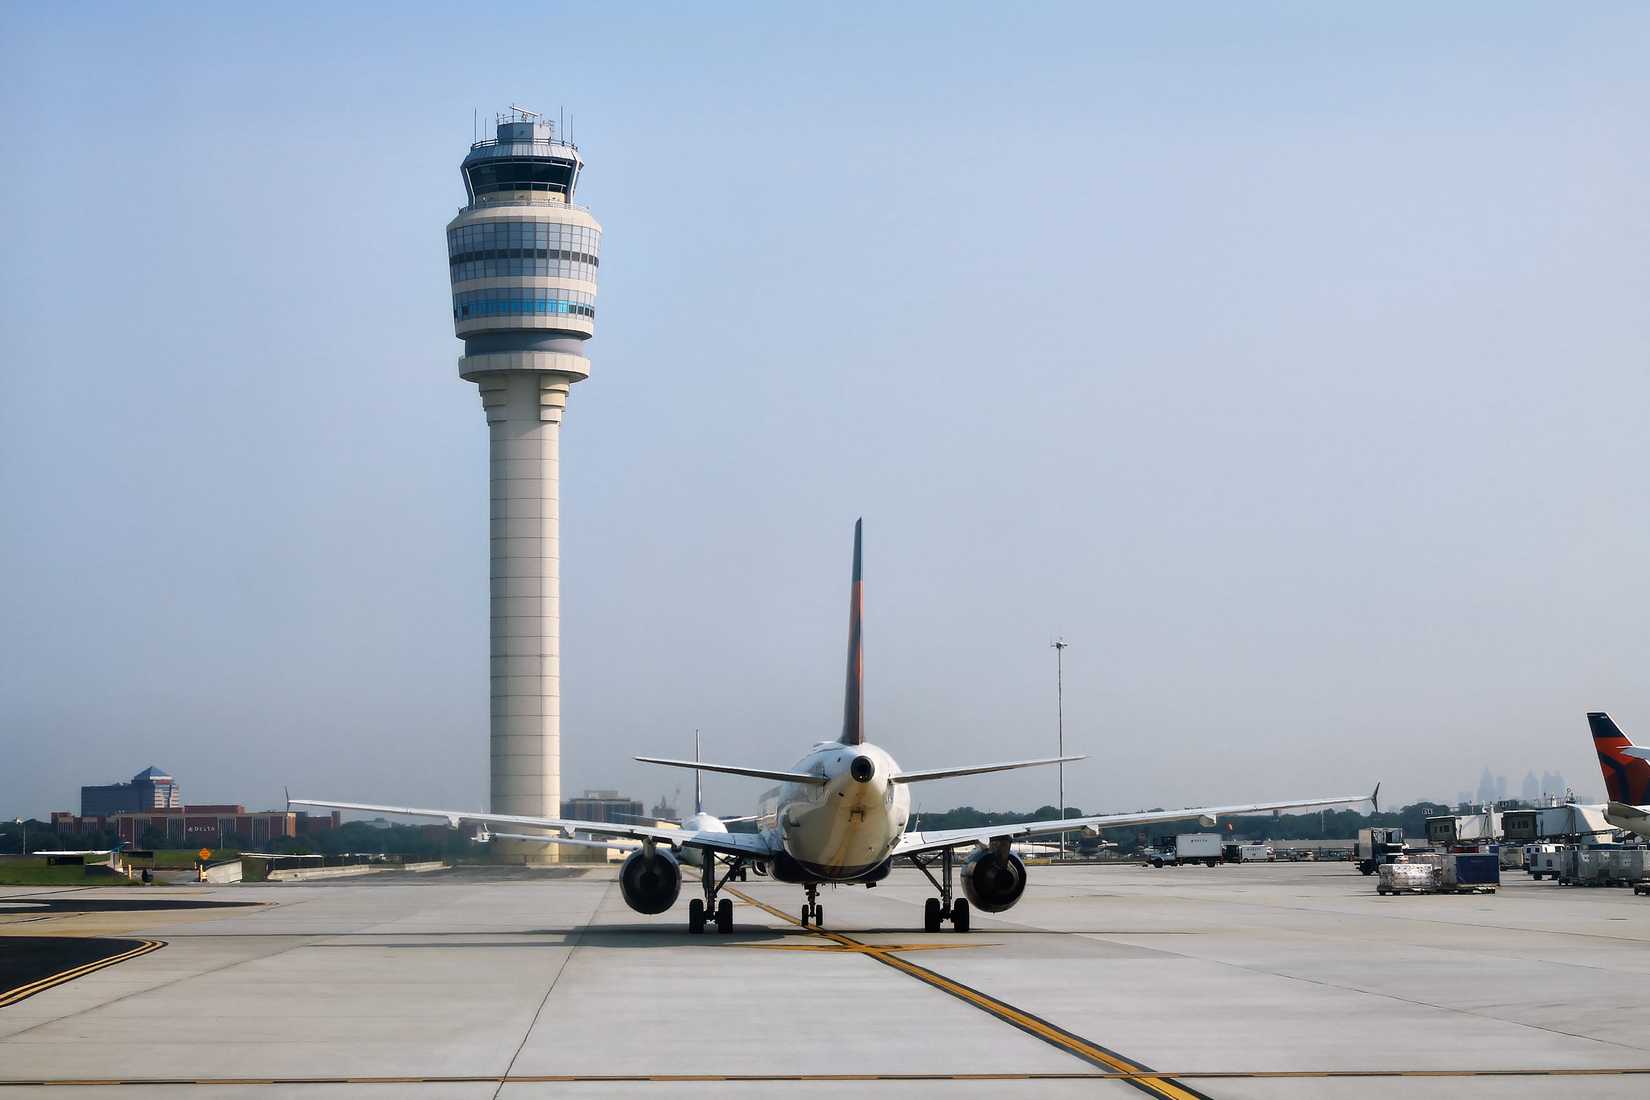
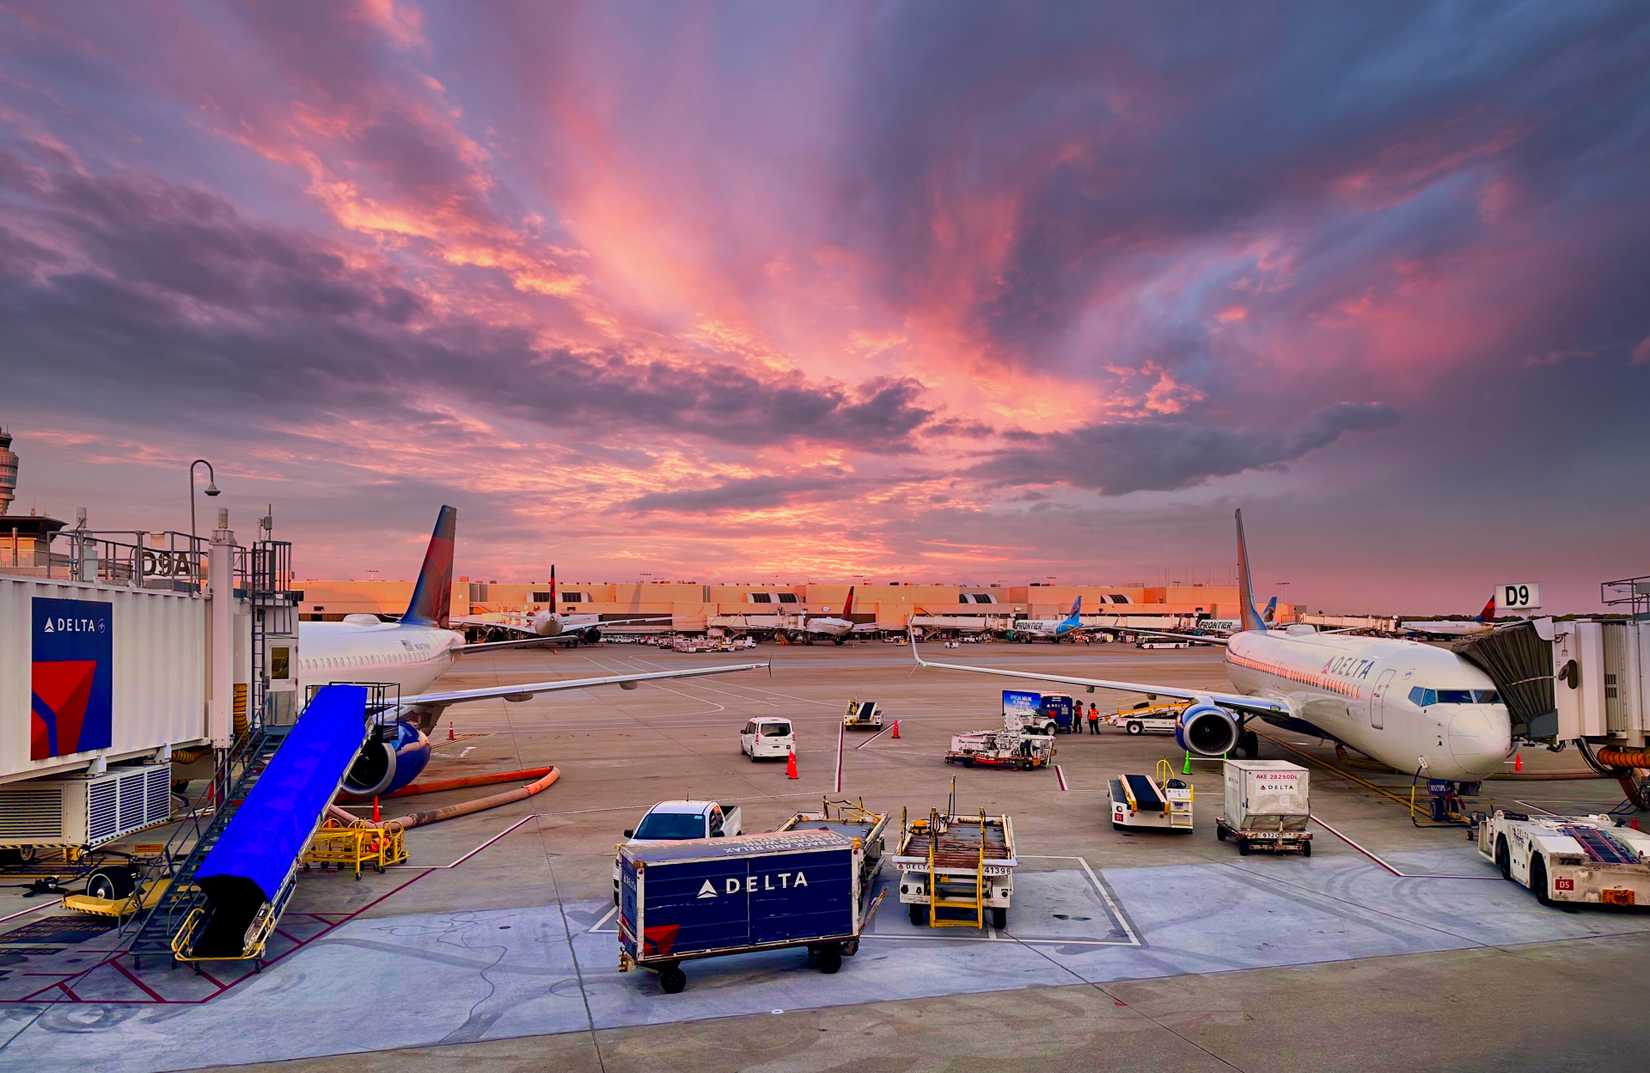
 Delta Air Lines, itself among the biggest airlines throughout the US and the world, relies on a string of primary bases to serve its extensive hub-and-spoke model. The most important of these is arguably Atlanta. Not only does it account for the largest proportion of the carrier’s seats, but it also sits as Delta’s only hub in the Southern US.
Based on OAG analysis of ch-aviation data, Delta’s total scheduled seating capacity hit 246.9 million last year. Atlanta alone accounted for just over 49.2 million of this total, or around 17%. Given the airline boasts 19 key hubs globally and serves over 300 destinations today, that is a huge share for just any one location. The figures are just as stark on the airport’s side, too. Relating to scheduled departing capacity rather than overall actual traffic, seats aboard Delta aircraft made up an eye-watering 78% of the total on flights leaving Atlanta last year.
Delta Air Lines and American Airlines stats at respective key hubs in 2025:
Airline
Airport
Scheduled capacity (2025)
Share of airport’s total scheduled capacity
Delta Air Lines
Atlanta (ATL)
49.2m
78%
American Airlines
Dallas (DFW)
42.1m
82%
Needless to say, Atlanta’s market-leading position both within the US and globally heavily relied on Delta in 2025. This remains the case today, with a massive share of Dallas’ traffic similarly dependent on one main airline. Like Delta at Atlanta,  American Airlines leans on Dallas as a vital cog in its wider model. Scheduled capacity of 42.1 million seats from the Texas hub made up 15% of the total 279.6 million across its network for the year. In turn, American Airlines held an 82% share of Dallas’ overall scheduled capacity.
Related
Atlanta Hartsfield Jackson Keeps Its Lead As The World’s Busiest Airport
The Delta Air Lines hub retains the title as four new airports that were not included in 2019 join the top ten.
Capacity Growth Shows Atlanta-Dallas Gap Currently Narrowing
Credit: Wikimedia Commons
At this point, it is worth clarifying that scheduled capacity and footfall present differing pictures around each airport. Footfall, or actual passenger traffic, reflects how many customers the likes of Atlanta and Dallas handled in practice, and is where the former sat far ahead last year. Scheduled capacity instead shows how many they could process, in theory, in line with their partner airlines’ own planning.
It is in the latest data available for scheduled capacity that the gap between Atlanta and Dallas has narrowed of late. For the month of October, for example, scheduled capacity at Atlanta remained flat at 5.44 million compared to a year earlier, according to a separate analysis by OAG. Dallas experienced a 5% increase in the meantime, to 4.56 million.
Indeed, Atlanta remained ahead by hundreds of thousands of seats, and so its title as the busiest would not necessarily appear under threat anytime soon. That said, the growth at Dallas no doubt helped it edge closer in the short term at least. Interestingly, the figures present another contender for the crown of the US’ busiest airport going forward.
Chicago Growing Faster Than Peers
Credit: Wikimedia Commons
Solely on October’s figures, Chicago trumped Dallas on scheduled capacity. Slightly over five million seats were available for the month from the Illinois hub, after a hefty 8% increase in capacity year over year. This placed Chicago as the second-busiest globally, behind only Atlanta, after it had sat fourth a year earlier.
Notably, that saw Chicago sit approximately 400,000 seats off the top spot for the month. While that was still a fair margin, the 8% growth the airport posted against 12 months earlier itself equated to around 370,000 seats. Such an increase also meant Chicago was the joint-fastest-growing among the world’s top ten alongside Guangzhou Baiyun International Airport (CAN).
Top ten airports globally by scheduled capacity, October 2026:
Rank
Airport
Scheduled capacity
Change vs. Oct 2025
Rank in Oct 2025
1
Atlanta (ATL)
5,443,173
−
1
2
Chicago (ORD)
5,004,041
+8%
4
3
Tokyo (HND)
4,740,189
+1%
3
4
Guangzhou (CAN)
4,665,425
+8%
10
5
Shanghai (PVG)
4,658,154
+6%
7
6
Dubai (DXB)
4,569,653
−15%
2
7
Dallas (DFW)
4,559,582
+5%
8
8
Denver (DEN)
4,399,744
+2%
9
9
London (LHR)
4,387,702
−2%
6
10
Istanbul (IST)
4,370,590
−4%
5
All of that left both Dallas and Chicago closer to the US’ busiest airport than they were a year earlier, albeit with the latter approaching the mark at a faster pace. But October’s figures alone represent a drop in the ocean in terms of overall traffic for the year so far.

Related
7 US Domestic Routes All Served By The Big 3
A closer look at seven non-stop domestic routes served by the ‘Big Three’ legacy airlines in the United States.
Credit: Wikimedia Commons
Unsurprisingly, Atlanta has retained its lead in terms of passenger footfall recorded over the course of this year so far. July marks the most recent month for which data is available from each of the US’ three busiest airports, so figures leading up to the month can be used for a comparison.
This shows Atlanta served a grand total of 61.7 million travelers over the first seven months of the calendar year, making a marginal increase against the same period in 2025. Chicago then came in as the second-busiest in terms of year-to-date footfall. Some 51.3 million people traveled from the airport over the seven months, an increase of over 3% versus a year earlier. In third was Dallas with 49.4 million fliers and just over 1% less than the same seven months in 2025.
Top three busiest US airports by passengers over year so far to July:
Rank
Airport
Total passengers
Total aircraft operations
1
Atlanta (ATL)
61,719,824
470,716
2
Chicago (ORD)
51,331,341
536,644
3
Dallas (DFW)
49,441,831
427,020
So, again, Chicago was the fastest-growing of the trio over the period in terms of footfall, a trend also seen in the October scheduled capacity data. All of that means it should be on course to steal second place from Dallas for the full year.
Atlanta Some Way Off Losing Crown As US’ Busiest
Credit: Wikimedia Commons
Atlanta no doubt looks set to remain both the US’ and world’s most active airport for the full year on passenger traffic. As the only airport to serve more than 100 million people last year, it already held a firm grip on the title. Its closest competitor in regard to traffic last year, Dubai, has since seen figures tumble on the back of disruption caused by the Iran war.
Nonetheless, faster growth at the likes of Chicago and Dallas in terms of scheduled capacity most recently has threatened to narrow the gap. As to whether either will surpass Atlanta in the years ahead, the sweeping investment being made currently at each will no doubt play a large part.