

The Bank Nifty showed relative resilience, edging higher by606.05 points or 1.11% to settle at 55,149.40, reflecting selective buying interest in financial names.
Buy: L&T FINANCE LTD — current price: ₹222.70
Why it’s recommended: L&T FINANCE LTD is exhibiting strong momentum, with the daily RSI at 71, reflecting bullish strength. The MACD is positive at 4, while ADX at 24 indicates a strengthening trend phase. The stock has recently hit a new lifetime high, confirming strong buying interest and an ongoing structural uptrend. Additionally, it has given a rectangle breakout at the ₹197 level, establishing a fresh base for continuation of the rally.
Key metrics: Pattern: Rectangle breakout at ₹197, now in lifetime high zone
RSI: 71, strong bullish momentum
MACD: Positive at 4
ADX: 24, trend strengthening
Technical view: Breakout and momentum indicators support upside towards ₹240.
Risk factors: A close below ₹214 would weaken the bullish setup.
Buy at: ₹222.70
Target price: ₹240
Stop loss: ₹214
Buy: UNO MINDA LTD — Current Price: ₹1265.80
Why it’s recommended: UNO MINDA LTD has turned highly bullish with daily RSI at 75, nearing overbought but confirming strength. Momentum indicator at 158 has generated a fresh buy signal, while ADX at 28 suggests the trend is gaining traction. The stock’s price structure and momentum setup point towards further upside.
Key metrics: Pattern: Continuation rally after strong momentum breakout
RSI: 75, strong positive momentum.
Momentum indicator: 158, confirming buy signal
ADX: 28, steady trend strength
Technical view: Trend setup supports a move towards ₹1345.
Risk factors: A close below ₹1222 would invalidate the bullish bias.
Buy at: ₹1265.80
Target price: ₹1345
Stop loss: ₹1222
Buy: CUMMINS INDIA LTD — Current Price: ₹3916
Why it’s recommended: CUMMINS INDIA LTD is demonstrating strong bullish momentum, with the daily RSI at 75, ADX at 42, and MACD at 98 — all confirming a robust trend setup. On the 45-minute chart, the stock has given a breakout from the upper channel of a falling wedge pattern, signaling fresh upside. Importantly, it has closed above the key level of ₹3878, strengthening the breakout validity and supporting further momentum.
Key metrics:
Pattern: Falling wedge upper channel breakout on lower timeframe
RSI: 75, sustaining bullish momentum
MACD: Positive at 98
ADX: 42, confirming trend strength
Technical view: Breakout above ₹3878 suggests further rally potential towards ₹4025.
Risk factors: A close below ₹3858 would negate the bullish setup.
Buy at: ₹3916
Target price: ₹4025
Stop loss: ₹3858
Market Wrap – August 25, 2025 (Monday)
Sector-wise, market action remained mixed. Weakness was visible in theMetal (−1.25%),PSU Bank (−1.12%), andBanking (−1.09%) indices, which capped broader gains. In contrast, strength came fromPharma (+0.39%) andHealthcare (+0.11%), highlighting investors’ tilt towards defensives and consumption-oriented counters.
In the stock-specific space,M&M Industries emerged as the standout performer, surging0.83%.Maruti added0.48%, whileBharti Airtel climbed0.18%, supported by favorable momentum in their respective sectors. On the flip side, some heavyweights exerted pressure—Asian Paints slipped2.42%,Grasim declined2.34%, andAdani Enterprises fell2.20%.
Globally, optimism was reinforced as softer-than-expected U.S. inflation data rekindled expectations of a September rate cut by the Federal Reserve. On the domestic front, retail inflation cooling to aneight-year low of 1.55% further bolstered confidence. Despite these positives, profit-taking in select heavyweights dragged the Nifty lower, though the index managed to hold above the24,600 support zone.
Nifty Technical Analysis – Daily & Hourly
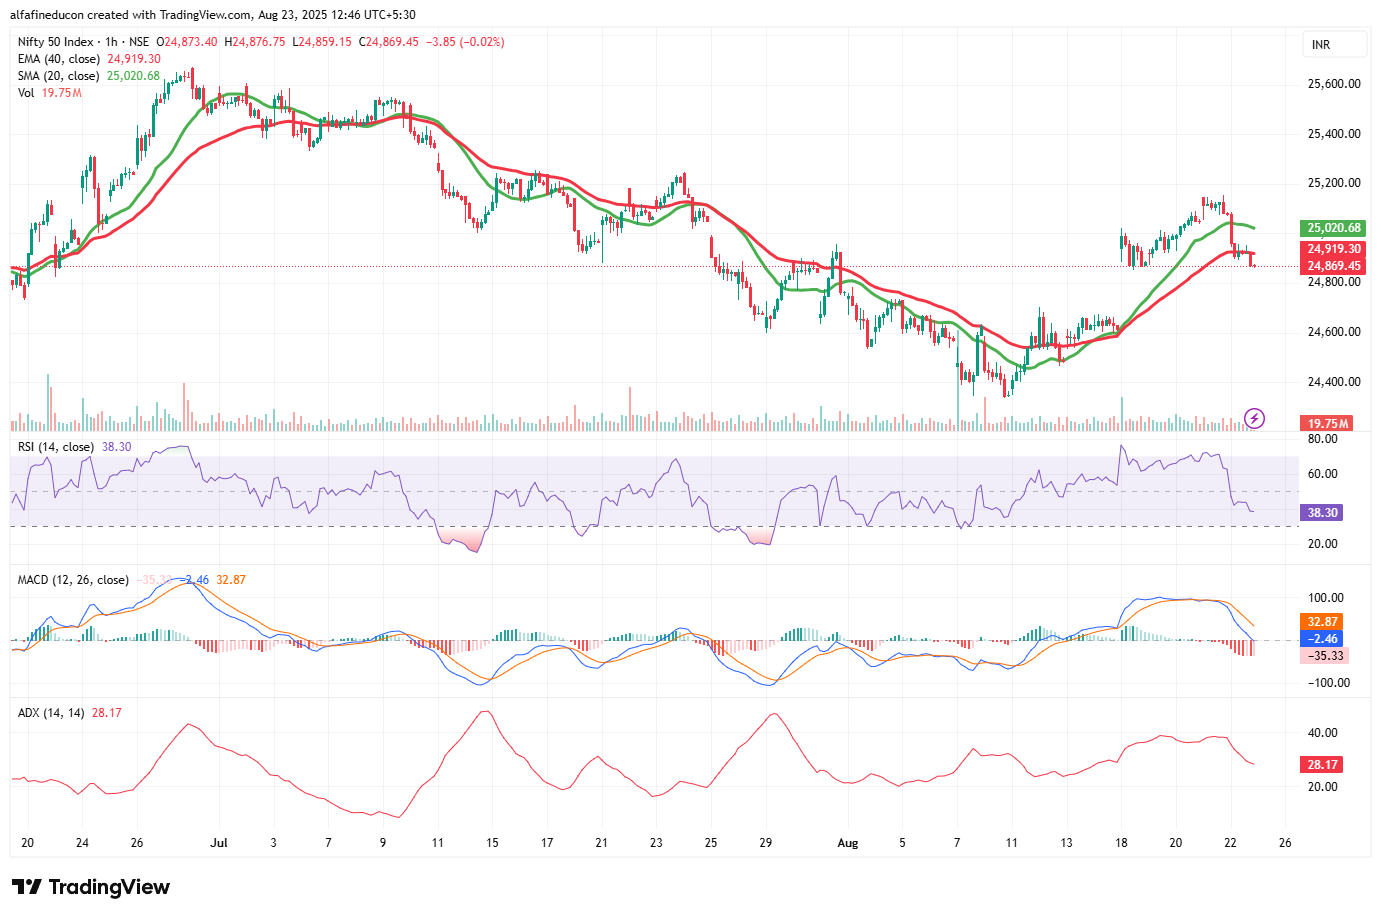
The Nifty 50 ended the session on 22nd August 2025 under pressure, slipping below the 25,000 zone as weak momentum and bearish derivative positioning weighed on sentiment. The index is now showing signs of fatigue after its recent consolidation, with technical and OI data hinting at further volatility in the upcoming session.
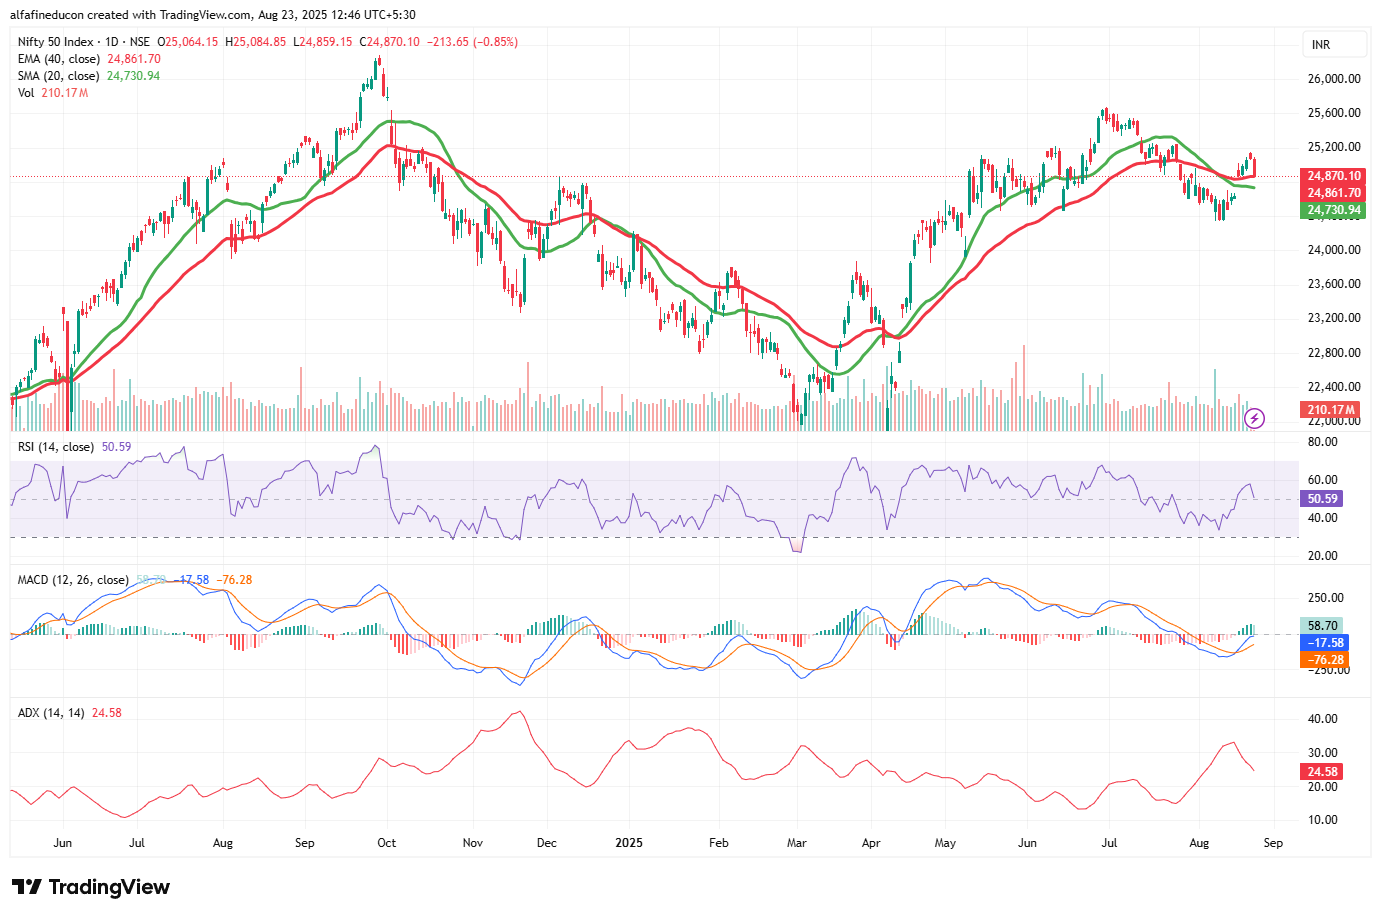
From a technical perspective, the index continues to hover just above its medium-term moving averages, with the 20-DMA at 24,779 and 40-DEMA at 24,890 acting as critical downside support levels. On the daily timeframe, the RSI has slipped to 49, reflecting waning momentum and a neutral-to-weak setup, while the MACD remains in negative territory at –20, suggesting bearish undertones have not yet reversed. On the hourly chart, the 20-HMA at 25,049 is still positioned above the 40-HEMA at 24,959, keeping a mild bullish crossover intact. However, the hourly RSI has dropped sharply to 35, slipping into the negative territory, while the MACD has turned down to –10, indicating near-term bearish momentum is starting to dominate.
On the derivatives front, the picture has turned distinctly bearish. The overall Call OI (19.42 crore) now far outweighs the Put OI (12.04 crore), creating a negative OI differential of –7.38 crore. The day’s change data also reinforces the bearish bias—total Call OI rose sharply by 9.95 crore, while Put OI increased only by 2.53 crore, resulting in a negative differential of –7.42 crore. This highlights aggressive call writing at higher strikes compared to limited put writing. The maximum Call OI as well as the highest change is concentrated at the 25,000 strike, cementing this level as the immediate supply zone. On the Put side, the maximum OI is placed far lower at 24,000, while fresh additions were seen at 24,900, indicating that traders are shifting their protective positions closer to current levels.
In summary, the short-term market structure has weakened, with heavy call writing at 25,000 now creating a strong overhead resistance. Sustaining above this level appears difficult in the near term unless fresh buying emerges. On the downside, the 24,779–24,890 zone, aligned with the 20-DMA and 40-DEMA, will be the first line of support. A breakdown below this band could open the gates for a slide towards 24,600–24,400.
With daily momentum indicators softening, hourly charts reflecting bearish pressure, and derivatives data pointing to strong resistance at 25,000, the market is likely to remain under pressure in the next session. A decisive move below key supports could accelerate selling, while only a sustained reclaim above 25,000 would negate the bearish setup and revive upward momentum.
Ankush Bajaj is a Sebi-registered research analyst. His registration number is INH000010441.
Investments in securities are subject to market risks. Read all the related documents carefully before investing.
Registration granted by Sebi and certification from NISM in no way guarantee performance of the intermediary or provide any assurance of returns to investors.
Disclaimer: The views and recommendations given in this article are those of individual analysts. These do not represent the views of Mint. We advise investors to check with certified experts before making any investment decisions.