
Static and dynamic optical behavior of MoS2 bilayers
The TMD structures used in our work are made of monolayers (MLs) and bilayers (BLs) of MoS2 encapsulated in hBN, placed on distributed Bragg reflectors (DBRs), for the subsequent fabrication of optical microcavities. Unless specified, all the spectroscopy experiments in this work are performed at T = 8K. Figure 1a shows the Reflectance Contrast (RC) spectra of ML and BL MoS2 outside the cavity. The absorption of the intralayer A exciton in the BL (XA−BL) is higher than in the ML, due to presence of the additional layer. In the BL a new excitonic resonance appears at ≈2 eV, which is attributed to dipolar hybridized interlayer excitons (hIX) with a high oscillator strength, resulting from the coherent tunneling of holes between the valence bands of the two layers (Fig. 1a inset)55,56.
Fig. 1: Optical characterization of the BL MoS2.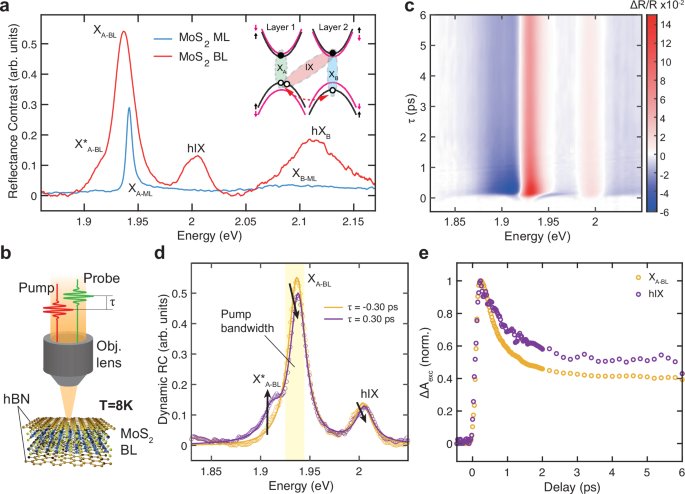
a Static RC spectra of a ML and BL MoS2 encapsulated in hBN. RC = (Rsub − RTMD)/Rsub, where RTMD is the reflectance of the sample, while Rsub is taken on the substrate. Inset: sketch of the band diagram in MoS2 BL; the dashed red line indicates the coherent tunneling of holes. b Sketch of the MoS2 BL encapsulated in hBN (out of scale) measured by pump-probe micro-spectroscopy. c Transient differential reflectivity map as a function of delay time τ and probe photon energy measured for MoS2 BL. d Dynamic RC of the MoS2 BL at negative (before pulsed excitation) and positive (after pulsed excitation) delay times, extracted from the differential reflectivity map in c. Solid curves show the Lorentzian fit of the dynamic RC. Black arrows show optical saturation and energy shift of the XA−BL and hIX transitions, and the photo-induced absorption of the \({{\rm{X}}}_{A-BL}^{*}\) trion. The shaded yellow area displays the energy and bandwidth of the pump pulses. e Normalized exciton peak amplitude variation (ΔAexc) of XA−BL and hIX, extracted from the dynamic RC at different time delays.
We study the ultrafast response of MoS2 excitons by ultrafast TR micro-spectroscopy. We deliver two collinear pulses, a narrow-band pump and a broad-band probe, focused on the sample using a microscope objective (Fig. 1b). We then vary the delay time τ between them and monitor the changes in the broadband reflectivity spectrum of the probe (see Methods for experimental details). Figure 1c shows the differential reflectivity (ΔR/R) map measured as a function of the probe photon energy and pump-probe delay for a BL MoS2, tuning the energy of the pump pulses at ≈ 1.94 eV, in resonance with the XA−BL.
Generally, the shape of the TR spectra in TMD MLs is a result of multiple effects, such as optical saturation (photo-bleaching), line broadening and spectral shift of the exciton peaks, leading to positive and negative TR signals around the exciton energies57. To show more clearly the temporal evolution of the exciton features in our system, we perform an analysis of the transient ΔR/R response based on the Transfer Matrix Method (TMM) to extract the time-dependent RC spectra of the material (see Methods for details)58. Figure 1d shows the MoS2 BL dynamic RC spectrum at a delay of 0.3 ps (purple curve), compared to the one before the pump pulse ( − 0.3 ps, orange curve). We fit the dynamic RC with three Lorentzians (solid lines in Fig. 1d) to extract the time-varying intensity and energy shift of each excitonic mode. After excitation, the XA−BL peak is quenched and slightly blue-shifted. The small shoulder at 1.91 eV appearing at positive delays is instead related to a photo-induced absorption of the trion (\({{\rm{X}}}_{A-BL}^{*}\))59,60,61. Since the excitation pulses are in resonance with XA−BL (shaded yellow area in Fig. 1d), at lower energies compared to hIX, we would expect negligible optical saturation of the latter if the two excitonic species were totally uncoupled. On the contrary, we observe a photo-bleaching of the hIX absorption, although less intense than in the XA−BL case. This indicates their hybridization with intralayer excitons due to the coherent hole tunneling between the valence bands of the two layers and to the fermionic interactions between holes of XA−BL and hIX sharing the same valence band (see inset of Fig. 1a)54.
Tracking the RC peak intensity as a function of the delay time, we can extract the ultrafast dynamics of the excitonic species (Fig. 1e). The transient behavior of exciton energies and linewidths is shown in Supplementary Note S1. For both XA−BL and hIX, the exciton population rises instantaneously (within the ≈ 100 fs temporal resolution of our setup), then decays exponentially, with about 50% of the initial population already relaxed within 2 ps (a comparison with MoS2 ML exciton dynamics is reported in Supplementary Note S2). The fast exciton decay time is similar between XA−BL and hIX.
The ultrafast nonlinear optical response of mono and few-layers TMDs has been studied extensively in the past62,63,64. Transient exciton line shifts in TMDs are usually ascribed to Coulomb interactions at short time scales (few ps)58,65, or bandgap renormalization66, and to transient heating effects67 at longer times (from tens to hundreds of ps). Exciting TMD monolayers close or below the exciton energy also leads to strong and instantaneous (within the pump pulse duration) line shifts due to the optical Stark effect68,69. High exciton densities in TMDs lead to optical saturation, due to phase-space filling (i.e. Pauli blocking)67, and line broadening caused by excitation-induced dephasing57. Tracking the time-dependent exciton saturation in ultrafast pump-probe experiments allows monitoring the exciton population dynamics.
In MoS2 BLs we observe a bi-exponential population decay with a fast and a slow component. While in MLs the fast decay is usually attributed to radiative and non-radiative relaxation processes of bright excitons70, in BLs it is more probably related to electron-phonon inter-valley scattering processes from the K points to the lowest energy point of the Brillouin zone71,72,73. The slow decay component can be related to phonon-assisted recombination from dark states70 or defect-mediated non-radiative recombination74.
Femtosecond switching of the strong coupling regime
We exploit the highly nonlinear exciton interactions in MoS2 BL to drastically modify the light-matter coupling strength in microcavities on ultrafast time-scales. The microcavity samples are fabricated by covering the hBN-encapsulated MoS2 heterostructures placed on DBRs with a transparent polymeric spacer (polymethylmethacrylate, PMMA) and a top silver (Ag) mirror, as illustrated in Fig. 2a. We perform k-space (Fourier) spectroscopy to image the angular dispersion of the monolithic cavity embedding the MoS2 BL (Fig. 2b). Two distinct anticrossings appear when the cavity mode is in resonance with XA−BL and hIX energies, a clear signature of the SC regime, resulting in upper, middle and lower polariton branches (UPB, MPB, LPB). Fitting the dispersion with a three coupled oscillators model, we extract Rabi splittings of \({\Omega }_{{{{\rm{A}}}}_{{{\rm{BL}}}}}\)= 42 meV and ΩhIX= 23 meV for XA−BL and hIX, respectively. We also fabricated a microcavity with a similar structure embedding a MoS2 ML, which shows an anticrossing between the cavity mode and intralayer excitons with a Rabi splitting of \({\Omega }_{{{{\rm{A}}}}_{{{\rm{ML}}}}}\)= 28 meV. The latter is reduced compared to the BL cavity due to the lower absorption (see Supplementary Note S3 for the static analysis of the ML cavity).
Fig. 2: Ultrafast switching of strong coupling in a MoS2 BL microcavity.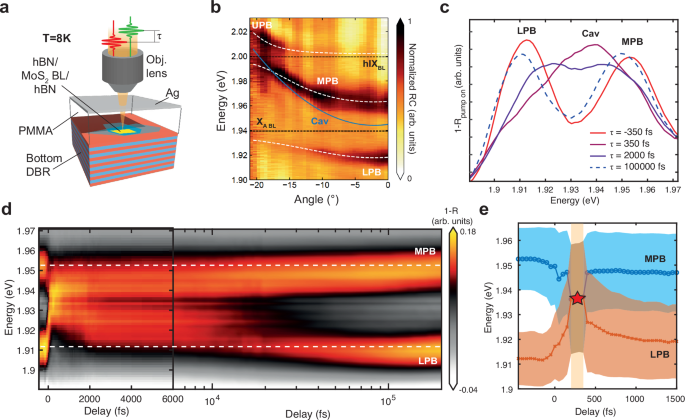
a Sketch of the MoS2 BL microcavity structure measured by pump-probe spectro-microscopy. b Color map of the angle-resolved RC spectra of a microcavity embedding a BL MoS2 in strong coupling regime, showing two distinct anticrossings around the XA−BL and hIX energies (black dashed lines) respectively. The coupled oscillators model fit (white dashed lines) and the cavity mode dispersion (blue line) are shown in overlay. c 1-R spectra of the BL microcavity taken at different pump-probe delays, pumping the system at 1.94 eV with 3.75 pJ. Immediately after excitation, the polariton branches collapse in a central weakly coupled cavity mode. d Color map of the 1-R spectra of the BL microcavity as a function of the pump-probe delay showing the ultrafast collapse and later revival of the MPB and LPB (white dashed lines). e Results of Gaussian fits of the polariton/cavity modes dynamic spectra extracted from Fig. 2d. The blue (orange) trace refers to the MPB (LPB) peak energy, while the shaded areas depict the linewidth of the modes (Full Width Half Maximum, FWHM). Under the shaded yellow area only a weakly coupled cavity mode can be fitted, with the red star highlighting the crossing region between strong and weak coupling regimes.
We use ultrafast TR spectroscopy to excite the MoS2 BL-based microcavities with narrowband ultrashort pulses tuned at the energy of XA−BL. To better visualize the dynamic behavior of polariton spectrum, we plot directly the reflectance (1-R) spectra measured on the cavity as a function of delay time and probe photon energy (Fig. 2c, d), while we include the TR data of the same measurement in Supplementary Note S4. Considering that in the spectral region of interest the reflectance of the cavity without the TMD is close to 1, plotting 1-R as a function of time is equivalent to showing the dynamic RC. We focus our analysis on incidence angles close to normal, on the anticrossing between the cavity mode and the XA−BL, resulting in the MPB and LPB. In a stark contrast to the out-of-cavity experiments, we do not observe a direct reduction of the exciton absorption in this measurement, but we monitor it indirectly through huge shifts of the polariton states. At negative delays, MPB and LPB are clearly separated, located at 1.953 eV and 1.911 eV respectively. When the pump and probe pulses are synchronous, the two polariton peaks collapse symmetrically in one broad central peak at ≈ 1.94 eV (purple line in Fig. 2c). Already after 2 ps, the two polariton branches start to reappear, while after 100 ps they have almost completely recovered. The 1-R map as a function of the time delay (Fig. 2d) shows more clearly the complete collapse and revival of polaritons, which can be only explained as a reversible transition from the strong to the weak coupling regime. In our system, the collapse of SC is mostly related to a large density of uncoupled excitons which saturates the optical transition. The SC recovery is consequent to the relaxation of such excitons, leading to a regaining of oscillator strength. In fact, we note that the SC recovery follows well the dynamic absorption of the excitonic species measured outside the cavity (Fig. 1e and Supplementary Note S5), being a direct consequence of density-dependent optical saturation of excitons. The two polariton branches show different recovery times depending on their Hopfield coefficients, and in particular on their photonic component. In fact, a polariton branch with a larger photonic character will be closer in energy to the weakly coupled cavity mode, leading to a faster recovery. Therefore, a positive detuning benefits the MPB recovery over the LPB one, as shown in Fig. 2d, while the opposite happens for negative detunings (see Fig. S13).
We performed a quantitative analysis of the ultrafast behavior of MoS2 BL polaritons by fitting the experimental 1-R peaks with Gaussian functions. The results are shown in Fig. 2e, where the extracted peak energies and linewidths are plotted against the time delay up to 1.5 ps. Within few hundreds of femtoseconds from the zero-delay, the LPB shows a blueshift of about 27 meV, while the MPB redshifts by about 14 meV, merging in a single peak at about 250 fs. Such huge shifts cannot be explained just taking into account the bare exciton energy variations, which are in the order of only a few meVs (Fig. 1d). When the energy separation of the polariton states is lower than the linewidth of the cavity mode or the exciton, the anticrossing is not visible anymore and the system falls into the weak coupling regime (red star in Fig. 2e). Already after ≈ 500 fs, the SC is recovered. The Q factor of our cavity is about 190, leading to a photon lifetime of ~ 65fs, being much faster than the observed recovery dynamics. This suggests that such behavior is dominated by incoherent excitonic processes. We note that in the weak coupling, the cavity mode is strongly broadened by the background absorption of the excitons, already broad due to excitation-induced dephasing57. Such broadening also affects the polariton peaks after the collapse, as shown in the color bars of Fig. 2e, which become more discernible only after 2 ps. The polariton linewidths narrow down even more after 10 ps, when the effects of excitation induced dephasing fade away, as shown in Supplementary Note S11. To a first approximation, we can consider that the strong to weak coupling full transition is reached when the Rabi splitting is equal or below the unperturbed exciton linewidth (the FWHM of XA−BL, γ0exc, is ~ 20 meV in static conditions). A more precise definition of strong to weak coupling threshold implies that the energy exchange between cavity and exciton resonances is larger than the difference between the loss rates75,76. On the other hand, considering in our case the exciton line broadening caused by excitation-induced dephasing, this becomes a less stringent criterion, as discussed later in this section (Fig. 3c).
Fig. 3: Control of strong coupling switching.
a BL cavity 1-R spectra taken at a delay time of 250 fs, pumping the system at increasingly higher pulse energies. b Simulated cavity spectra for increasing exciton-polaritons densities in the MoS2 BL. c MPB-LPB energy difference as a function of delay time for ultrafast SC switching experiments in BL cavities at different pump pulse energies, normalized to the value before excitation. Error bars are drawn from the confidence interval of the double peak fits. The dashed black curve shows the trend of the exciton-cavity linewidth difference, while the red dashed-dotted line shows the linewidth of the unperturbed exciton, both normalized by the polariton splitting value before excitation. The weak coupling time window duration can be tuned by changing the excitation pulse energy. d Sketch of the experimental configuration used to produce delayed double pump pulses. M mirror, BS beam splitter, Pol polarizer. e Color map of the 1-R spectra of the BL microcavity as a function of the delay time, excited by double pump pulses delayed by ≈4 ps.
Leveraging on the large binding energy of excitons in TMDs, we fabricated an additional BL MoS2 microcavity in SC regime at RT. We performed a full SC switching also in this device at ambient conditions, shifting the LP by about 20 meV using a pump pulse energy of ~ 1.8 pJ (see Supplementary Note S11).
Finally, we observed a similar SC collapse also in the microcavity embedding a ML of MoS2, but in that case the longer exciton lifetimes led to a much slower SC recovery, while the smaller Rabi splitting worsened the on/off contrast, i.e. the signal intensity ratio between the 1-R spectra of the cavity in the unperturbed SC and weak coupling conditions respectively (see Supplementary Note S6). The switching contrast is influenced by a number of factors. The most important ones are the visibility of the polariton modes, controlled by the detuning, the maximum achievable dynamic energy shift, directly proportional to the Rabi splitting, and the exciton and polariton linewidth broadening. The latter can significantly worsen the switching contrast and is also dependent on the exciton density and the pump fluence. Reducing the static and dynamic exciton and polariton broadening or enlarging the Rabi splitting will increase the on/off contrast.
The pump pulse energy plays a major role in the SC switching dynamics, as shown in Fig. 3a where MoS2 BL cavity spectra taken at a delay of 250 fs for different excitation pulse energies demonstrate the gradual quenching of the Rabi splitting. The SC collapse in TMD cavities is a direct consequence of exciton nonlinear interactions, which scale proportionally to their density54. We demonstrate this effect by carrying out theoretical simulations of the cavity 1-R spectra using the TMM (Fig. 3b), employing the MoS2 BL optical constants calculated from the exciton nonlinear absorption as a function of the density (see Supplementary Note S7). The match between experiments and simulations proves that the main cause behind the observed femtosecond switching of the SC regime is the optical saturation and broadening of MoS2 BL excitons at high excitation densities, which recovers very rapidly due to the fast radiative and non-radiative exciton relaxation mechanisms in this system.
Figure 3c reports the MPB-LPB energy difference against the time delay, normalized with respect to its value before excitation. In this figure, the blue dots are related to the experiment reported in Fig. 2, performed at 3.75 pJ (pump fluence: 212 μJ cm−2), and show the recovery of SC occurring on two different time-scales, a fast one within 1 ps and a slow one which is concluded after ≈ 100 ps. We ascribe those two recovery steps to the population decay dynamics of the bare excitons (see Fig. 1e and Supplementary Note S5). The red dashed horizontal line in Fig. 3c represents the threshold when the polariton splitting is smaller than the unperturbed exciton linewidth (γ0exc), while the black dashed curve shows the time-dependent normalized difference between exciton and cavity linewidths. While the cavity linewidth remains approximately the same in all the experiments ( ~ 10 meV), the exciton linewidth changes with fluence and time because of excitation-induced dephasing. We extract the transient XA−BL linewidth, γexc(t), analysing the time-dependent reflectivity of the out-of-cavity sample, excited with a pump fluence comparable to the ones used in the cavity experiments (see Supplementary Note S5). Using the exciton-cavity linewidth difference to set the threshold for SC, the switching is not as sharp, but it still occurs in a sub-picosecond time window, between ~ 50 fs and ~ 700 fs, pumping with 3.75 pJ. On the other hand, using such a definition for the strong to weak coupling transition, the pulse energy to induce the SC collapse will decrease. At the SC switching pump energy threshold, we estimated a peak polariton density of about 105μm−2. Increasing or decreasing by few picojoules the excitation energy, we can extend the temporal window of weak coupling regime (7.5 pJ, red dots in Fig. 3c) or suppress the transition (2.5 pJ, yellow dots in Fig. 3c).
We provide a theoretical explanation on the energy dependent dynamic SC switching upon direct excitation of the intralayer excitons, considering several possible contributions to the dynamics. We note that the ≈ 1 ps timescale for the fast recovery coincides with the bare XA−BL exciton fast decay. However, this short timescale cannot account for the later slower recovery ( ~ 100 ps) of the Rabi splitting, indicating that a significant exciton population remains in the sample and nonlinear phase space filling impacts the spectrum. One plausible explanation is the existence of long-lived dark excitonic states at lower energies77,78. In this case photoexcited excitons can be transferred to such states which interact with light weakly, forming a reservoir that contributes to the nonlinear phase space filling. In a bilayer MoS2, low-energy states are represented by spin-forbidden states due to spin-orbit coupling, or momentum-forbidden states77 due to indirect bandgap78. These states possess a very long lifetime and can explain the TR dynamics. The corresponding model is summarized in the Methods, while we provide more details about the simulated polariton dynamics in Supplementary Note S8.
Leveraging on the ultrafast recovery times of SC in our samples, we demonstrate the possibility to modulate light-matter interactions at very high frequencies, illuminating the cavity with two subsequent pump pulses at 1.94 eV delayed by only ≈ 4 ps. To produce such pulse pair, we used a birefringent YVO4 crystal with optical axis rotated by 45° with respect to the polarization of the incoming pump pulse, followed by a linear polarizer (see Fig. 3d and Methods for more details). The first pulse energy was tuned to be slightly lower than in the experiment of Fig. 2 in order to get a faster SC recovery, while the second pulse energy was adjusted to take into account the residual exciton population after the first pulse. The resulting transient 1-R map shows two reversible on/off cycles (Fig. 3e), proving a very fast switching frequency of ≈ 250 GHz. We note that this value was limited by technical constraints (the fixed delay between the pulse pair determined by the thickness of the available YVO4 crystal), while the theoretical limit is given by the recovery time of the SC.
Ultrafast SC switching by interspecies interactions
We exploit the interspecies exciton interactions specific of MoS2 BL to generate optical saturation of XA−BL acting on the hIX, exciting selectively the latter and probing the quenching of the Rabi splitting on XA−BL (Fig. 4a). This process relies on nonlinear fermionic interactions (i.e. involving a single charge carrier constituting the exciton) between the two excitonic species: the XA−BL valence band is shared with hIX, therefore exciting the latter causes optical quenching of the former, due to Pauli blocking of holes for XA−BL54. Figure 4b shows the transient 1-R map of the MPB-LPB, pumping the hIX of the BL: the femtosecond switching of SC regime occurs very clearly also in this case. Comparing this result with the previous case of resonant XA−BL pumping (Fig. 2c), the fast SC recovery is even more distinct, with the two polariton peaks being clearly visible and well separated already after 1 ps, as shown in Fig. 4c.
Fig. 4: Ultrafast strong coupling switching by interspecies interactions.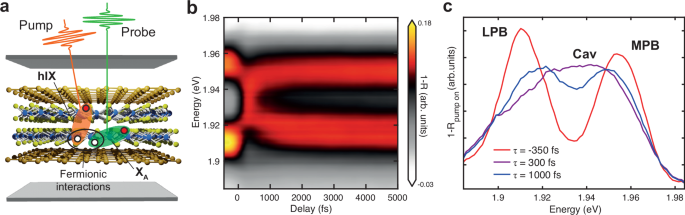
a Sketch of the MoS2 BL cavity measured in pump-probe, exciting the hIX spectral region and probing the polariton states formed around XA−BL. b Color map of the 1-R spectra of the BL microcavity as a function of the delay time, exciting the hIX and probing the MPB-LPB spectral region. c 1-R spectra of the BL microcavity pumping the hIX, taken at different pump-probe delay times. Already after 1 ps, the polariton peaks are clearly recovered.
The dynamics of the nonlinear response when pumping in resonance with the hIX is also consistent with the developed model based on the nonlinear saturation and phase space filling from the long-lived states (see Methods). In this case, we considered similar lifetimes for hIX compared to XA−BL, but we assumed the rate for transferring the pumped hIX to the long-lived reservoir states contributing to the phase space filling to be smaller than in the XA−BL case. This may be understood as the result of the hIX’s wavefunction spreading in the out-of-plane direction. This implies that hIX is less 2D than XA−BL, leading to a weaker scattering effect with disorder and to a smaller transfer rate. Furthermore, thermalization through exciton-phonon scattering is another important mechanism converting the bright states into momentum-dark states which may also gives smaller transfer rate upon hIX pumping. These scattering effects yield a faster recovery of SC, in agreement with our experimental observation (see Supplementary Note S8).
Another effect leading to faster recovery in the hIX pumping scheme is the mitigation of the Pauli blockade. In contrast to XA−BL pumping, the pumped exciton only shares holes with the probed exciton but not the electrons54, see Fig. 4a, leading to a weaker saturation effect. This can also result in a faster recovery of SC if similar conditions as in XA−BL case are used (except the pump photon energy). Combining the effects of a smaller bright-to-dark exciton transfer rate and weaker Pauli blockade, the influence of the reservoir long-lived states is less significant exciting the hIX. Therefore, a faster recovery time of SC is easier to achieve in this case. Such fast recovery would allow to further increase the switching frequency, up to ≈1 THz. We underline that to achieve such hIX-induced Rabi quenching we use an excitation energy of 4.37 pJ, only moderately higher compared to the resonant excitation case. Higher pulse energies will increase the recovery time and the weak coupling time window.
SC switching in a double BL microcavity
Finally, we fabricated a device comprising two vertically stacked bilayer MoS2 separated by an hBN spacer of 40 nm. We placed this structure in a microcavity made of the same DBR and silver mirror used in the single BL cavity, with a PMMA spacer between the TMD stack and the top mirror (Fig. 5a). Similarly to microcavities with multiple quantum wells79, the SC is enhanced in this sample, as the Rabi splitting is increased to 55 meV due to the additional BL unit (see Supplementary Note S9 for the coupled oscillators model fit of the strongly coupled cavity dispersion). Figure 5b shows a comparison between the static 1-R spectra of a single BL (blue line) and a double BL (red line) cavity, taken at small angles. It clearly appears that the MPB-LPB peaks are more separated in the double BL cavity compared to the single BL sample, being also redshifted, as an effect of the more negative detuning of the former. The negative detuning also leads to a decrease of the LPB linewidth in the double BL cavity, being more cavity-like.
Fig. 5: Ultrafast switching of a double BL microcavity.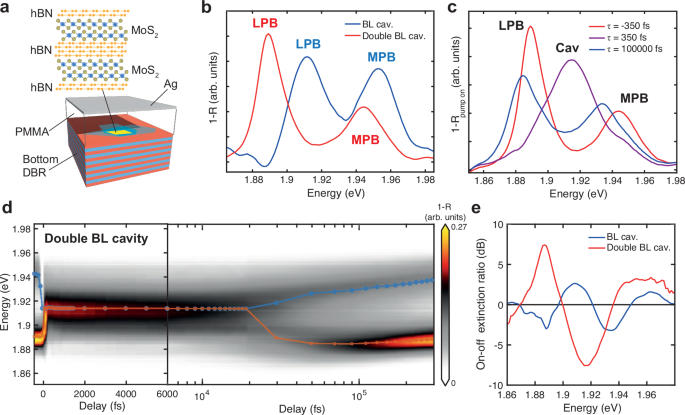
a Sketch of the microcavity embedding a double BL of MoS2. b Static 1-R spectra of the single BL compared to the double BL microcavity, showing a redshift of the MPB-LPB and an increased polariton splitting in the latter. c 1-R spectra of the double BL microcavity excited with pump pulses at 1.91 eV and 8.25 pJ, taken at different pump-probe delays. d Color map of the 1-R spectra of the double BL microcavity versus pump-probe delay showing the ultrafast collapse and later revival of the SC. The orange (blue) line in overlay displays the fitted peak energy of the LPB (MPB) or the weakly coupled cavity mode. e Effective on/off extinction ratio calculated from the 1-R spectra taken at −350 fs and 350 fs, for the single (blue line) and double BL cavity (red line).
By exciting the double BL cavity with pump pulses resonant with XA−BL, we observed again an ultrafast collapse of the MPB-LPB polariton peaks into a weakly coupled cavity mode, followed by their later recovery (Fig. 5c). We note that the pulse energy used for this experiment (8.25 pJ) was not adjusted to obtain a sub-ps SC recovery, but just to demonstrate the SC switching. Figure 5d shows the full dynamics of the SC collapse and recovery in the double BL cavity, where the energy separation between MPB and LPB (blue and red lines respectively) drops from ≈ 55 meV to zero immediately after the pump pulse. Considering the unperturbed SC condition as the on state of the optical switch and the weak coupling as the off state, we calculated the spectral power extinction ratio (ER) from the 1 − R spectra before and after the pump pulse, taken at − 350 fs and 350 fs respectively, where ER(dB)\(=10\log ((1-{R}_{on})/(1-{R}_{off}))\). The ER is increased significantly in the double BL cavity compared to the single BL device, over a broad energy range, as shown in Fig. 5e. For both the devices, the maximum ER in absolute value is reached around the energy of the weakly coupled cavity mode, between the LPB and MPB, which transmits (reflects) more during the off (on) state. While for the single BL the ER absolute value reaches 3.2 dB at 1.932 eV, it is enhanced up to 7.5 dB at 1.915 eV in the double BL. It is worth to mention that the ER is also high in the spectral regions of the LPB and MPB, where it shows opposite sign, meaning that the optical switch can be used in direct or reverse mode just by changing the operational wavelength. We also tested the SC switching in a single BL cavity with a slightly negative detuning, similar to that of the double BL cavity, as shown in Supplementary Note S12. The negative detuning in this sample leads to a maximum ER of ~ 7 dB (Fig. S13c), higher compared to that of the single BL cavity shown in Fig. 5. Such value is similar to the maximum observed in the double BL sample, pointing out the importance of the detuning for a high contrast. However, in a single BL device the ER is maximized only in a narrow spectral region around 1.93 eV. A double BL cavity instead ensures maximum contrast in a broader energy range owing to the increased Rabi splitting, and consequently the larger energy separation between LPB and the cavity mode.
We note that working at high frequencies, the effective extinction ratio for a second switching event decreases due to the residual exciton population after the first pulse excitation (e.g. by about four times in the double pump pulse experiment shown in Fig. 3). We foresee that this drawback can be mitigated by reducing the long exciton decay component, for example suppressing the exciton scattering to dark states and using a different optical resonator with higher Q factor and smaller mode volume, to induce a strong Purcell effect.