
Aug 27, 2025
IndexBox has just published a new report: U.S. – Gypsum And Anhydrite – Market Analysis, Forecast, Size, Trends And Insights.
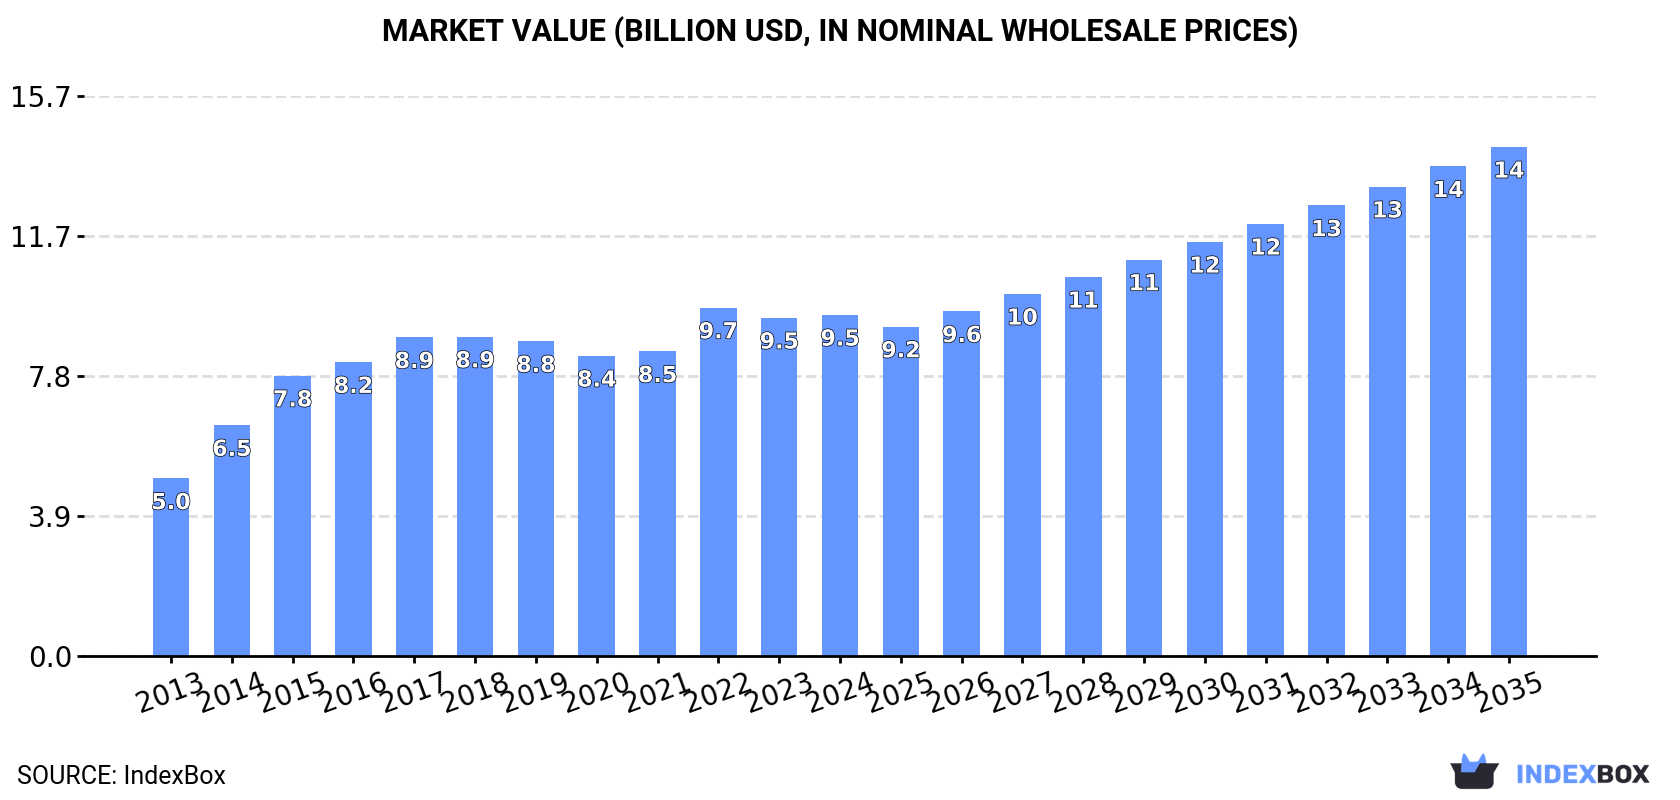
Driven by increasing demand, the gypsum and anhydrite market in the United States is expected to grow steadily over the next decade. With a forecasted CAGR of +2.2% in volume and +3.7% in value from 2024 to 2035, the market is predicted to reach 38M tons and $14.2B respectively by the end of 2035.
Market Forecast
Driven by increasing demand for gypsum and anhydrite in the United States, the market is expected to continue an upward consumption trend over the next decade. Market performance is forecast to decelerate, expanding with an anticipated CAGR of +2.2% for the period from 2024 to 2035, which is projected to bring the market volume to 38M tons by the end of 2035.
In value terms, the market is forecast to increase with an anticipated CAGR of +3.7% for the period from 2024 to 2035, which is projected to bring the market value to $14.2B (in nominal wholesale prices) by the end of 2035.
 ConsumptionUnited States’s Consumption of Gypsum And Anhydrite
After eleven years of growth, consumption of gypsum and anhydrite decreased by -1.6% to 30M tons in 2024. The total consumption volume increased at an average annual rate of +3.4% over the period from 2013 to 2024; however, the trend pattern indicated some noticeable fluctuations being recorded in certain years. Over the period under review, consumption hit record highs at 31M tons in 2023, and then contracted in the following year.
The revenue of the gypsum and anhydrite market in the United States totaled $9.5B in 2024, remaining stable against the previous year. This figure reflects the total revenues of producers and importers (excluding logistics costs, retail marketing costs, and retailers’ margins, which will be included in the final consumer price). Overall, the total consumption indicated a strong increase from 2013 to 2024: its value increased at an average annual rate of +6.1% over the last eleven-year period. The trend pattern, however, indicated some noticeable fluctuations being recorded throughout the analyzed period. Based on 2024 figures, consumption decreased by -2.1% against 2022 indices. Over the period under review, the market hit record highs at $9.7B in 2022; however, from 2023 to 2024, consumption failed to regain momentum.
ProductionUnited States’s Production of Gypsum And Anhydrite
In 2024, approx. 23M tons of gypsum and anhydrite were produced in the United States; approximately equating the previous year’s figure. The total output volume increased at an average annual rate of +2.4% over the period from 2013 to 2024; the trend pattern remained relatively stable, with only minor fluctuations being observed throughout the analyzed period. The most prominent rate of growth was recorded in 2016 when the production volume increased by 5.3% against the previous year. Over the period under review, production hit record highs at 23M tons in 2022; however, from 2023 to 2024, production remained at a lower figure.
In value terms, gypsum and anhydrite production expanded modestly to $7.5B in 2024. The total output value increased at an average annual rate of +5.7% over the period from 2013 to 2024; the trend pattern indicated some noticeable fluctuations being recorded throughout the analyzed period. The most prominent rate of growth was recorded in 2014 with an increase of 33%. Gypsum and anhydrite production peaked at $7.8B in 2022; however, from 2023 to 2024, production failed to regain momentum.
ImportsUnited States’s Imports of Gypsum And Anhydrite
In 2024, after three years of growth, there was significant decline in supplies from abroad of gypsum and anhydrite, when their volume decreased by -8.2% to 7.1M tons. Over the period under review, imports, however, saw resilient growth. The growth pace was the most rapid in 2014 when imports increased by 20% against the previous year. Imports peaked at 7.8M tons in 2023, and then contracted in the following year.
In value terms, gypsum and anhydrite imports contracted to $144M in 2024. Overall, imports, however, recorded a resilient increase. The pace of growth appeared the most rapid in 2019 with an increase of 36%. Imports peaked at $155M in 2023, and then dropped in the following year.
Imports By Country
Spain (3.1M tons), Canada (2.2M tons) and Mexico (2.1M tons) were the main suppliers of gypsum and anhydrite imports to the United States.
From 2013 to 2024, the biggest increases were recorded for Spain (with a CAGR of +13.9%), while purchases for the other leaders experienced more modest paces of growth.
In value terms, Spain ($62M), Canada ($44M) and Mexico ($43M) constituted the largest gypsum and anhydrite suppliers to the United States.
Spain, with a CAGR of +11.3%, saw the highest growth rate of the value of imports, among the main suppliers over the period under review, while purchases for the other leaders experienced more modest paces of growth.
Import Prices By Country
In 2024, the average gypsum and anhydrite import price amounted to $20 per ton, leveling off at the previous year. Over the period under review, the import price saw a relatively flat trend pattern. The most prominent rate of growth was recorded in 2019 an increase of 15% against the previous year. As a result, import price attained the peak level of $23 per ton. From 2020 to 2024, the average import prices remained at a lower figure.
Average prices varied somewhat amongst the major supplying countries. In 2024, amid the top importers, the highest price was recorded for prices from Mexico ($20 per ton) and Spain ($20 per ton), while the price for Turkey ($15 per ton) and Canada ($20 per ton) were amongst the lowest.
From 2013 to 2024, the most notable rate of growth in terms of prices was attained by Canada (+1.5%), while the prices for the other major suppliers experienced a decline.
ExportsUnited States’s Exports of Gypsum And Anhydrite
In 2024, the amount of gypsum and anhydrite exported from the United States rose notably to 50K tons, picking up by 8.1% compared with the previous year. In general, exports, however, continue to indicate a deep contraction. The pace of growth was the most pronounced in 2021 with an increase of 28% against the previous year. The exports peaked at 144K tons in 2013; however, from 2014 to 2024, the exports stood at a somewhat lower figure.
In value terms, gypsum and anhydrite exports skyrocketed to $22M in 2024. Over the period under review, exports, however, saw a mild decline. Over the period under review, the exports reached the peak figure at $30M in 2014; however, from 2015 to 2024, the exports stood at a somewhat lower figure.
Exports By Country
Canada (36K tons) was the main destination for gypsum and anhydrite exports from the United States, accounting for a 71% share of total exports. Moreover, gypsum and anhydrite exports to Canada exceeded the volume sent to the second major destination, Mexico (3.4K tons), tenfold. The third position in this ranking was taken by Turkey (2.8K tons), with a 5.6% share.
From 2013 to 2024, the average annual growth rate of volume to Canada amounted to -9.7%. Exports to the other major destinations recorded the following average annual rates of exports growth: Mexico (+3.5% per year) and Turkey (+14.3% per year).
In value terms, the largest markets for gypsum and anhydrite exported from the United States were Canada ($11M), Turkey ($5.9M) and Australia ($992K), together accounting for 81% of total exports.
Among the main countries of destination, Turkey, with a CAGR of +26.1%, saw the highest rates of growth with regard to the value of exports, over the period under review, while shipments for the other leaders experienced more modest paces of growth.
Export Prices By Country
In 2024, the average gypsum and anhydrite export price amounted to $436 per ton, with an increase of 13% against the previous year. Overall, export price indicated resilient growth from 2013 to 2024: its price increased at an average annual rate of +8.6% over the last eleven years. The trend pattern, however, indicated some noticeable fluctuations being recorded throughout the analyzed period. Based on 2024 figures, gypsum and anhydrite export price increased by +39.9% against 2021 indices. The most prominent rate of growth was recorded in 2014 when the average export price increased by 75%. The export price peaked at $452 per ton in 2017; however, from 2018 to 2024, the export prices stood at a somewhat lower figure.
Prices varied noticeably by country of destination: amid the top suppliers, the country with the highest price was Turkey ($2,099 per ton), while the average price for exports to Mexico ($192 per ton) was amongst the lowest.
From 2013 to 2024, the most notable rate of growth in terms of prices was recorded for supplies to Canada (+11.6%), while the prices for the other major destinations experienced more modest paces of growth.