
Design of single-photon source based on topological bulk state
Figure 1 provides a detailed illustration of the design and operation principle of the single-photon source utilizing a topological bulk cavity. As shown in Fig. 1a, a single QD is coupled to a topological bulk state and the single-photon emission from the QD-cavity system exhibits out-of-plane vertical directionality. The bulk cavity is constructed by a topologically non-trivial PC encircling a topologically trivial PC. The non-trivial or trivial PCs are achieved by moving the triangle nanoholes away from or towards centers of unite cells in the same honeycomb lattice, respectively. Three-dimensional full wave simulations are carried out to obtain band structures and optical modes of the topological cavity (see Material and methods). The simulated bulk band dispersions are presented in Fig. 1b, where the dipole (p)/quadrupole (d) mode component of the bands is indicated by the color scale. At frequency around the Γ point, the bulk modes in the trivial and non-trivial PC possess opposite parities, leading to the band-inversion induced reflection (grey arrows in Fig. 1b). As a result, light waves around the Γ point get reflected at the topological interface and can be laterally confined in the topological cavity41.
Fig. 1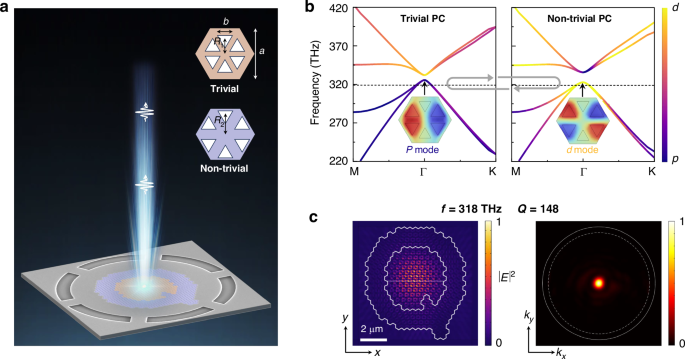
Design of the single-photon source based on a topological bulk cavity. a Schematic of the single-photon source, featuring a single quantum dot (QD) coupled to a ‘Q’-shaped topological bulk cavity. Inset: Unit cells of trivial and non-trivial PCs. b Band structures of the topological trivial (left panel) and non-trivial (right panel) PCs, where a = 420 nm, b = 123 nm, R1 = 0.97×a/3, and R2 = 1.048×a/3. The hybridization between p and d bands is indicated by the color scale. Inset: p and d modes with opposite parities at Γ points of the lower bands in these two PCs. c Simulated near-field (left panel) and angle-resolved far-field (right panel) distribution of dipole-like bulk state in the ‘Q’-shaped cavity. White lines in the left panel indicate the topological interface. Solid and dashed circles in the right panel indicate the light cone and NA ( = 0.9) of the collection objective, respectively. The eigen-frequency of the bulk state is displayed by dashed lines in Fig. 1b
The topological bulk states confined by band-inversion-induced reflection are robust against cavity deformations when adding or removing unit cells of the non-trivial or trivial PCs. Accordingly, we design an ‘Q’-shaped cavity with an irregular cavity contour to verify the robustness of the bulk states (Fig. 1a–c). The near-field and far-field distributions of a dipole-like bulk state in the ‘Q’-shaped topological cavity is shown in Fig. 1c. In the near field, the bulk state is well confined within the irregular topological boundaries with field intensities spreading over the trivial PC. In the far field, the in-plane momentum of the bulk state is pinned around the Γ point. Apart from this dipole-like bulk state, one edge state and one quadrupole-like bulk state also exist in the ‘Q’-shaped topological cavity (Supplementary Information Figure S1). Notably, the dipole-like bulk state exhibits a low quality-factor of 148 and far-field directionality with a divergence angle less than 8o (Supplementary Information Figure S2), which is advantageous for developing flexible and robust single-photon sources with broadband Purcell enhancement and vertical emission directionality.
Fabrication and characterization of an irregular bulk cavity
We fabricate the designed structures on a 170-nm-thick GaAs slab with a monolayer of self-assembled InAs QDs grown by molecular beam epitaxy. Suspended devices are obtained using electron beam lithography, inductively coupled plasma etching and finally wet etching, as detailed in Supplementary Information Fig. S3. We note that further surface passivation could be a viable approach to reduce the adverse influence induced by the etched surfaces and optimize QD optical performance37,44. Figure 2a and b shows the scanning electron microscopy (SEM) images of a fabricated device. The common lattice constant a for both the trivial and non-trivial PCs is 420 nm. For these two PCs, distances from the center of hexagonal unit cell to the center of each triangular nanohole (side length b ~ 123 nm) are R1 = 0.97×a/3 (trivial) and R2 = 1.048×a/3 (non-trivial), respectively.
Fig. 2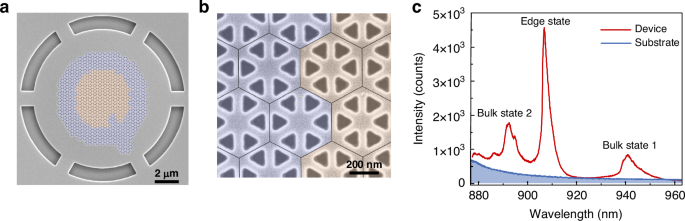
Fabricated device and characterization of the topological cavity modes. a SEM image of a fabricated ‘Q’-shaped topological bulk cavity patterned on a GaAs wafer. The cavity is composed of a trivial PC (orange) encircled by a topological PC (purple). b Enlarged SEM image of the device. Black hexagons indicate unit cells of the PCs. c PL spectra collected from the device or substrate under high pump power. Three peaks correspond to the three topological states in the cavity, as shown in Fig. 1c and Figure S3. Bulk state 1 and bulk state 2 correspond to the dipole-like bulk state and the quadrupole bulk state, respectively
Confocal PL measurement is performed to characterize the cavity-mode. The sample is placed inside a cryostat maintained at temperature of 4 K, and a 780-nm continuous-wave (CW) pump laser is used to excite the device (Supplementary Information Fig. S4). Under a high pump power of 43.6 μW, the PL spectrum reveals three distinct peaks as shown in Fig. 2c, corresponding to three eigenstates in the ‘Q’-shaped topological cavity. The dipole-like bulk state near the band edge of the lower bulk bands (Figs. 1b and S3a) corresponds to the peak at wavelengths of 940.85 nm. While PL spectrum of the substrate exhibits no discernible peaks within the focused wavelength region. The measured quality-factor of the dipole-like bulk state is approximately 120, which matches well with the simulated result presented in Fig. 1c.
Single-photon emission from the bulk cavity
To illustrate the behavior of single-photon emitting based on topological bulk cavity, we pump the device at low excitation powers and investigate the radiation properties of a single QD in the cavity. The fluorescence image in Fig. 3a confirms that the QD is situated inside the bulk cavity, with a deviation of 0.8 μm from the cavity center. PL spectra of the device at different pump powers are shown in Fig. 3b. At a low pump power of 0.9 µW, several transition lines of the QD can be identified in the spectrum, including exciton (X) and biexciton (XX) emissions (Supplementary Information Fig. S6). When the pump power is increased to 15.5 µW and sufficient to excite bulk state, we observe that XX emission of the QD is resonant with this cavity mode, exhibiting maximum intensity compared to other transitions peaks.
Fig. 3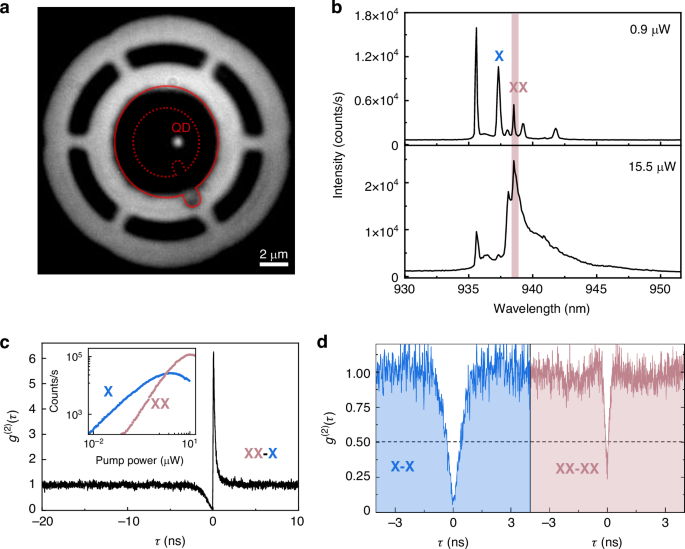
Single-photon emission from the topological bulk cavity. a Image of the device with a single QD located inside a ‘Q’-shaped topological bulk cavity. The device is illuminated by a halogen lamp and simultaneously the QD is excited by a 780 nm CW laser. The red dashed line indicates the topological interface, and the red solid line indicates the outer contour of the cavity. b PL spectra measured under different pump power. c Cross-correlation measurement of photons emitted from the XX–X cascade. Inset: Logarithmic plot of X and XX count rates as a function of excitation power. d Auto-correlation measurement for X or XX photons
Figure 3c shows the result of XX-X cross-correlation measurement, which initiates with XX photons and terminates with X photons. The asymmetric bunching effect observed at positive delay times confirms the XX-X cascaded emission of photon pairs within the same decay channel. Additionally, the dependence of measured photon count rates on excitation power is depicted in Fig. 3c. As the pump power increases, the PL intensity of the cavity-enhanced XX emission gradually surpasses that of the X emission. The slopes of X and XX emissions in the log-log scale are 0.98 and 1.5, respectively. We note that the XX exponent being less than 2 may be attributed to the presence of non-radiative recombination processes45. As shown in Fig. 3d, the single photon nature of X or XX emissions from the topological bulk cavity is demonstrated through second-order auto-correlation measurements, revealing low multi-photon probabilities of g(2)(0)X = 0.05 and g(2)(0)XX = 0.24 (raw data).
Purcell effect of single QD in the bulk cavity
As discussed in Fig. 1c, the dipole-like bulk state in the topological cavity has a low Q factor of ~102, which facilitates broadband Purcell enhancement. Additionally, the bulk state is confined by band-inversion-induced reflection and the in-plane mode extension is restricted by the topological interface. Consequently, the area of real-space field distribution is only determined by periods of the intracavity PC, facilitating deterministic QD-cavity coupling without complex QD-positioning techniques (Supplementary Information Fig. S7). As a result, QD-cavity coupling in the topological bulk cavity is tolerant to both emission wavelength and relative position of the QD.
The simulated Purcell factor for this device at different emission wavelengths of a single emitter is shown in Fig. 4a (see Material and methods). The result reveals spontaneous emission enhancement (Fp > 1) around the bulk state at 941 nm, as well as spontaneous emission inhibition (Fp < 1) within the photonic band gap at shorter wavelengths. When the emitter is resonant with the bulk state, the maximum Fp is calculated to be 3.7. Owing to the low Q-factor, such a wavelength-dependent Fp has a full-width at half-maximum of approximately 7 nm, which matches well with the measured PL spectrum of the cavity mode. Figure 4b presents simulated Fp of the bulk state with varied single-emitter positions, where different position corresponds to different field intensity of the cavity mode. The simulation results reveal that the QD-cavity coupled system can sustain Purcell factors >1.6 over an area of 2.5 μm². As discussed in Supplementary Information Figs. S7 and S8, the topological bulk mode exhibits a position-dependent local distribution with an extended field envelope, enabling a statistically significant probability of observing pronounced Purcell enhancement. As a result, the insensitivity of QD positioning in the bulk cavity can be further improved by simply increasing the number of periods of intracavity lattice (trivial PC used in this work). We note that while the mode volume (Vm) increases with larger PC period number, the Q-factor also rises due to the enhanced in-plane confinement. Consequently, the ratio of Q/Vm, which governs the Purcell enhancement, increases with larger PC period (Supplementary Information Fig. S7).
Fig. 4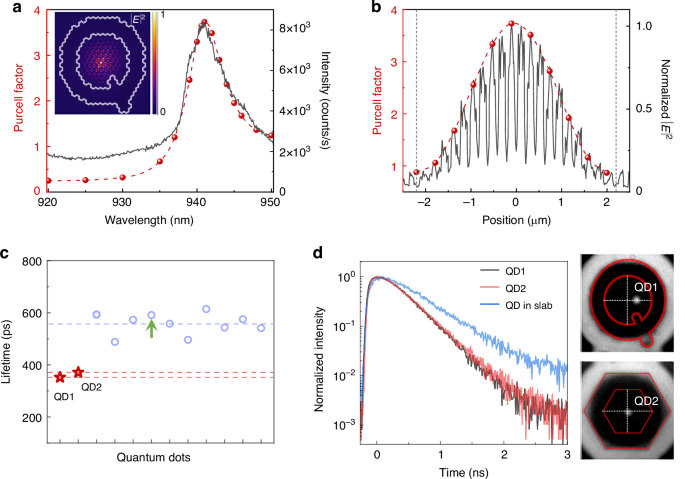
Frequency- and position-dependent Purcell effect in topological bulk cavity. a Simulated Purcell factor of bulk state versus emission wavelength (red dots). The PL spectrum of bulk state from Fig. 2c is also shown for comparison (black curve). Inset: Simulated radiation field (|E | 2) from a single emitter coupled to bulk state. b Simulated Purcell factor of bulk state versus source position (red dots) and the corresponding electric field intensity distribution (black curve) along the white dashed line in Fig. 1c. c The measured radiative lifetimes of XX photons from QD1 and QD2 coupled to topological bulk cavities (red) compared to the lifetimes of XX photons from QDs in slab (blue). d Left panel: Time-resolved XX photon counts of QD1, QD2 and a QD in slab (indicated by green arrow in Fig. 4c). Right panel: Position of QD1 and QD2 in relative to the topological bulk cavity
Using a 780 nm pulsed laser (5 ps pulse width, 80 MHz repetition rate) for above-band excitation, we conducted time-resolved fluorescence measurements, as shown in Fig. 4c and d. The results indicate that the XX emission radiative lifetimes of two single QDs coupled to two distinct topological bulk cavities are 352 ps (QD1) and 371 ps (QD2). These lifetimes are approximately 1.6 and 1.5 times shorter, respectively, than the average XX lifetime of ~10 QDs from the same area in the slab. Simulated near-field and far-field properties of bulk state in these two cavities are shown in Fig. S4. Although QD1 and QD2 are coupled to topological bulk cavities with different geometries respectively and their relative positions to the cavity modes also differ from each other (Fig. 4d), the radiation properties of these two QD are similarly modulated by the topological cavities.
Extraction efficiency of an optimized bulk cavity
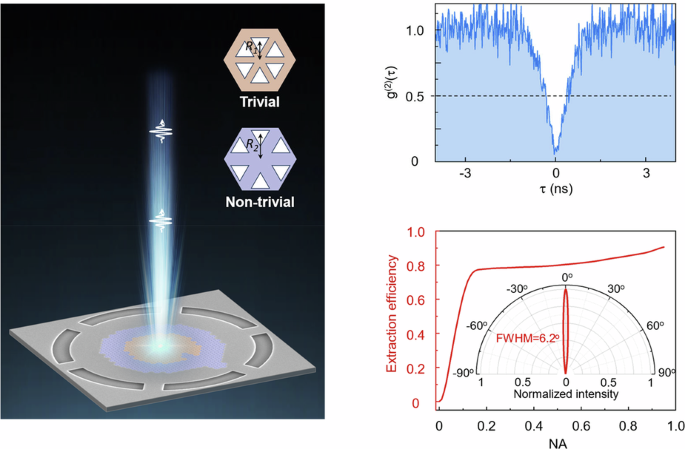
Band-inversion-induced reflection in the topological cavity only occurs around the Γ point. Thus, the bulk state exhibits out-of-plane directionality with small divergence angle, which can significantly improve the single-photon extraction efficiency. The simulated extraction efficiency of an optimized topological bulk cavity integrated with a reflector is shown in Fig. 5. R1 and R2 of the optimized topological structure are set to be 0.92×a/3 and 1.05×a/3 respectively, where the lattice constant a is 420 nm (Supplementary Information Fig. S9). As shown in Fig. 5a, the GaAs cavity is sitting on a highly efficient reflector consisting of 300-nm SiO2 and 200-nm gold (Au) to effectively suppress the downwards photon leakage. For a single QD coupled to the topological bulk cavity, the simulated out-of-plane directionality and extraction efficiency at the first lens are plotted in Fig. 5b. The results indicate that a nearly Gaussian far-field distribution (Supplementary Information Fig. S9) and the divergence angle of the radiation field is only 6.2°. The simulated extraction efficiency is as high as 92% and can reach 77% at a small NA of 0.15. Figure 5c shows the tolerance of the extraction efficiency to excitation wavelength, where the extraction efficiency retains above 80% over a wavelength range of 8 nm.
Fig. 5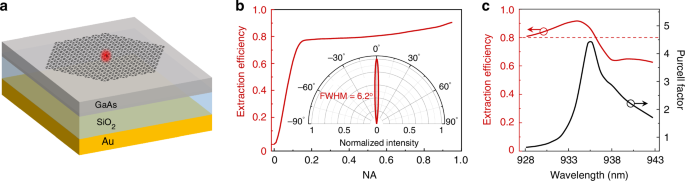
Extraction efficiency of the optimized single-photon source with a reflector. a Schematic of the optimized single photon source with a GaAs/SiO2/Au structure. b Simulated extraction efficiency of the optimized single-photon source as a function of NA. Inset: Angle-resolved far-field |E | 2 distribution of the optimized structure. c Simulated extraction efficiency and Purcell factor of the optimized structure versus emission wavelength. In the simulations, the extraction efficiency is defined as the ratio of the radiated power collected within the NA to the total radiated power in the full solid angle, from a single emitter embedded in the topological cavity