The internet holds over 1.2 billion websites in 2025, but fewer than 200 million are active.
Digital use grows, and so does the push for online presence plus engagement, where website traffic plays a crucial part.
With this data-backed article, we will take you through website traffic statistics, from global internet usage patterns to top-performing websites, device preferences, and much more.
Website Traffic Statistics: Key Takeaways
Google.com gets the highest traffic on the internet with 105 billion average monthly visits.
Approximately 5.65 billion individuals worldwide utilize the internet.
Mobile devices drive 63.05% of all web traffic.
China & India together contribute 1,968,583,000 internet users.
Facebook provides 71.58% of social referral traffic.
Organic search generated 53% of total website traffic.
Which Website Has The Highest Web Traffic?
Google.com draws the highest website traffic with 105 billion average monthly visits and 5.87 billion average unique visitors.
Standing second is Google’s subsidiary, YouTube.com, with 47 billion average monthly visits.
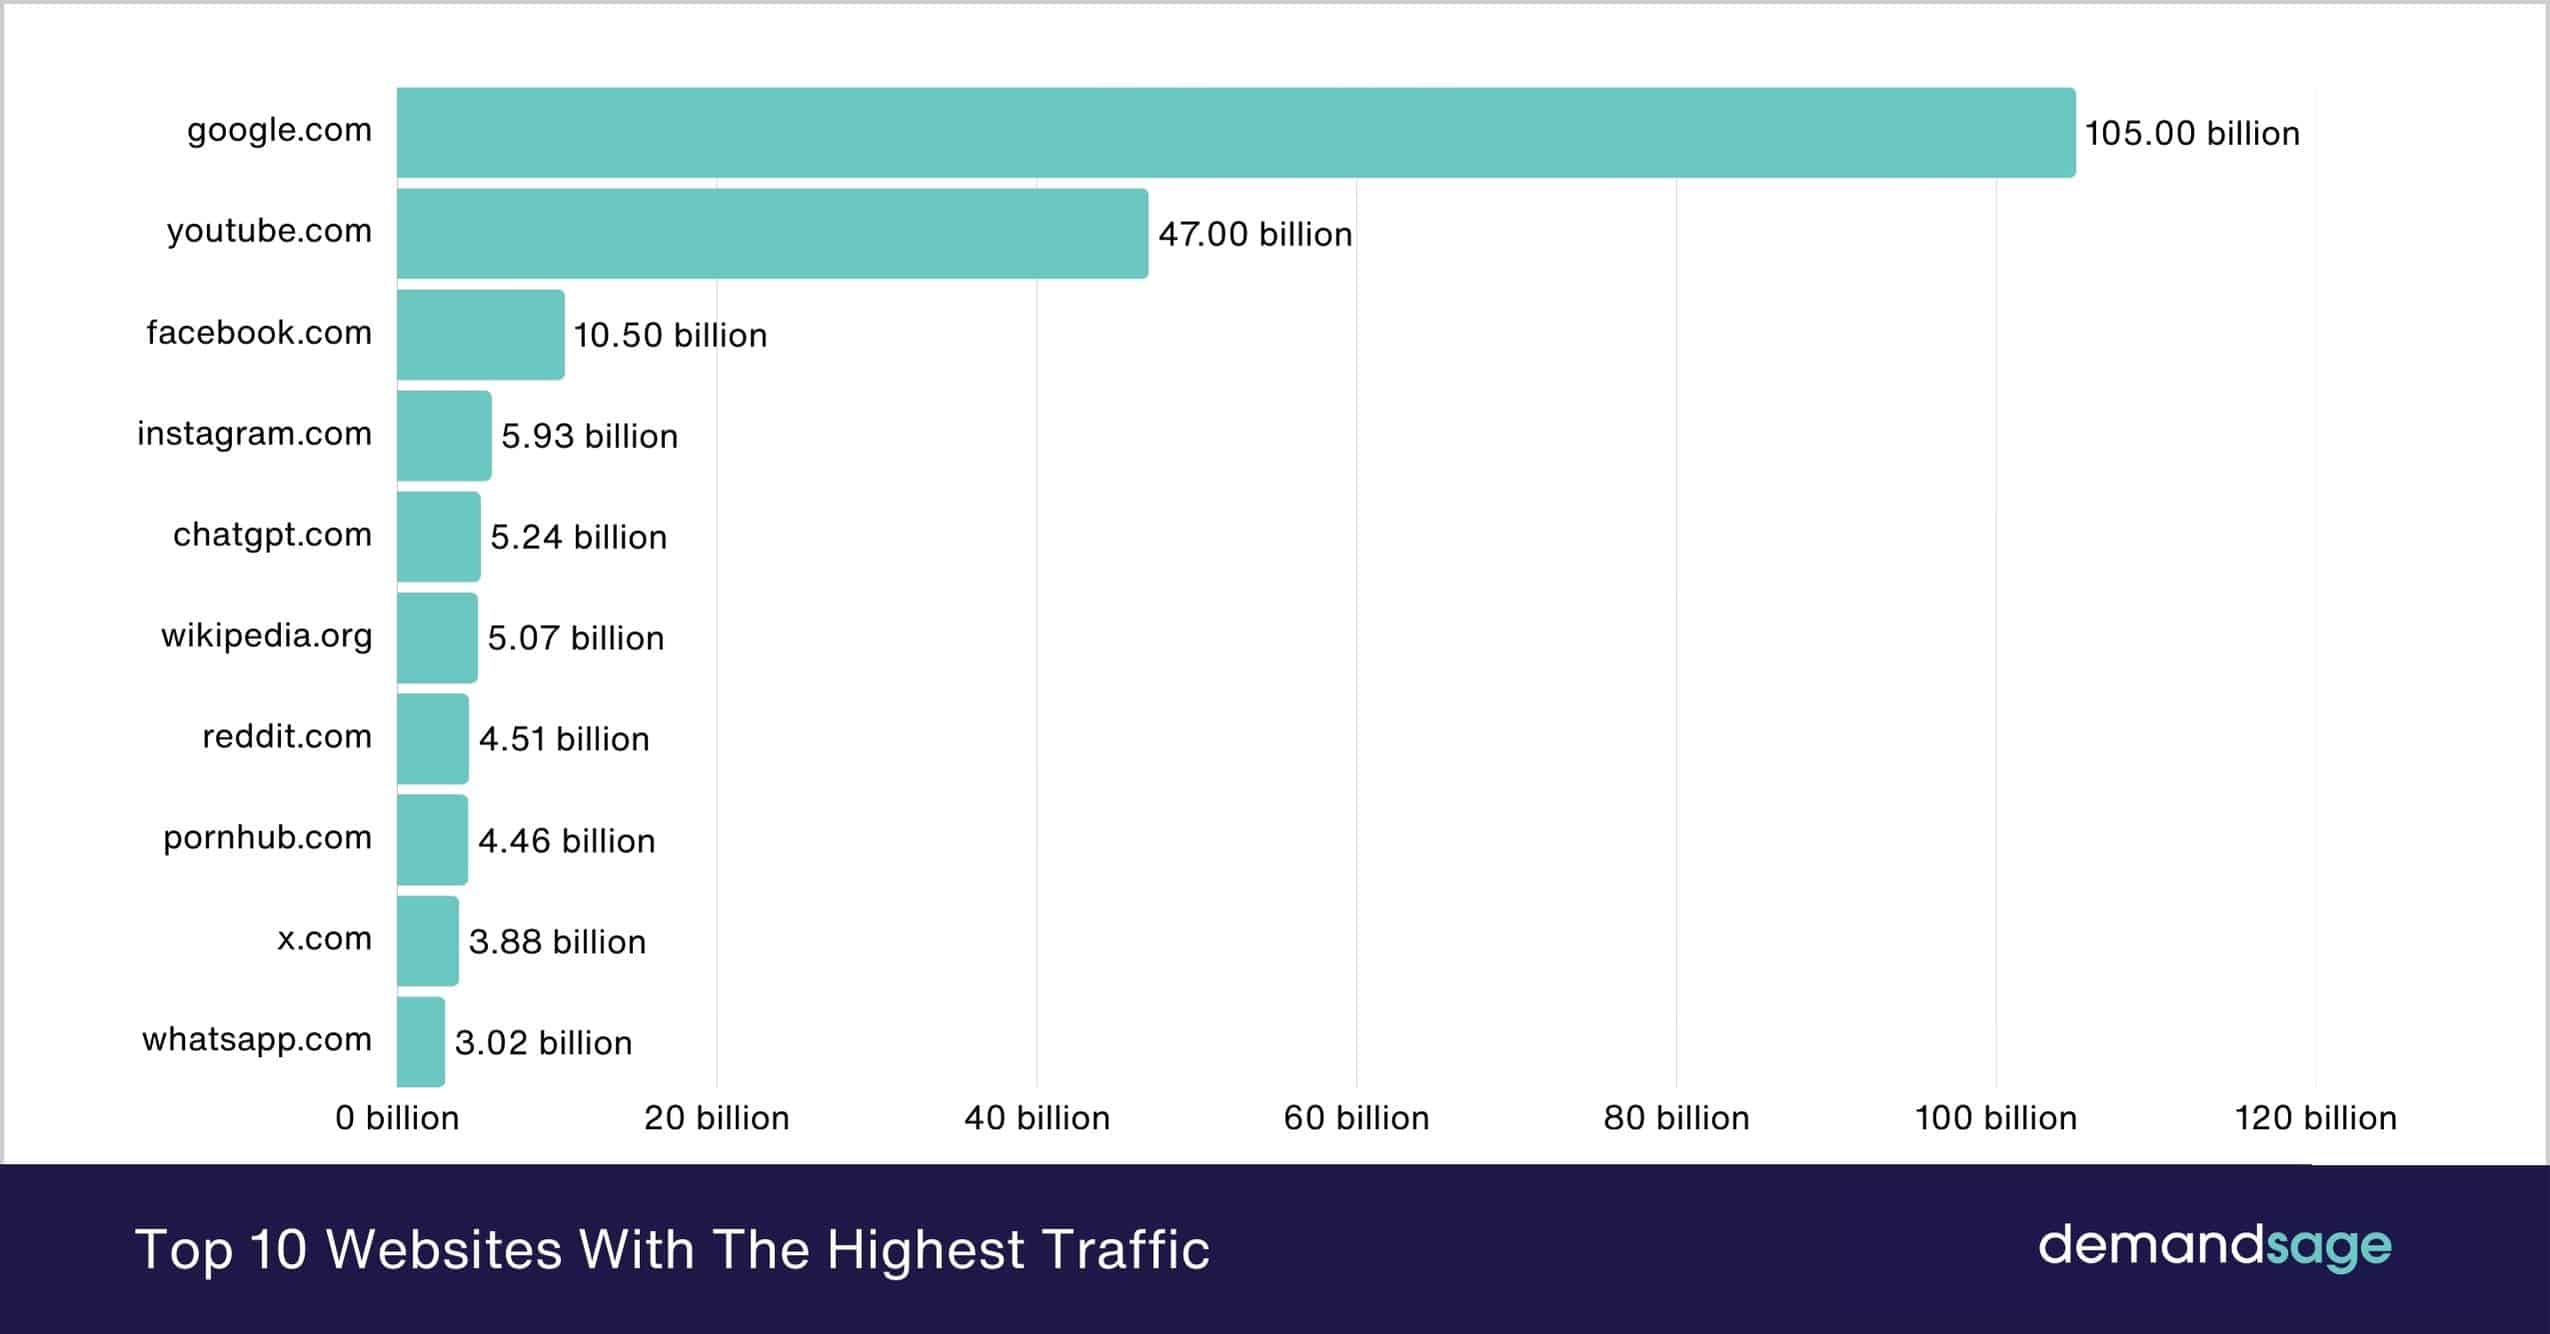
Here are the top 10 websites with their average monthly traffic in 2025.
RankWebsiteTotal Visits (Monthly Ave.)1google.com105 billion2youtube.com47.0 billion3facebook.com10.5 billion4instagram.com5.93 billion5chatgpt.com5.24 billion6wikipedia.org5.07 billion7reddit.com4.51 billion8pornhub.com4.46 billion9x.com3.88 billion10whatsapp.com3.02 billion
Source: Datareportal
Website Traffic Demographics
As of 2025, 5.65 billion people, from a total of 8.23 billion across the globe, connect to the internet. This represents 68.7% of the global population.
The number of internet users increased by 1.8% in 2025, from 5.45 billion in 2024.
Source: Datareportal, Datareportal 2
Website Traffic By Gender
The exact number of men and women who visit the website is challenging to research. However, we can look at the general trend of internet use to get an idea.
Among the global female population, 66.5% use the internet. For men, the figure stands at 70.8%.
Annual growth is stronger among women (3.7% vs. 2.7%), which is gradually closing the gap.
There is only a 4.3 percentage point difference between female and male internet users, indicating that internet access is becoming increasingly universal with each passing day.
The way people use the internet changes dramatically with age and gender.
Young females in the age group of 16–24 spend the most time online, around 43 hours per week, and often use the following:
16–24 Aged Females Internet Usage ActivitiesTime Spent In %Social media platforms60.8%Video streaming sites58.5%Music apps54.4%e-learning platformsN/ALifestyle or fashion websitesN/A
Young males aged 16 to 24 average 40 hours weekly, with gaming taking a 41% share of their online time, followed by video streaming, social media, e-learning sites, and sports or entertainment platforms.
Here is the breakdown of the top reasons, males & females from different age groups use the internet for:
GroupAvg. Hours Online (Weekly)Top ActivitiesOther Niche ActivitiesMales 16–2440 hrsGaming (41.0%)Video streaming, Social media, E-learning, Sports/EntertainmentAdults 25–3436–38 hrsInformational content (58.0%), News (49.5%)Career/Professional platforms, Streaming, E-commerceAdults 35–5430–32 hrsNews & Finance (56.8%), Tutorials (50.8%)Travel booking/reviews, E-commerce, Health/WellnessAdults 55–6426 hrsNews (59.6%)Family social platforms, Travel/Retirement planning, E-commerce, HealthSeniors 65+18 hrsNews (66.3%)Health portals, Finance, Learning resources, Travel/Lifestyle
*These figures may overlap as individuals may engage in multiple activities simultaneously.
Source: Datareportal
Website Traffic By Age
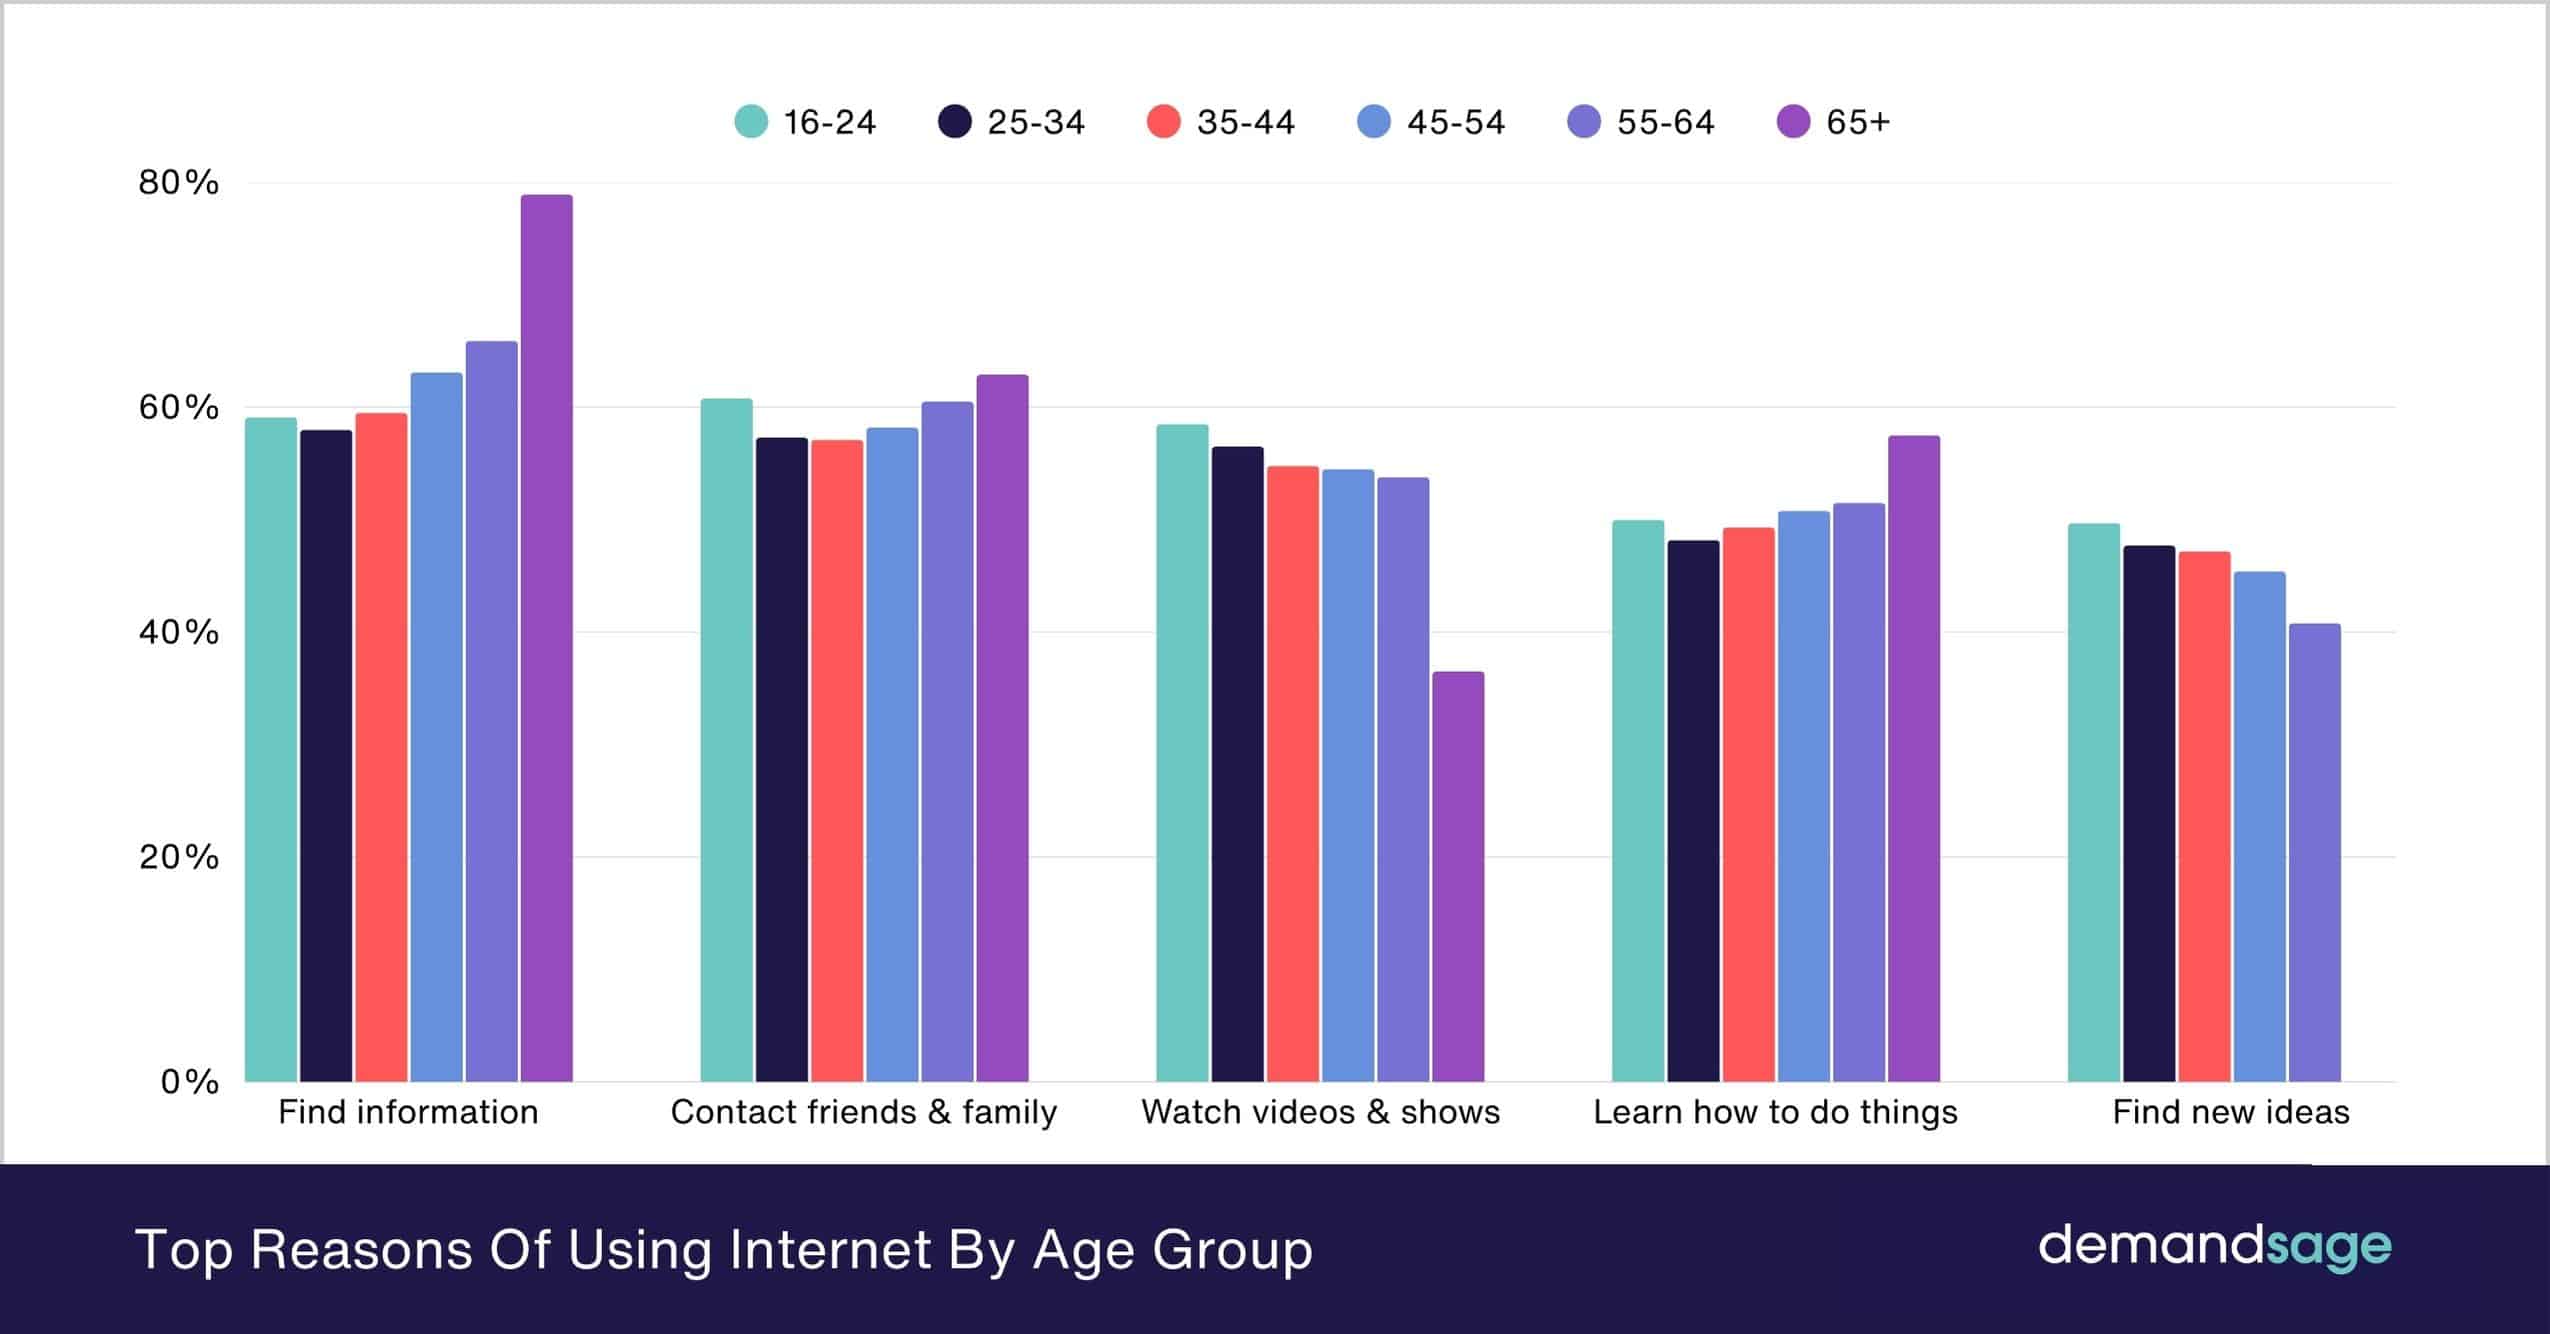
Finding information is the top universal driver, peaking at 78.9% in the 65+ group, clearly highlighting the informational websites drawing significant traffic.
More than 57% people across all age groups contact friends and family often. This explains the high use of social media and messaging sites, such as Instagram & Facebook.
Watching videos decreases from 58.5% for young people to 36.5% for older people. This shows less interest in video streaming services such as YouTube, Netflix, and Prime Video among older users.
Learning how to do things is steady across ages, slightly higher among older users (57.5% for 65+).
Finding new ideas is common across younger and middle-aged groups, but drops below 41% in the 55+.
Sr. No.Reason16-2425-3435-4445-5455-6465+1Find information59.1%58.0%59.5%63.1%65.9%78.9%2Contact friends & family60.8%57.3%57.1%58.2%60.5%62.9%3Watch videos & shows58.5%56.5%54.8%54.5%53.8%36.5%4Learn how to do things50.0%48.2%49.3%50.8%51.5%57.5%5Find new ideas49.7%47.7%47.2%45.4%40.8%–
Source: Datareportal
While the data on traffic by age isn’t directly available, the above internet usage reasons reveal which types of sites attract different age groups.
Website Traffic By Country
Country data about internet use shows how many people connect and how their numbers change across the globe.
This offers insight into the size and development of a nation’s online audience, which then suggests how much website traffic it could draw.
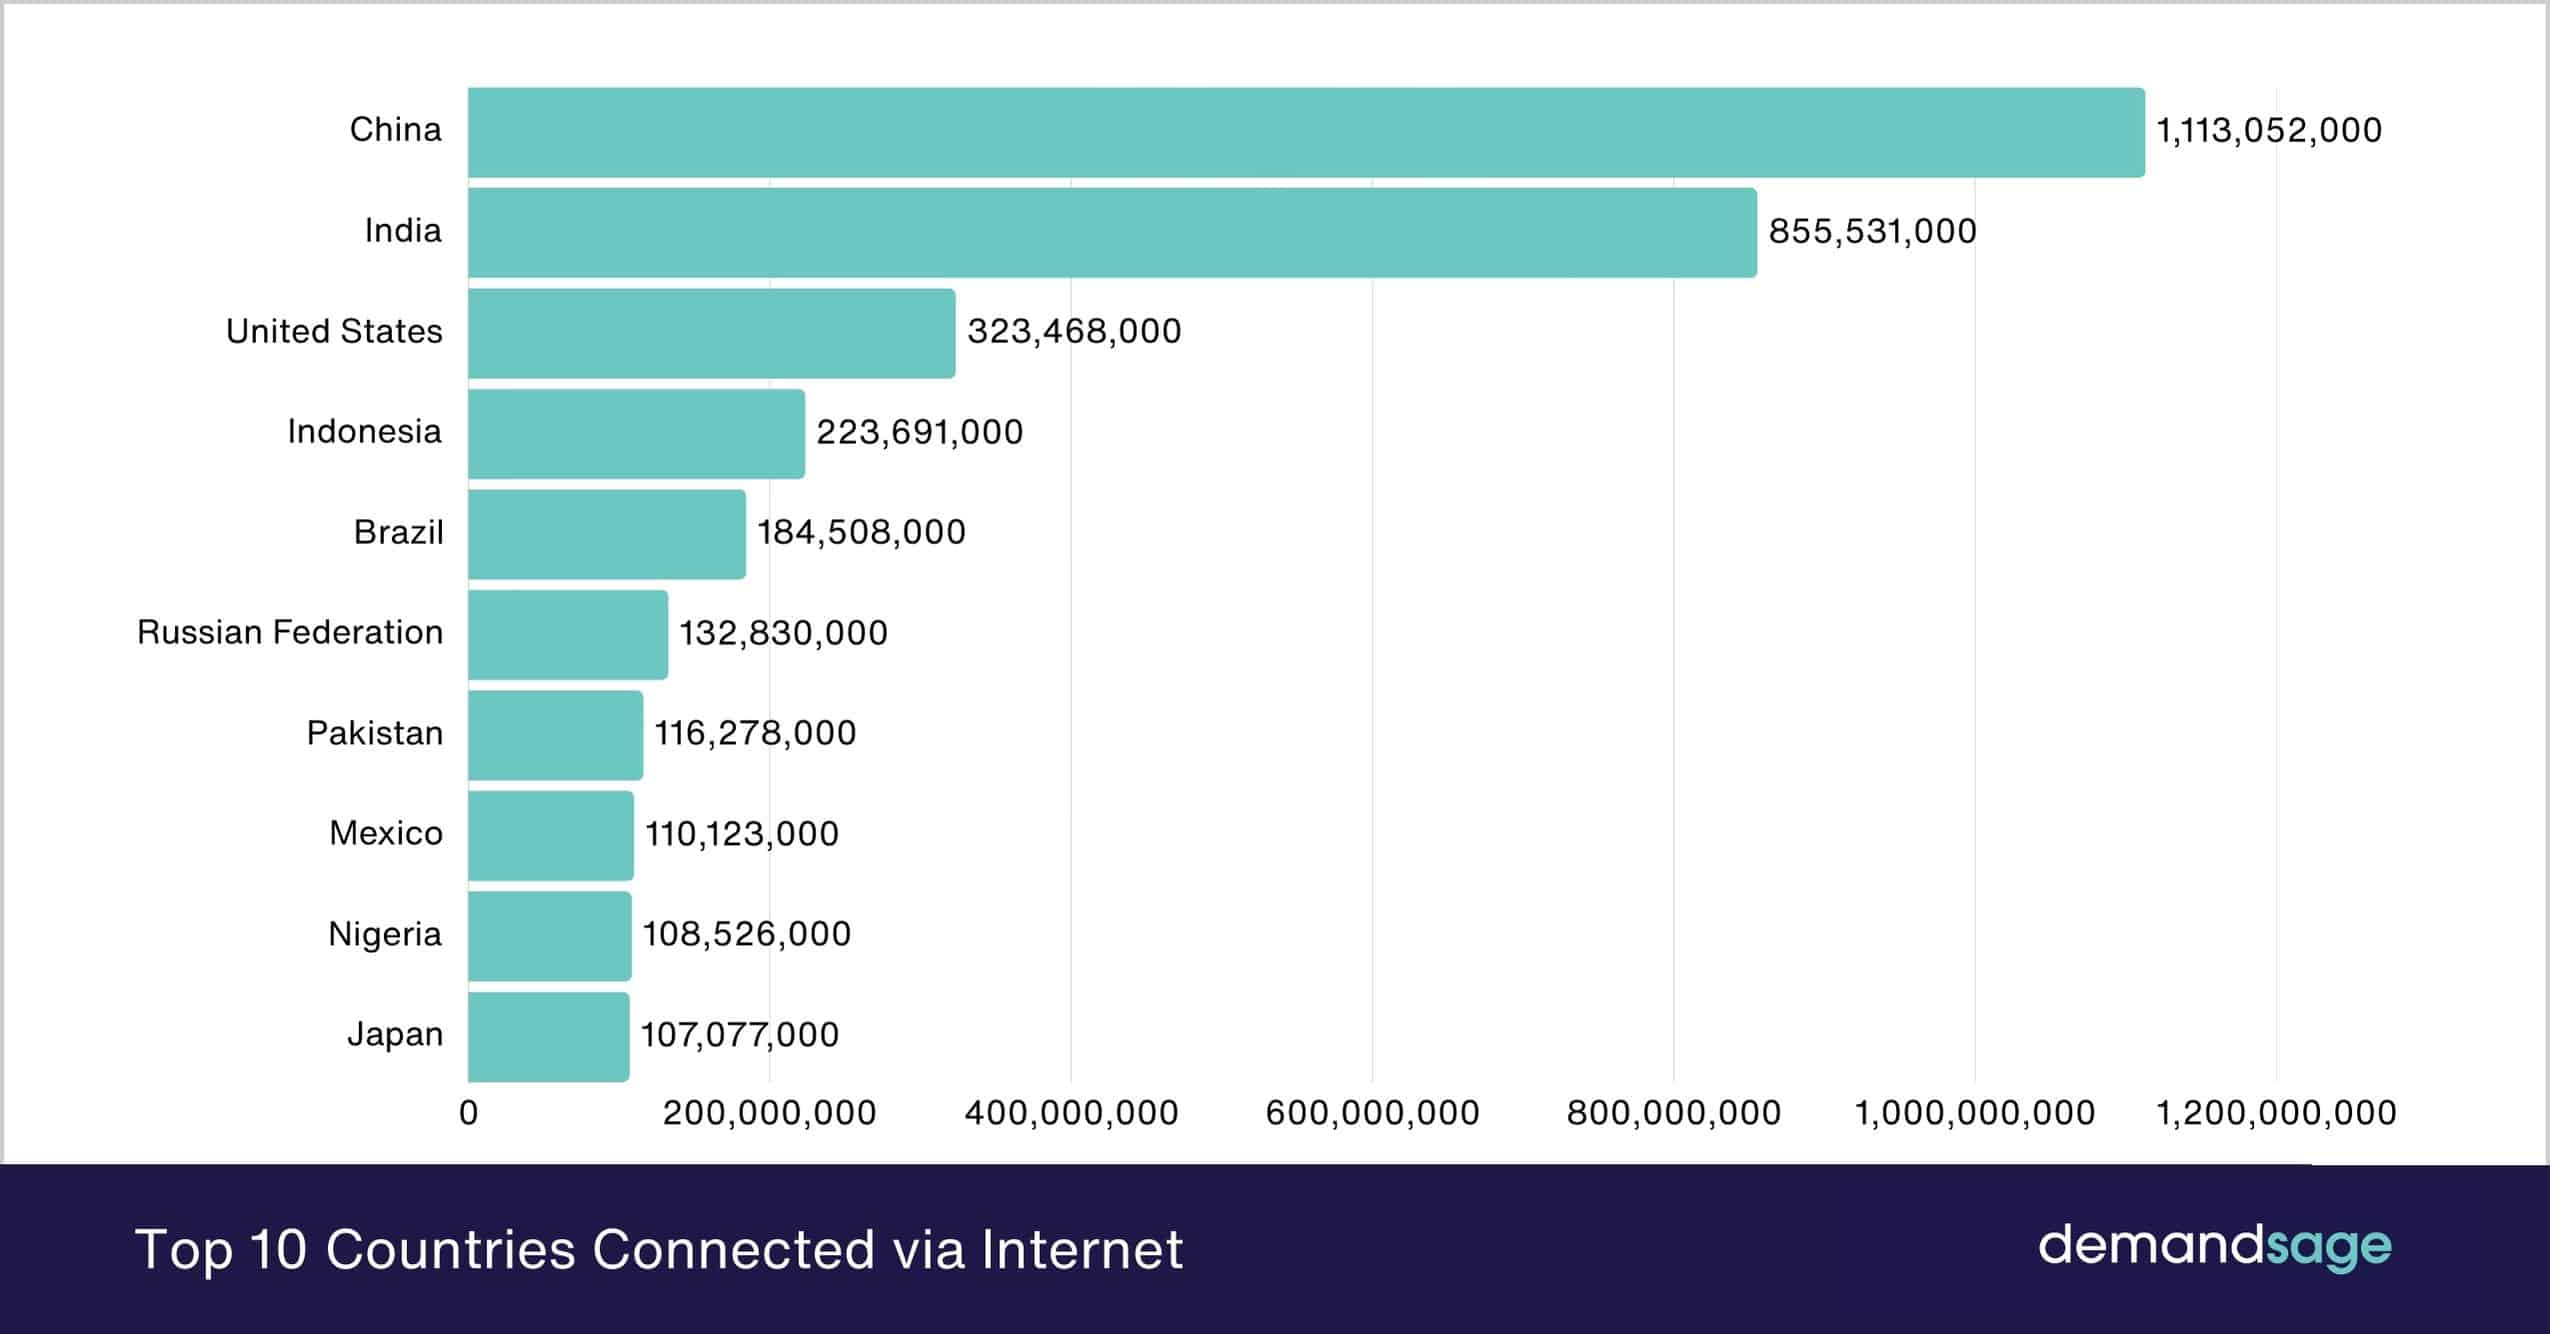
China and India have 1,968,583,000 internet users, which makes up nearly two billion users. Because of this, they are the most important markets for website traffic.
The United States leads in internet use, as 93.1% of its people go online. This country has fewer total users than Asian markets.
Indonesia grows fastest, with a yearly increase of 9.9%, which shows quick digital adoption.
Pakistan, besides Nigeria, has the lowest rates of internet use, about 45% to 46%, which means considerable room for growth.
Japan and Russia report drops in internet use, down 0.5% and 0.6% respectively. This points to market saturation or a change in how they count users.
RankCountryUsers Connected Via Internet% of PopulationYoY Change1China1,113,052,00078.6%0.0122India855,531,00058.4%0.0663United States323,468,00093.1%0.0054Indonesia223,691,00078.3%0.0995Brazil184,508,00086.7%0.0056Russian Federation132,830,00092.2%-0.6%7Pakistan116,278,00045.6%0.018Mexico110,123,00083.5%0.0199Nigeria108,526,00045.7%0.02410Japan107,077,00087.0%-0.5%
Source: Datareportal
Web Traffic Analysis By Industry
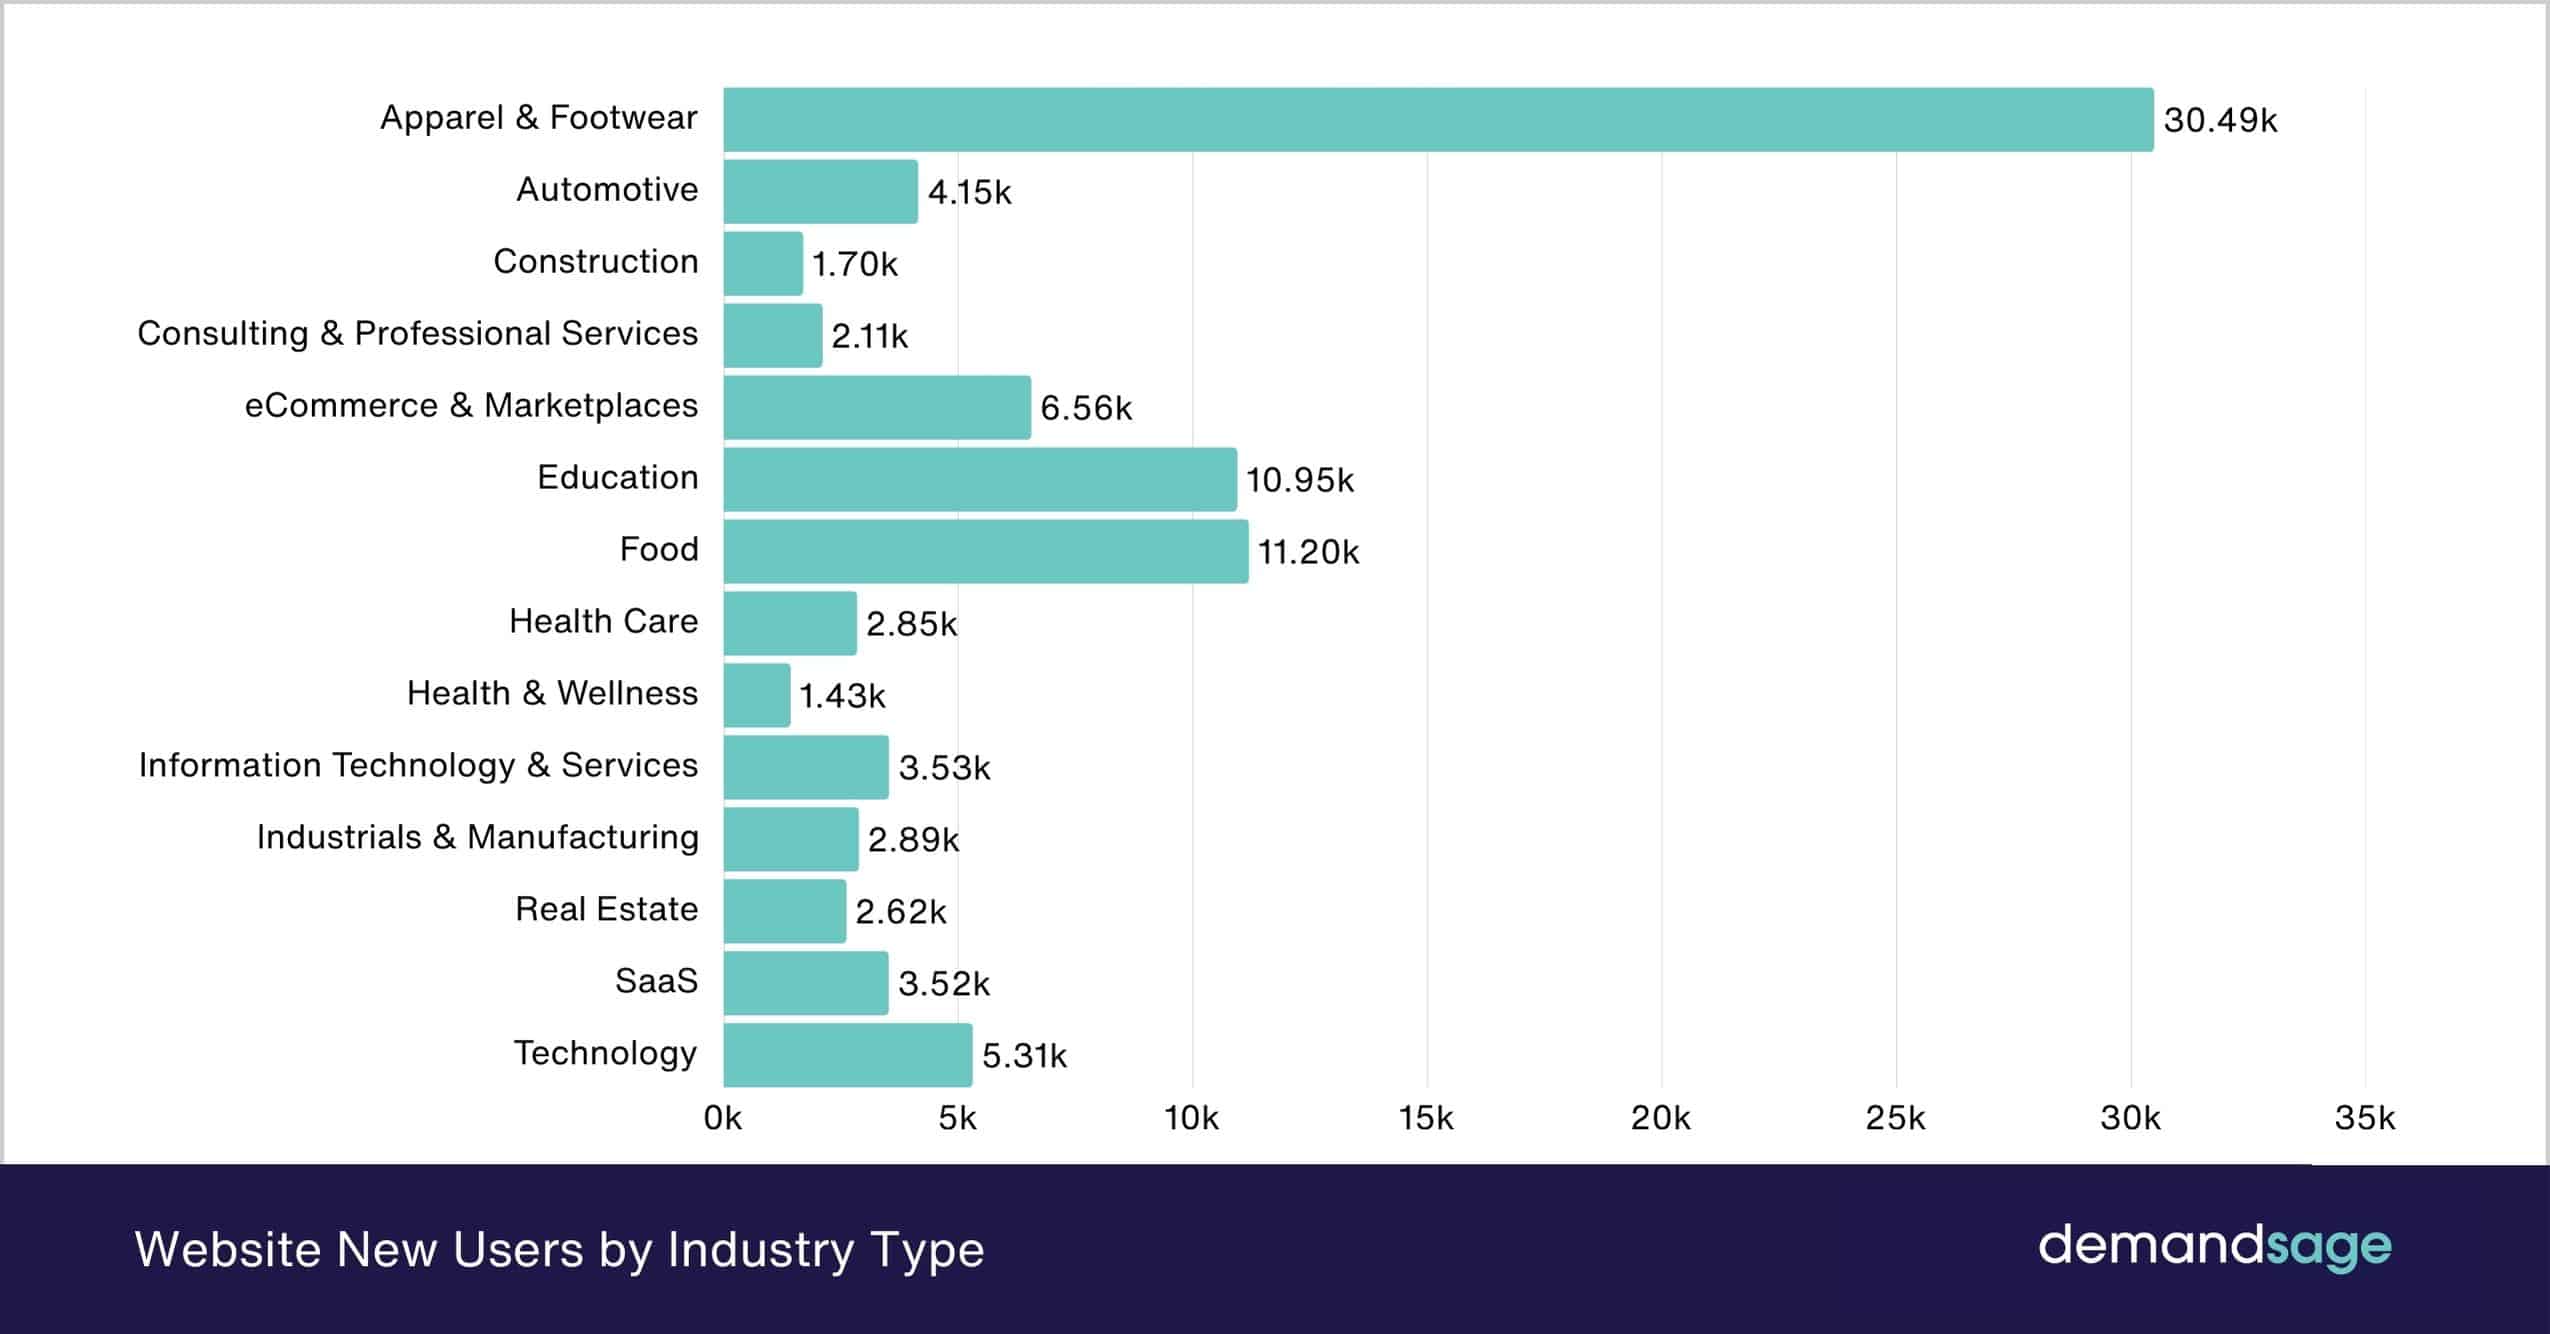
According to the latest available data, the apparel and footwear industry gained 30.49k new users in 2023, which was also the highest new user gain among several other sectors.
This lead highlights the audience’s interest and gives an overview of shopping websites that receive the most traffic.
The food industry gained the second most new users (11.2k), which was 2.7 times less than the apparel and footwear industry.
This growth likely came from increased traffic to food delivery platforms, online grocery stores, and recipe or meal-kit websites.
The Health & Wellness sector gained 1.43k new users, which was the lowest among other sectors.
Sr. No.IndustryNew Users1Apparel & Footwear30.49k2Automotive4.15k3Construction1.7k4Consulting & Professional Services2.11k5eCommerce & Marketplaces6.56k6Education10.95k7Food11.2k8Health Care2.85k9Health & Wellness1.43k10Information Technology & Services3.53k11Industrials & Manufacturing2.89k12Real Estate2.62k13SaaS3.52k14Technology5.31k
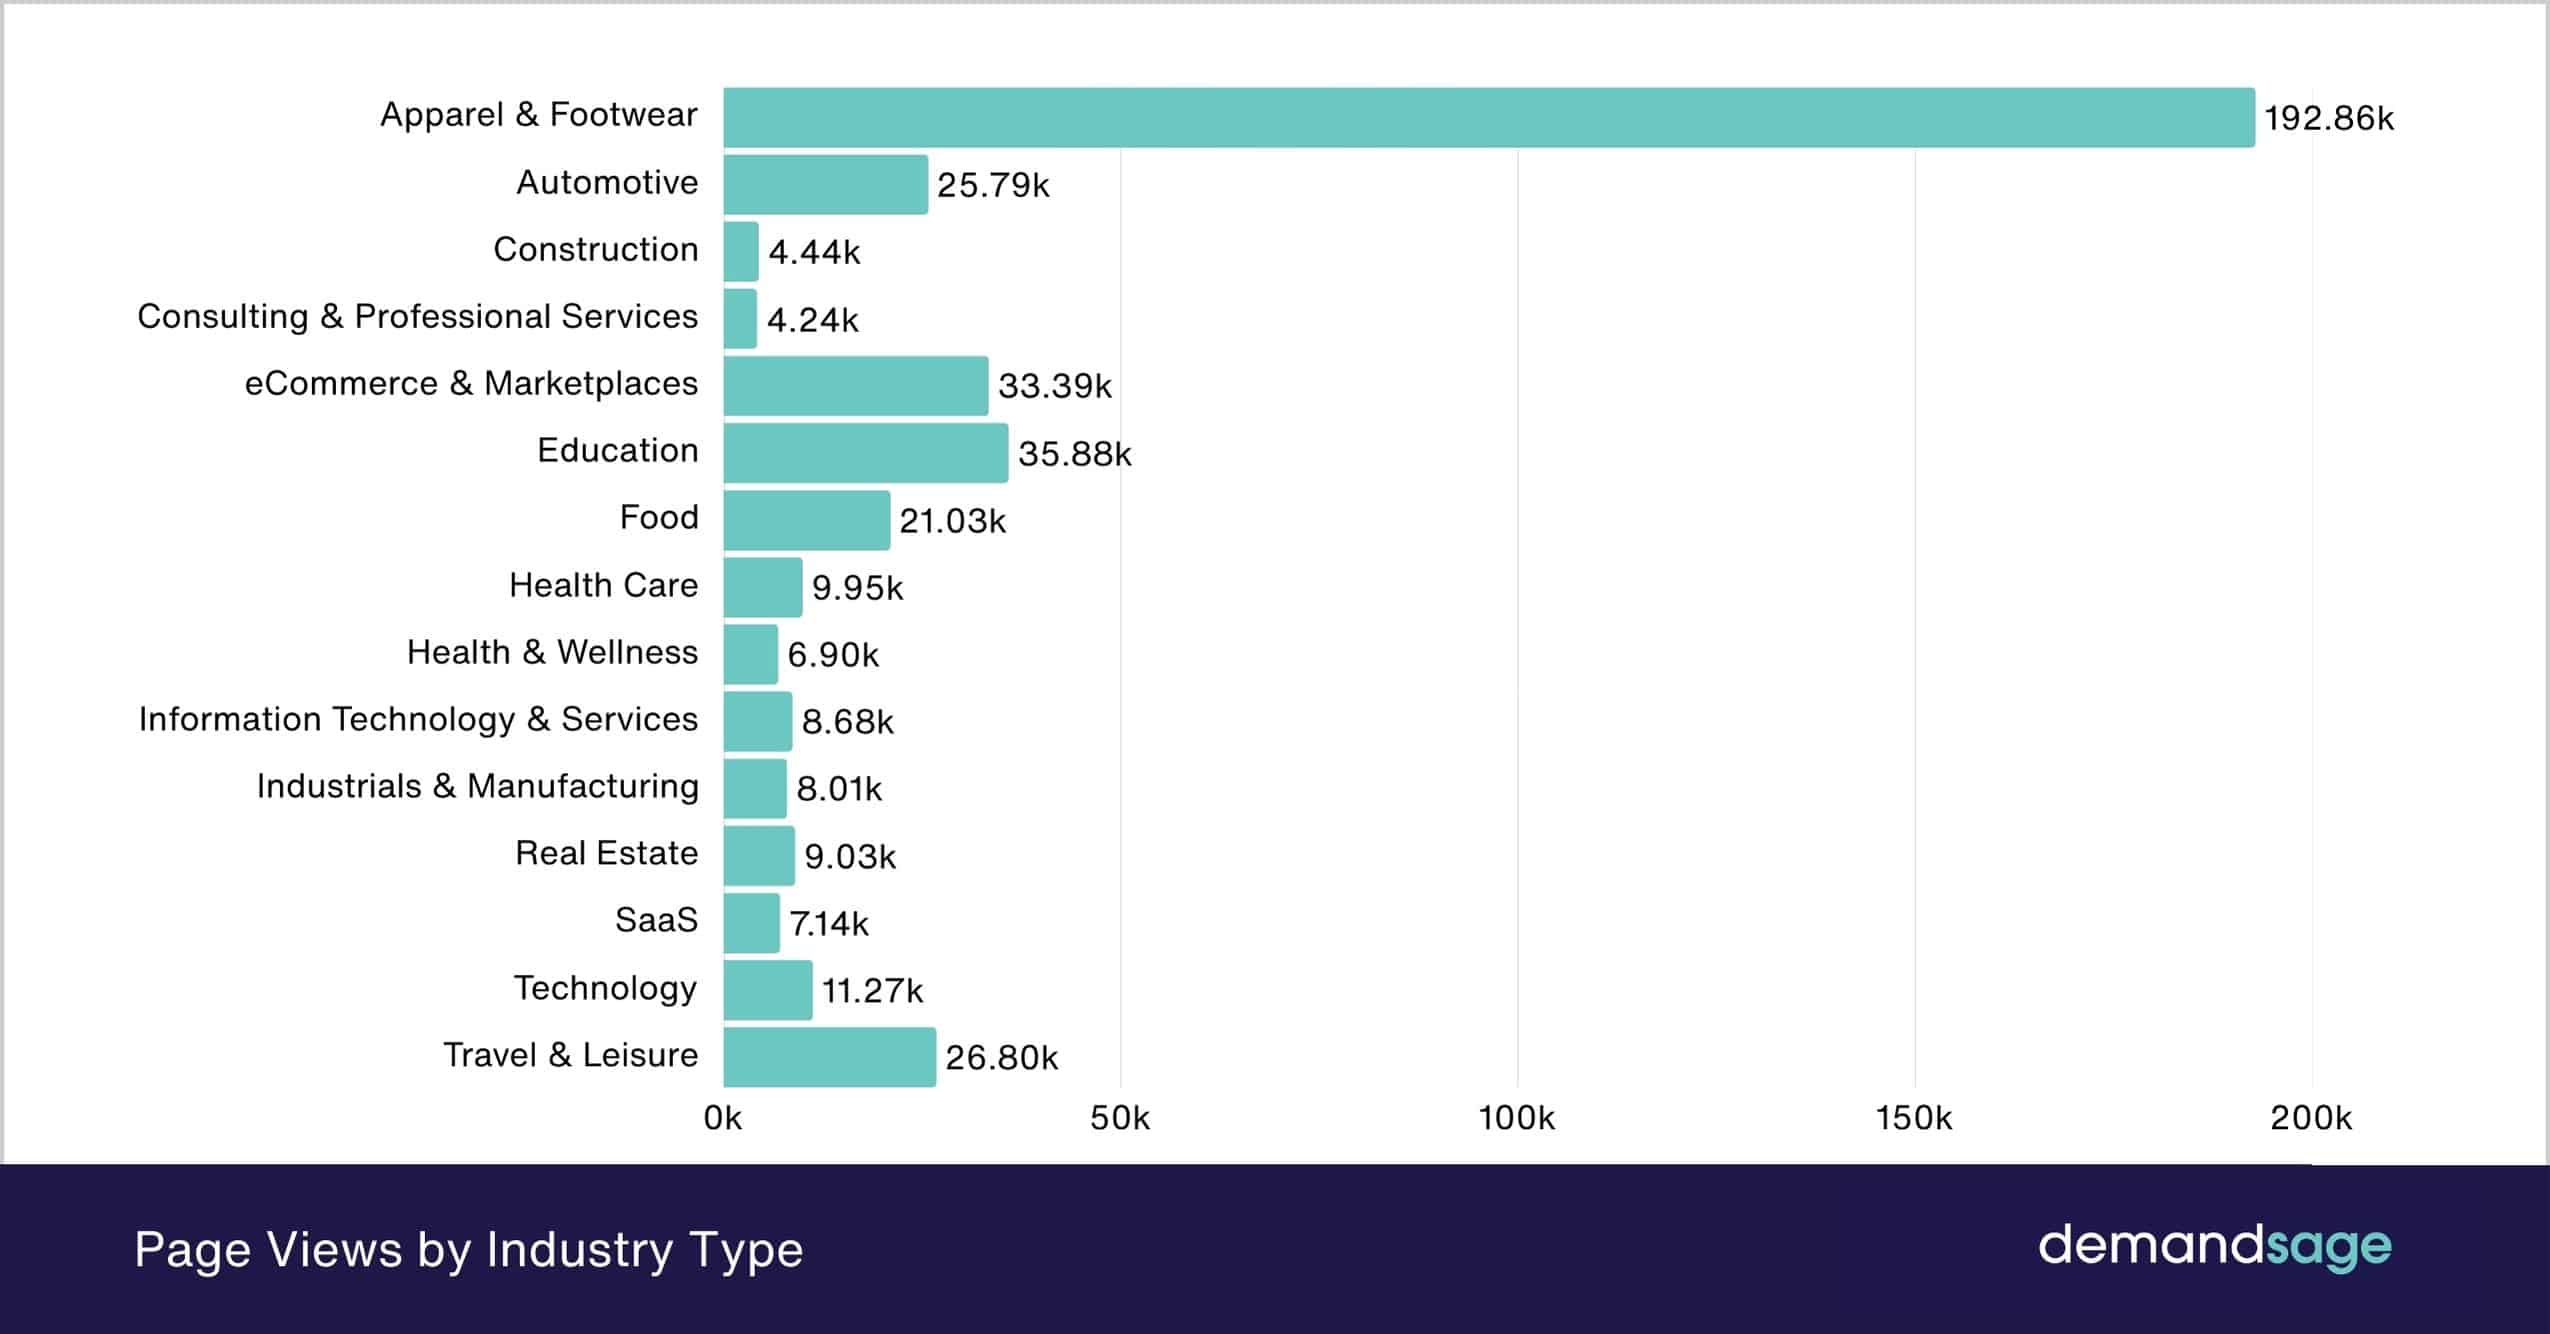
Talking of page views, just like new users, the apparel and footwear sector was way ahead of all other sectors with 192.86k views.
The education sector, which had 35.88k views, was 5.7 times less than apparel and footwear.
Travel & Leisure (26.8k) and automotive (25.79k) also show strong traffic benchmarks, together accounting for nearly one-fourth of the total new users across all industries.
On the lower end, industries such as construction (4.44k), consulting & professional services (4.24k), and SaaS (7.14k) attract significantly fewer new users.
Sr. No.IndustryNew Users1Apparel & Footwear192.86k2Automotive25.79k3Construction4.44k4Consulting & Professional Services4.24k5eCommerce & Marketplaces33.39k6Education35.88k7Food21.03k8Health Care9.95k9Health & Wellness6.9k10Information Technology & Services8.68k11Industrials & Manufacturing8.01k12Real Estate9.03k13SaaS7.14k14Technology11.27k15Travel & Leisure26.8k
Source: Databox
Website Traffic By Device
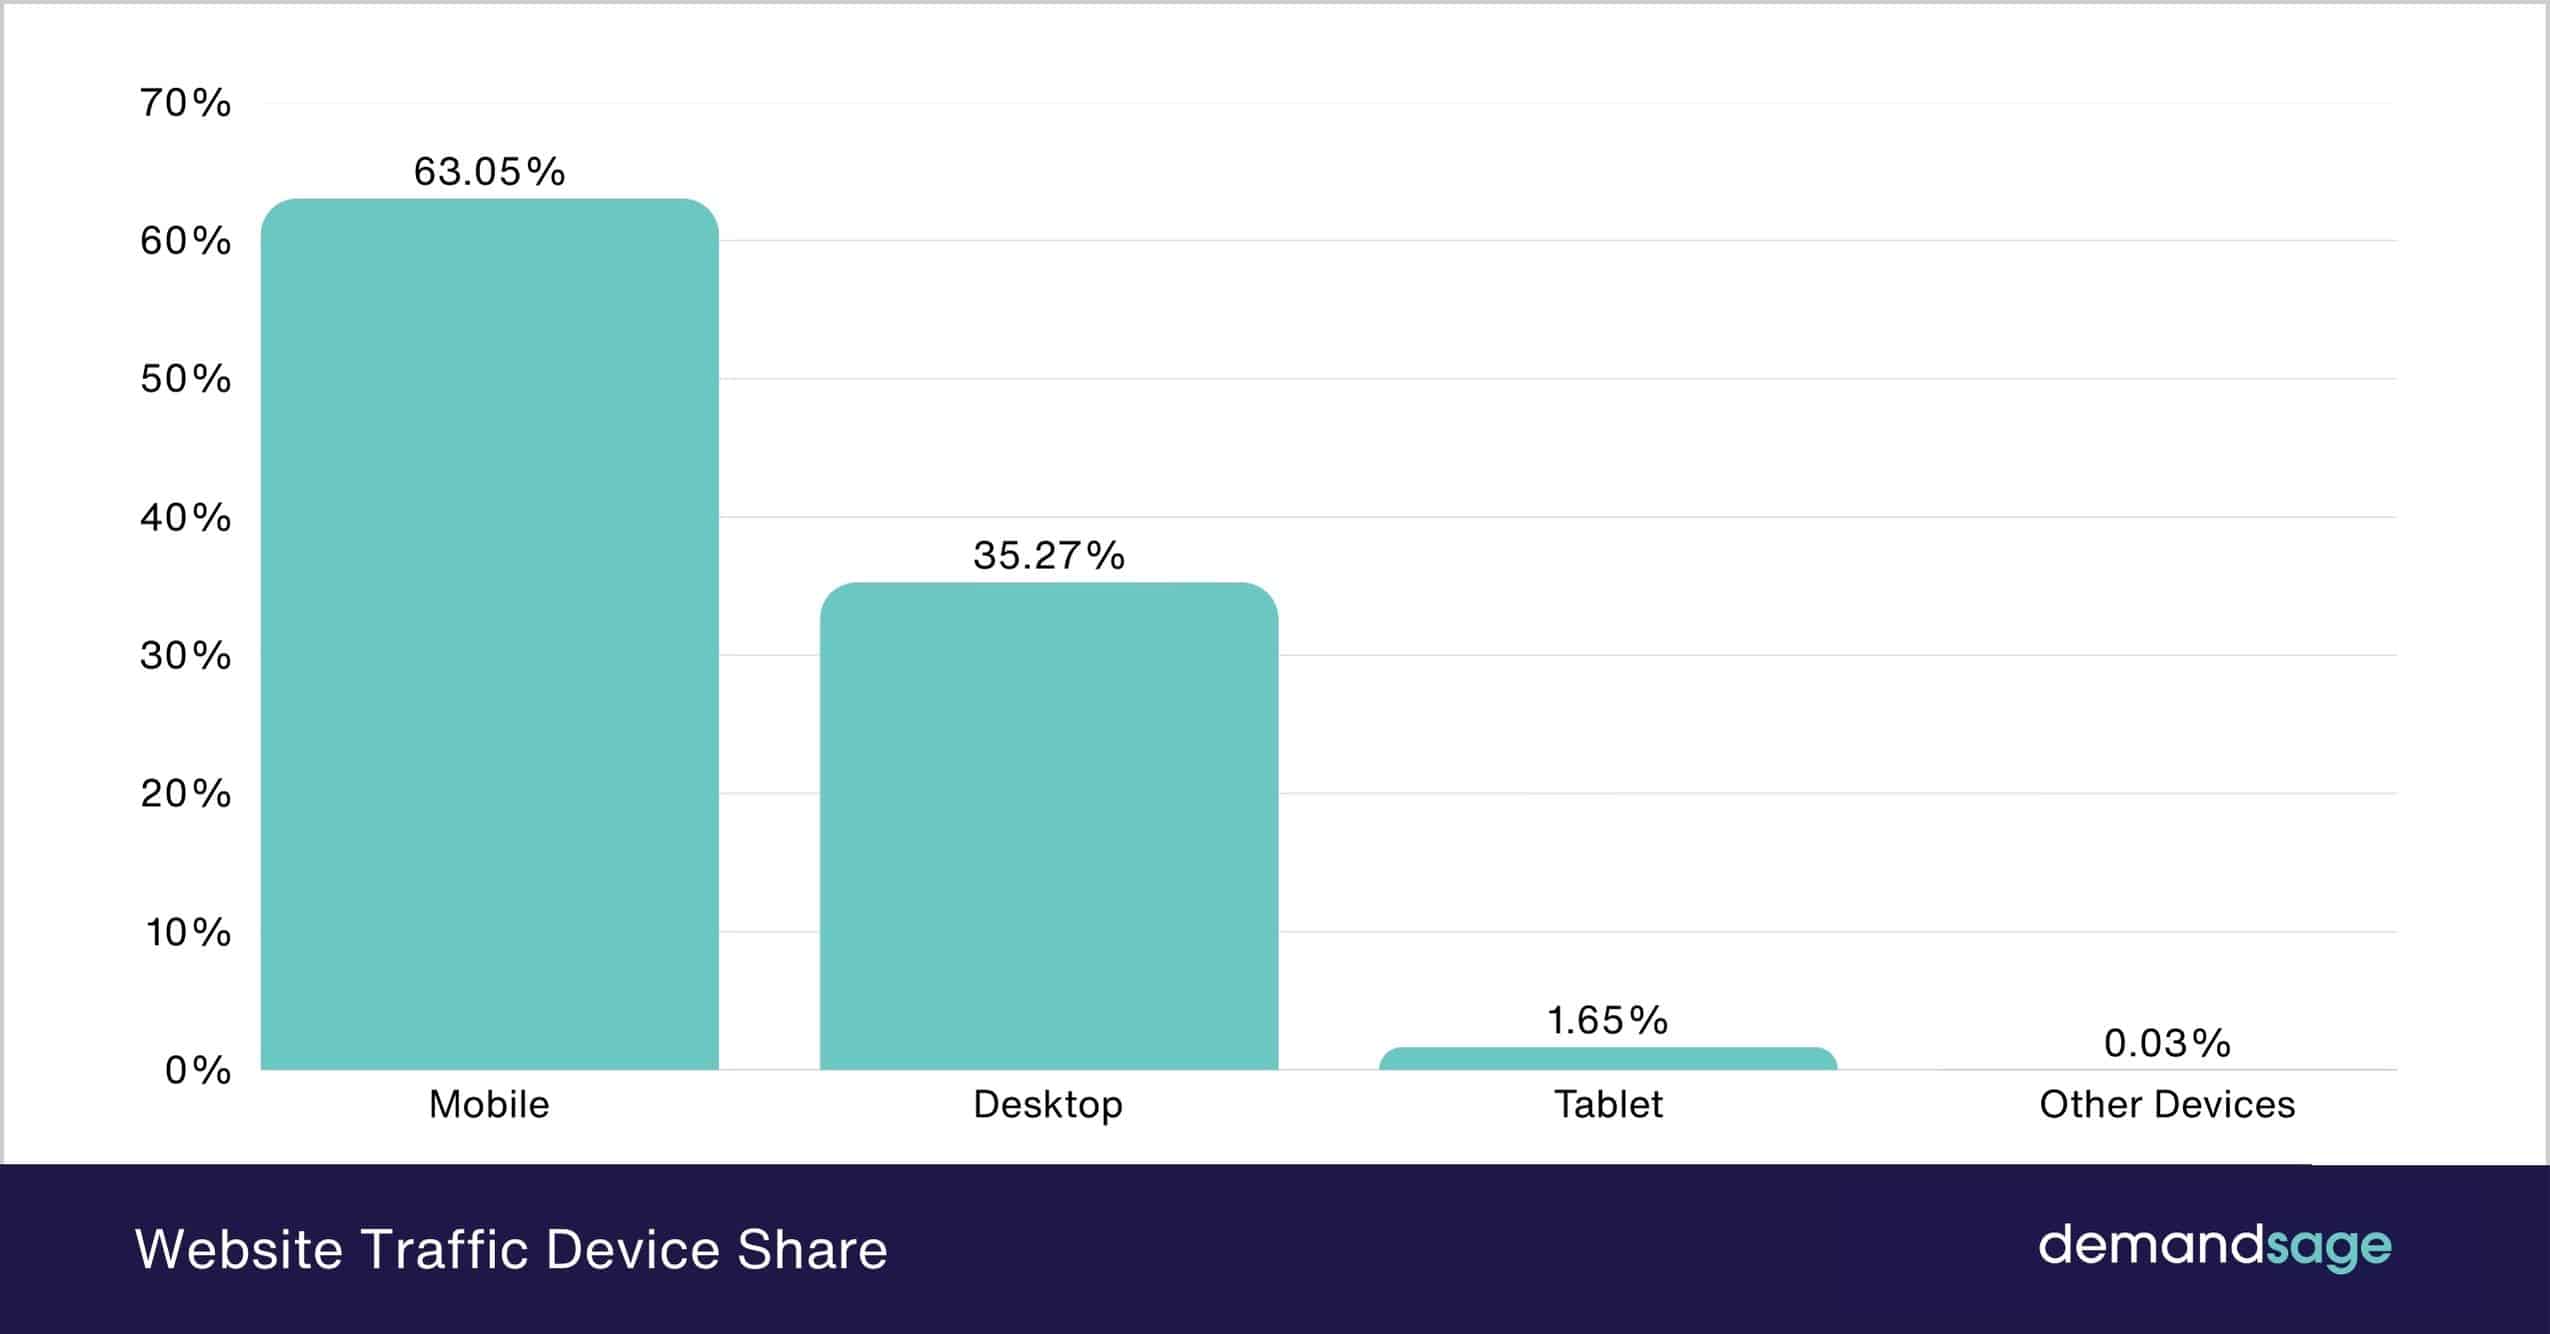
Mobile devices dominate the web traffic with a 63.05% share, which is almost two-thirds of the total traffic.
Desktop, which was once the only device for using the internet, now shares 35.27% of the total web traffic.
Other devices like smart TVs, gaming consoles, etc, contribute to just 0.03% of the total web traffic.
Sr. No.DeviceTraffic Share 1Mobile63.05%2Desktop35.27%3Tablet1.65%4Other Devices0.03%
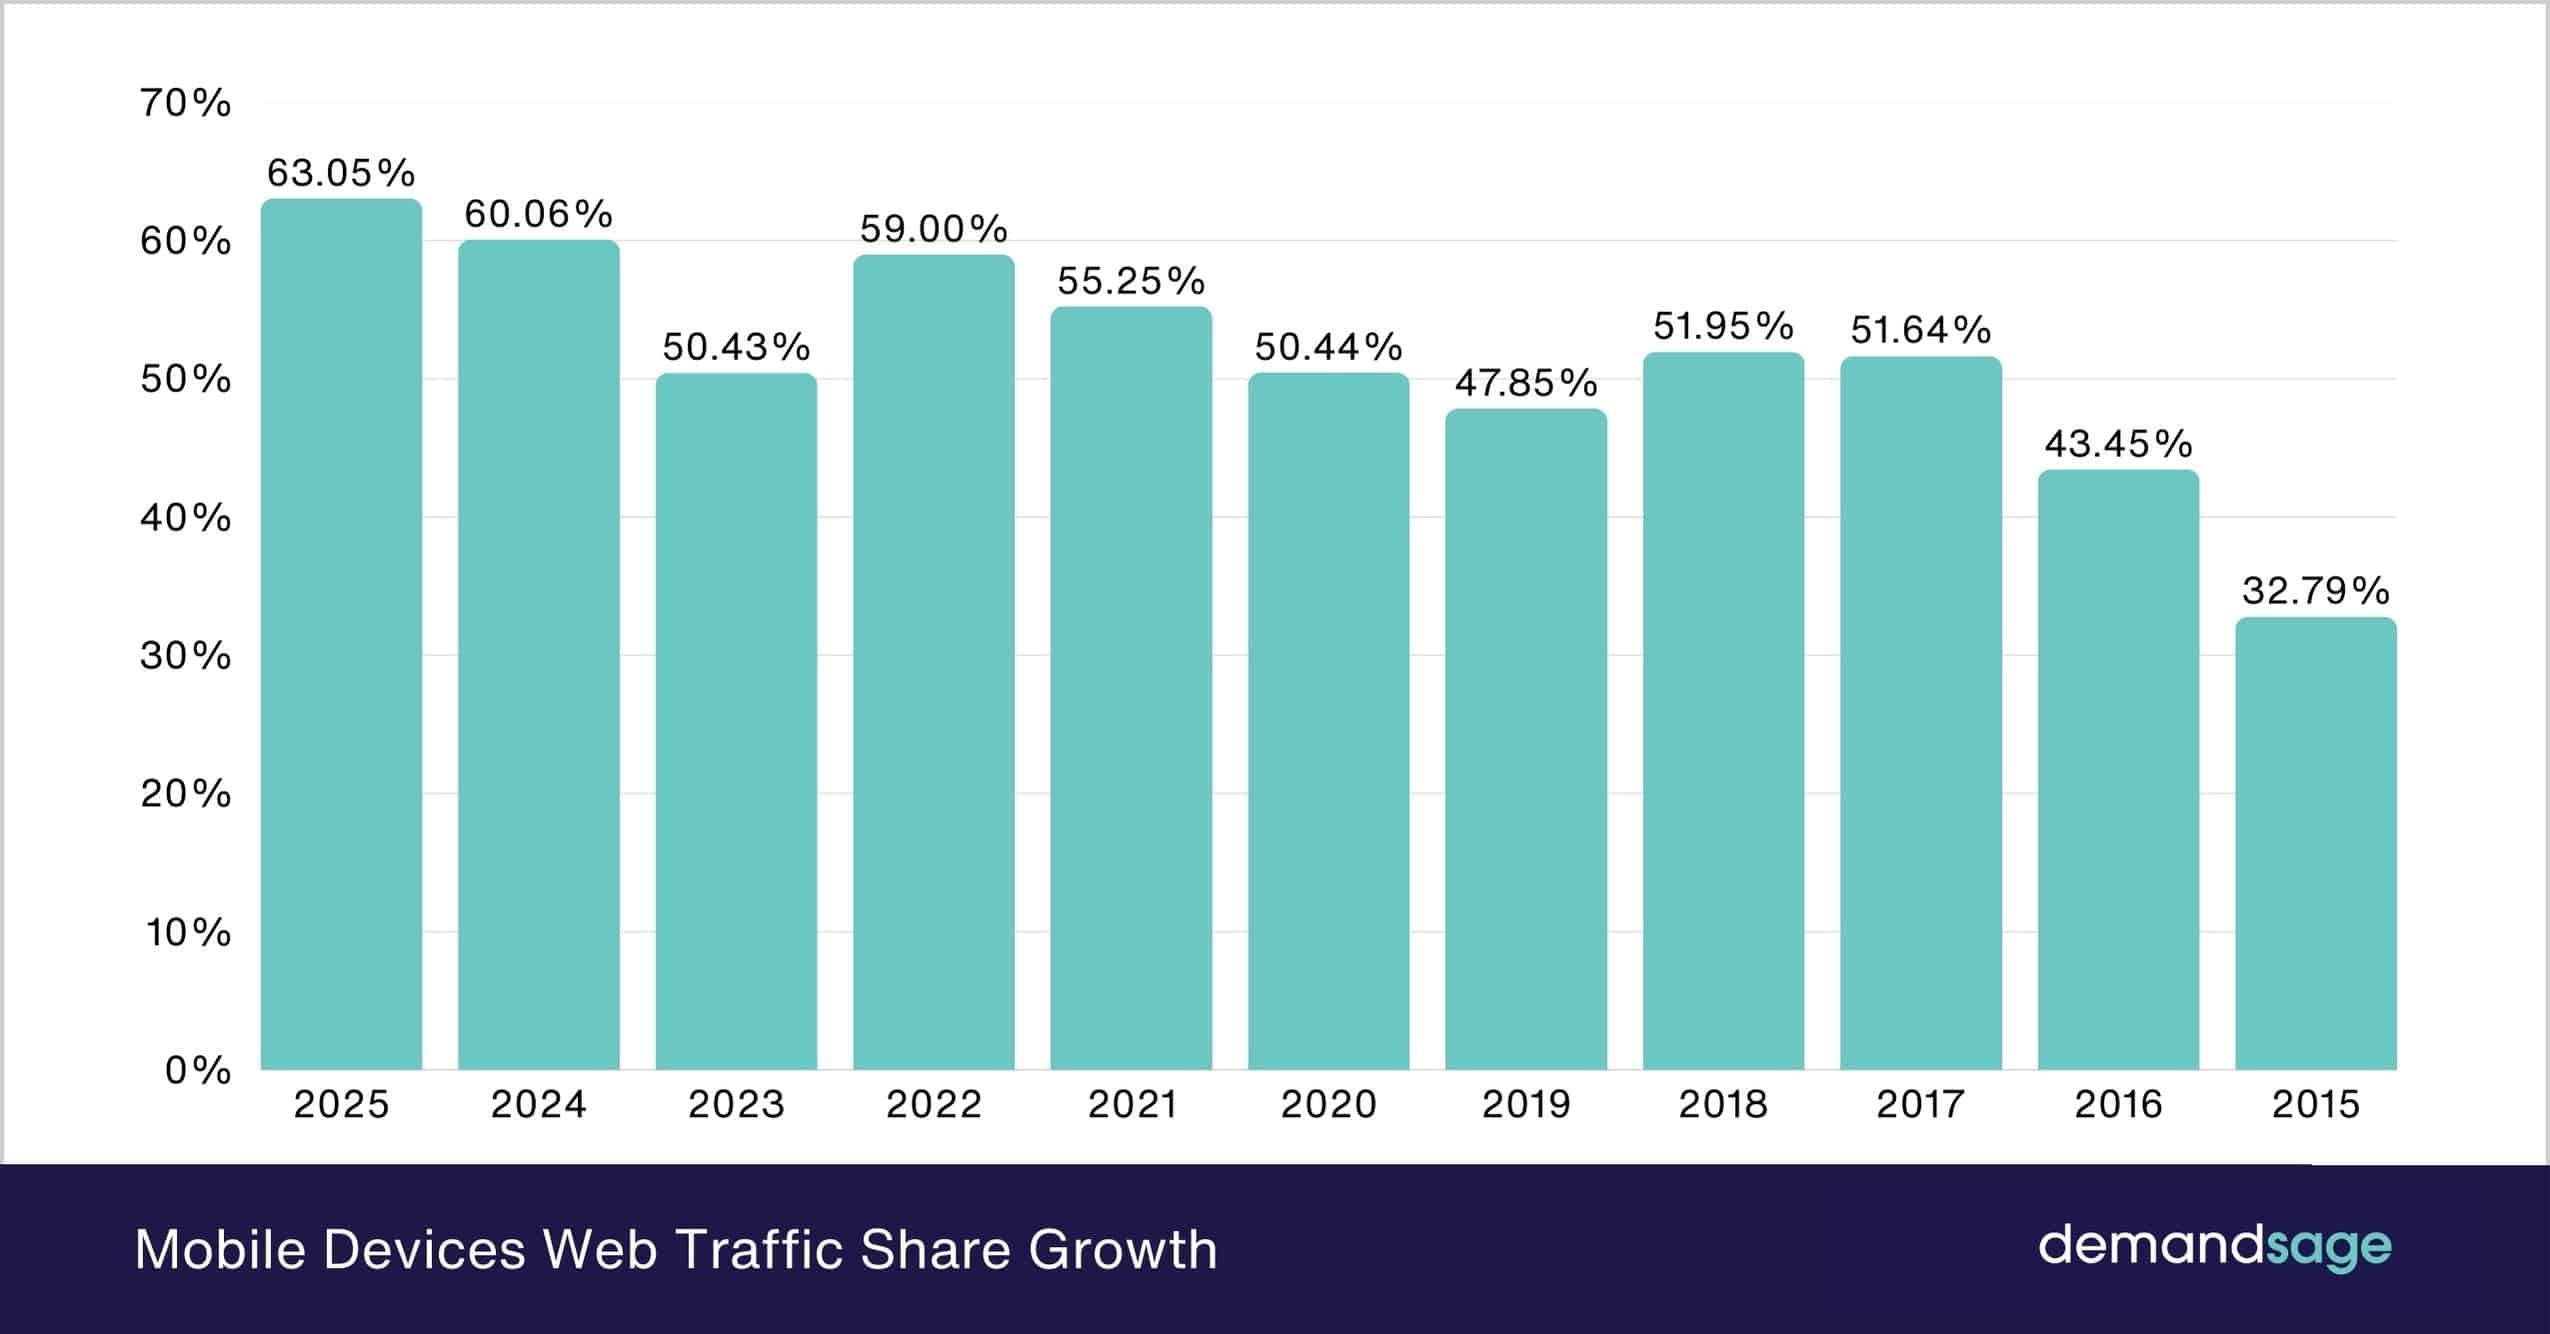
Since 2015, mobile’s share in the global web traffic has grown by 92.28%.
The CAGR over the 10 years is around 6.55%, showing steady annual growth.
Sr. No.YearMobile Web Traffic Share1202563.05%2202460.06%3202350.43%4202259.00%5202155.25%6202050.44%7201947.85%8201851.95%9201751.64%10201643.45%11201532.79%
Source: Datareportal
These numbers make it clear that a mobile-first approach to website design is essential, especially since mobile users are 5X more likely to abandon a task on a non-optimized site.
Source: Toptal
Top Website Statistics
With 105 billion monthly visits, Google remains far ahead in the global web traffic race, reaffirming itself as the first preference of almost everyone when it comes to information seeking.
As the second most visited site, YouTube continues to lead in video content with 47 billion visits, though it lags significantly behind Google in overall visits.
WhatsApp.com shows high user engagement, with a typical session lasting 38 minutes and 56 seconds. This is almost three times longer than YouTube’s 23 minutes and 51 seconds.
ChatGPT.com quickly rose into the top five globally with 5.24 billion monthly visits – it passed Wikipedia, with 5.07 billion trips, and Reddit, with 4.51 billion – this shows a notable move toward interaction guided by AI.
The numbers suggest a trend – users do not just consume content; they increasingly use sites that offer practical help, communication, and immediate support.
RankWebsiteUnique Visitors (Monthly Ave.)Average Time/VisitAverage Pages/Visit1google.com5.87 billion13m 04s5.292youtube.com3.06 billion23m 51s8.513facebook.com1.67 billion16m 49s7.524instagram.com1.30 billion13m 34s9.245chatgpt.com597 million15m 25s4.456wikipedia.org1.21 billion9m 19s2.937reddit.com962 million13m 26s3.58pornhub.com886 million10m 21s7.89x.com820 million17m 04s8.6710whatsapp.com480 million38m 56s6.0611bing.com504 million11m 22s4.1212xvideos.com586 million12m 33s9.1113amazon.com603 million11m 42s6.6714yahoo.com397 million12m 37s4.1715temu.com507 million9m 10s2.6916duckduckgo.com166 million14m 42s2.6617yahoo.co.jp158 million12m 13s5.518tiktok.com787 million10m 45s7.219yandex.ru230 million11m 48s4.7420weather.com507 million3m 14s1.61
Source: Datareportal
Website Traffic Trends Statistics
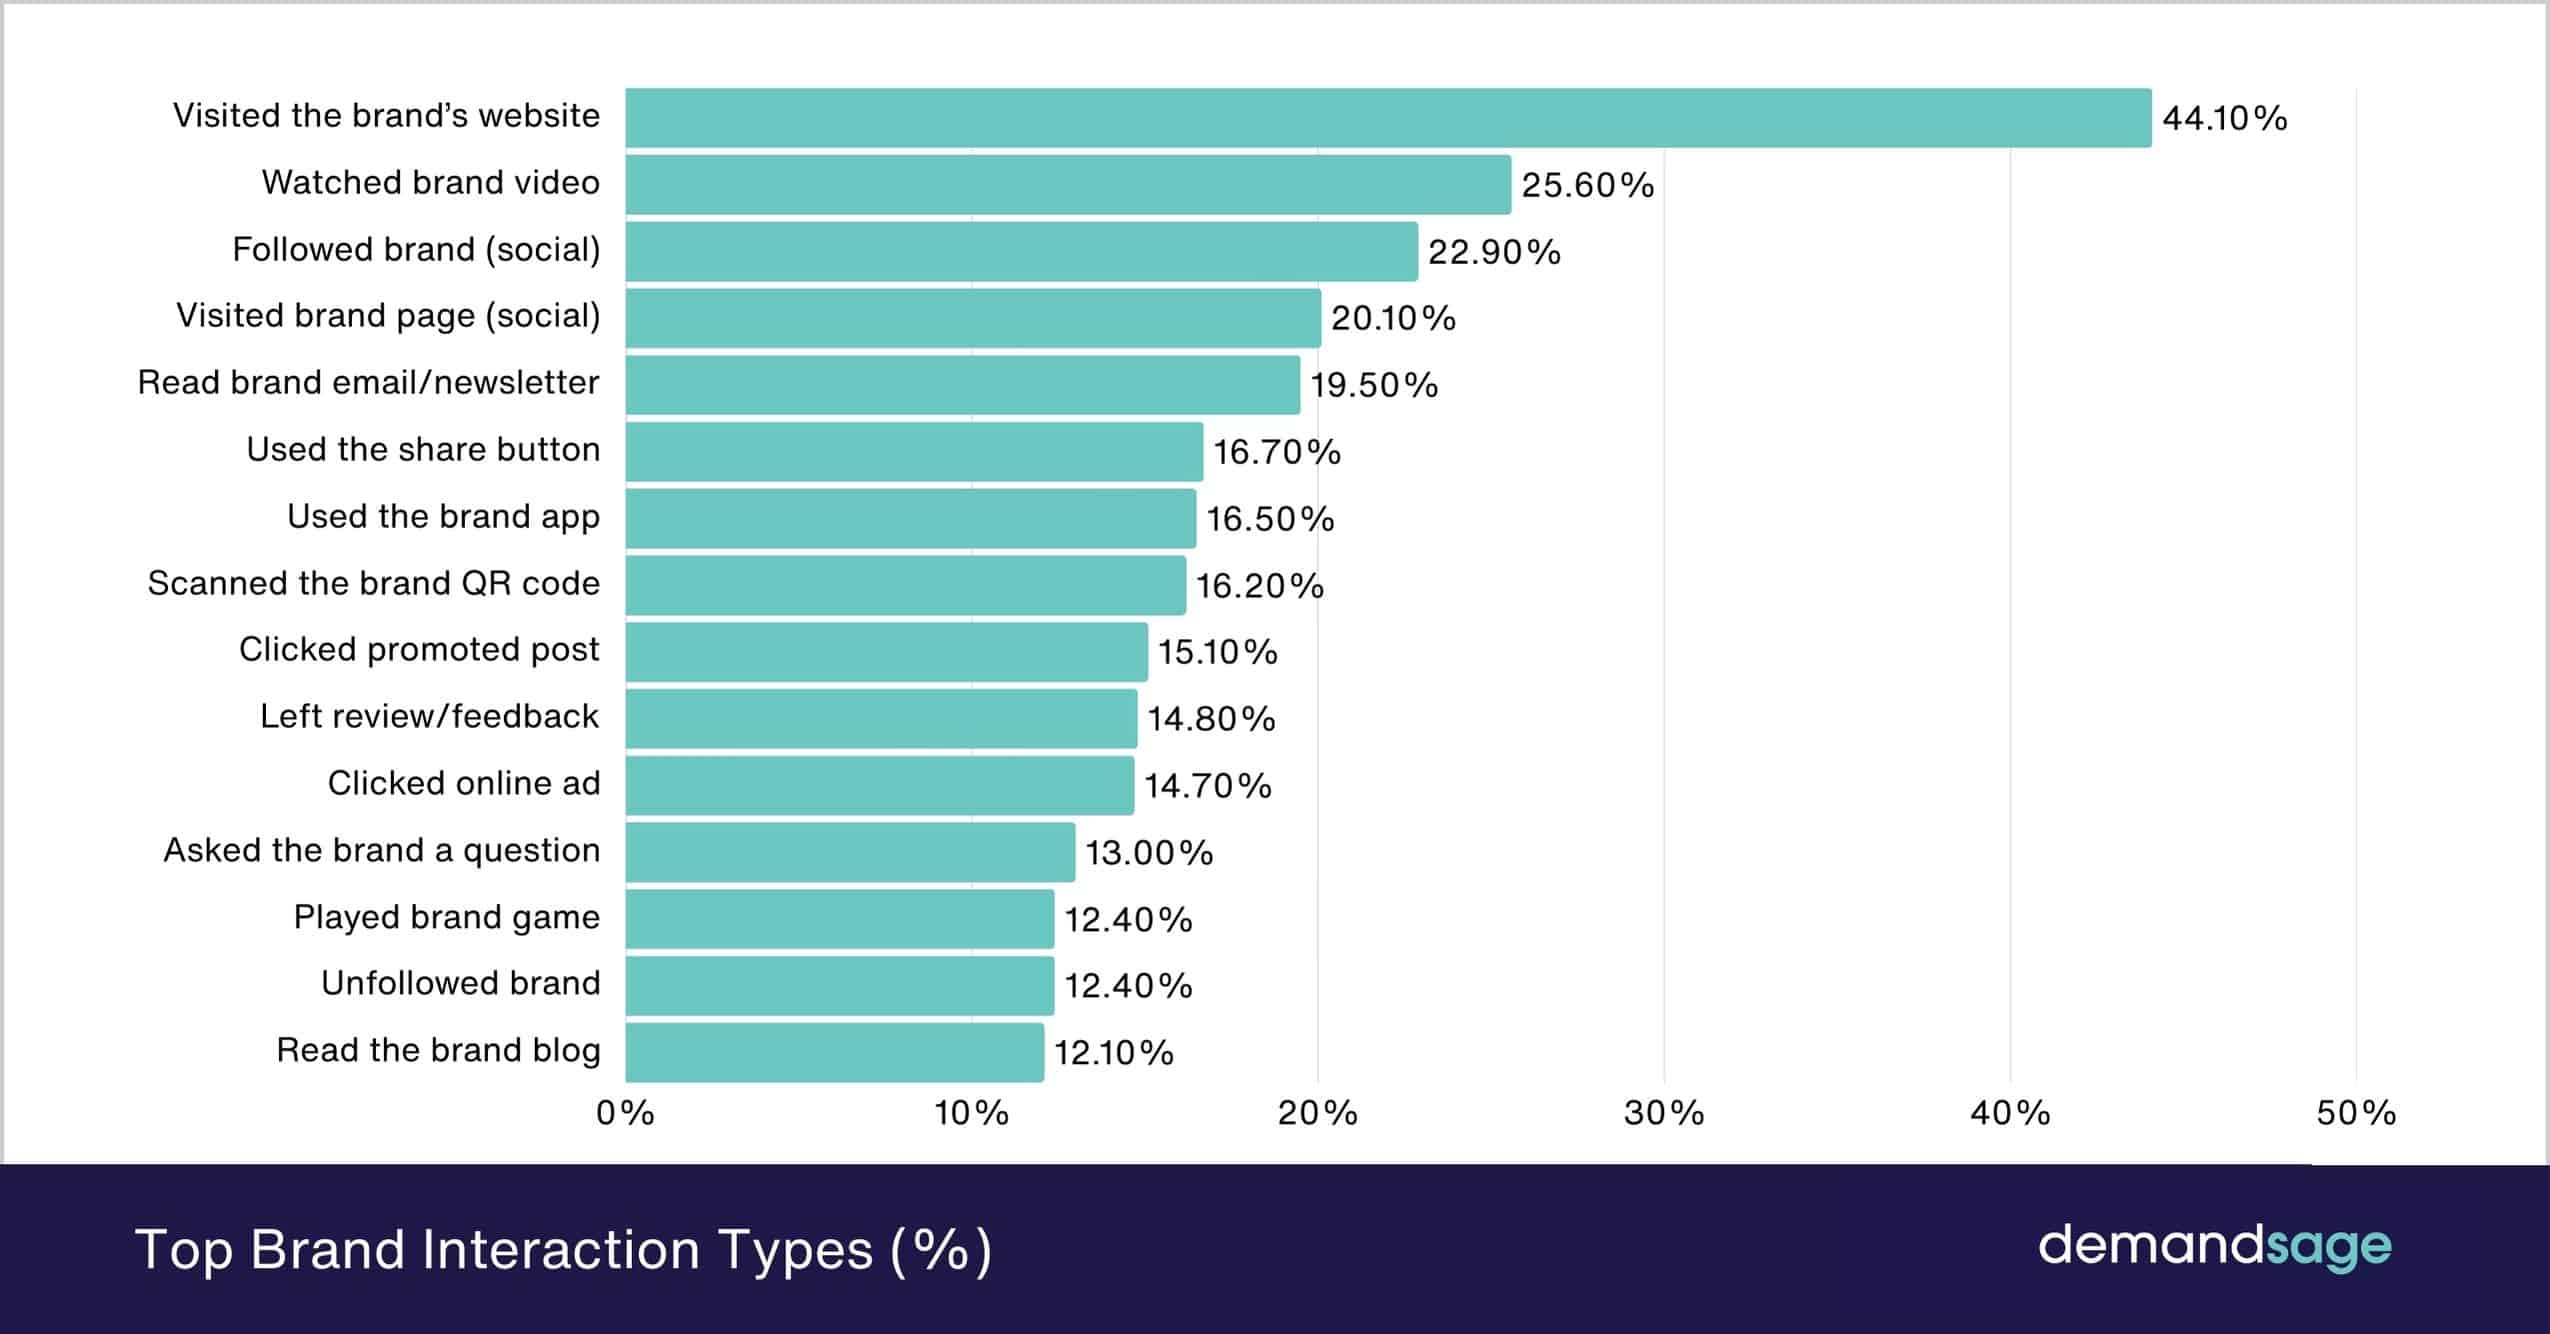
44% of the internet population aged 16 and above has visited at least one brand website in the past month.
A brand’s social media page receives 24 percentage points fewer visits than its website. This shows that people visit websites more often than social media pages.
This makes website traffic a crucial medium to get attention online.
RankInteraction TypePercentage (%)1Visited the brand’s website44.10%2Watched brand video25.60%3Followed brand (social)22.90%4Visited brand page (social)20.10%5Read brand email/newsletter19.50%6Used the share button16.70%7Used the brand app16.50%8Scanned the brand QR code16.20%9Clicked promoted post15.10%10Left review/feedback14.80%11Clicked online ad14.70%12Asked the brand a question13.00%13Played brand game12.40%14Unfollowed brand12.40%15Read the brand blog12.10%
Source: Datareportal
Organic vs Referral vs Paid Traffic
Siege Media recently analyzed 352 million sessions from its past clientele to check ChatGPT’s referral traffic to websites from May to July 2025.
In May 2025, organic search generated 107.7 million sessions.
In June 2025, organic search traffic increased to 113.1 million sessions.
In July 2025, organic search sessions jumped further to 131 million, representing a 15.9% increase compared to June.
In May 2025, ChatGPT referrals accounted for 265,947 sessions.
In June 2025, ChatGPT referral traffic grew by 10.7% reaching 294,497 sessions.
In July 2025, ChatGPT referral traffic declined by 3.8%, dropping to 283,169 sessions.
By July 2025, organic search traffic was over 460 times larger than GPT referral traffic.
Source: Siegemedia
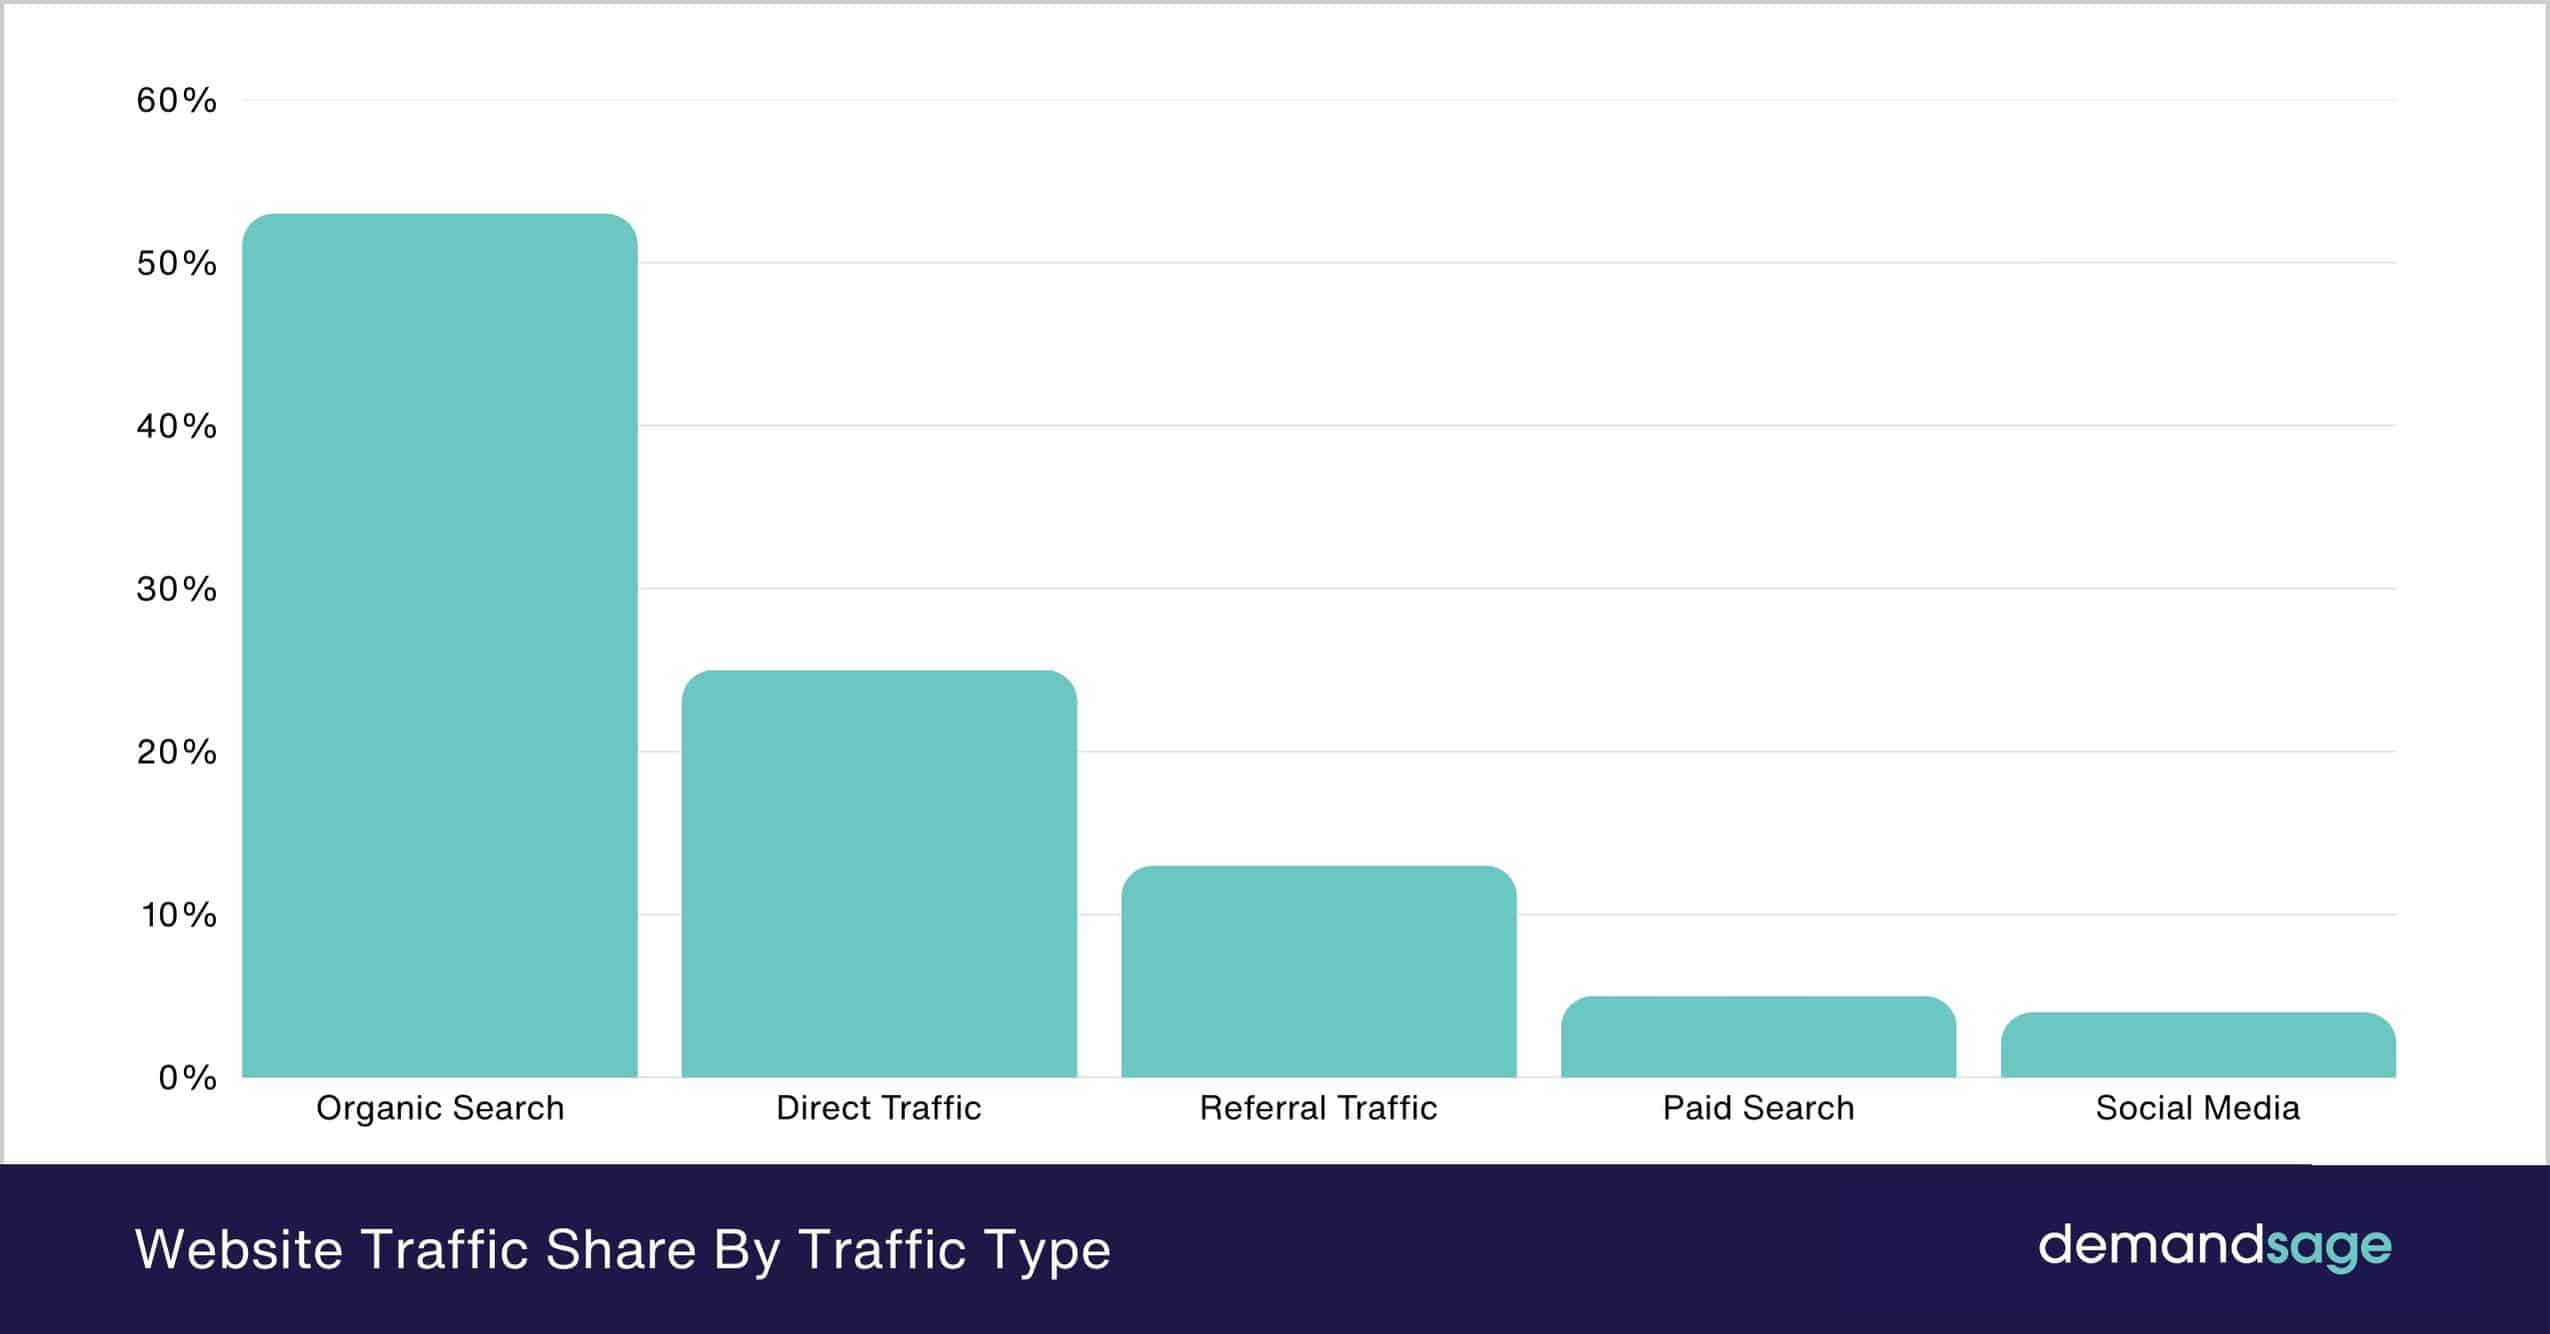
Organic search comprises 53% of all websites in 2025.
Source: Seoinc
This is a very evident fact as search engines drive a lot of traffic, and are used by 80.6% of internet users as a gateway to other sites.
Source: Datareportal
Direct traffic accounts for 25% of website visits in the standard traffic distribution.
Referral traffic represents 13% of the overall website traffic.
Source: Seoinc
Search Engine Traffic Trends
The smaller share of referral traffic can be observed in Google’s search engine traffic pattern, which has surprisingly reduced by 3.64 percentage points from 2023 to 2025.
The possible reasons being discussed for this decline are the increasing AI-overviews and zero-click search offerings by the platform.
Source: wearesocial
Social media drives 4% of the website traffic despite chat and messaging apps/websites being used by 93% of the internet users.
Source: Datareportal
Paid search accounts for 5% of total traffic, which suggests the audience’s preference for organic results over sponsored results.
Sr. NoTraffic TypeTraffic Share %1Organic Search53%2Direct Traffic25%3Referral Traffic13%4Paid Search5%5Social Media4%
Source: Seoinc
Website Traffic by Category
Email and shopping sites are also popular, with over 70% of users visiting, while business and gaming sites see less traffic, under 35%.
Leisure categories like Shopping attract 74.3% of traffic. Business or work, a professional activity, attracts 29.5%.
The 44.8-point difference shows that users prefer to use services for personal reasons over work.
Sr. No.Type of Website/AppPercentage of Internet Users (%)1Chat and Messaging93.6%2Social Networks93.4%3Search Engines or Web Portals80.6%4Email75.8%5Shopping, Auctions, or Classifieds74.3%6Maps, Parking, or Location-Based Services53.8%7Music47.5%8Entertainment44.9%9Weather42.8%10News41.5%11Banking, Investing, or Insurance38.6%12Travel37.8%13Food Takeaway & Delivery37.4%14Games32.3%15Business, Work, and Collaborative Working29.5%
Source: Datareportal
Bing showed consistent gains over the period, growing from 2.77% in 2023 to 3.98% in 2025. This shows a 43.7% relative growth in referral traffic share.
Yandex saw the most significant growth, increasing from 1.17% in 2023 to 2.51% in 2025. Its share is more than double, showing its growing reach in the search market.
Sr. No.Search Engine2023202420251Google92.64%91.06%89.57%2Bing2.77%3.72%3.98%3Yandex1.17%1.45%2.51%4Yahoo1.09%1.26%1.33%5Baidu0.84%0.87%0.82%6Duckduckgo0.51%0.6%0.69%7Naver0.21%0.39%0.31%8Others0.77%0.65%0.79%
Source: Datareportal, Datareportal 2, Datareportal 3
Social Media Referral Traffic
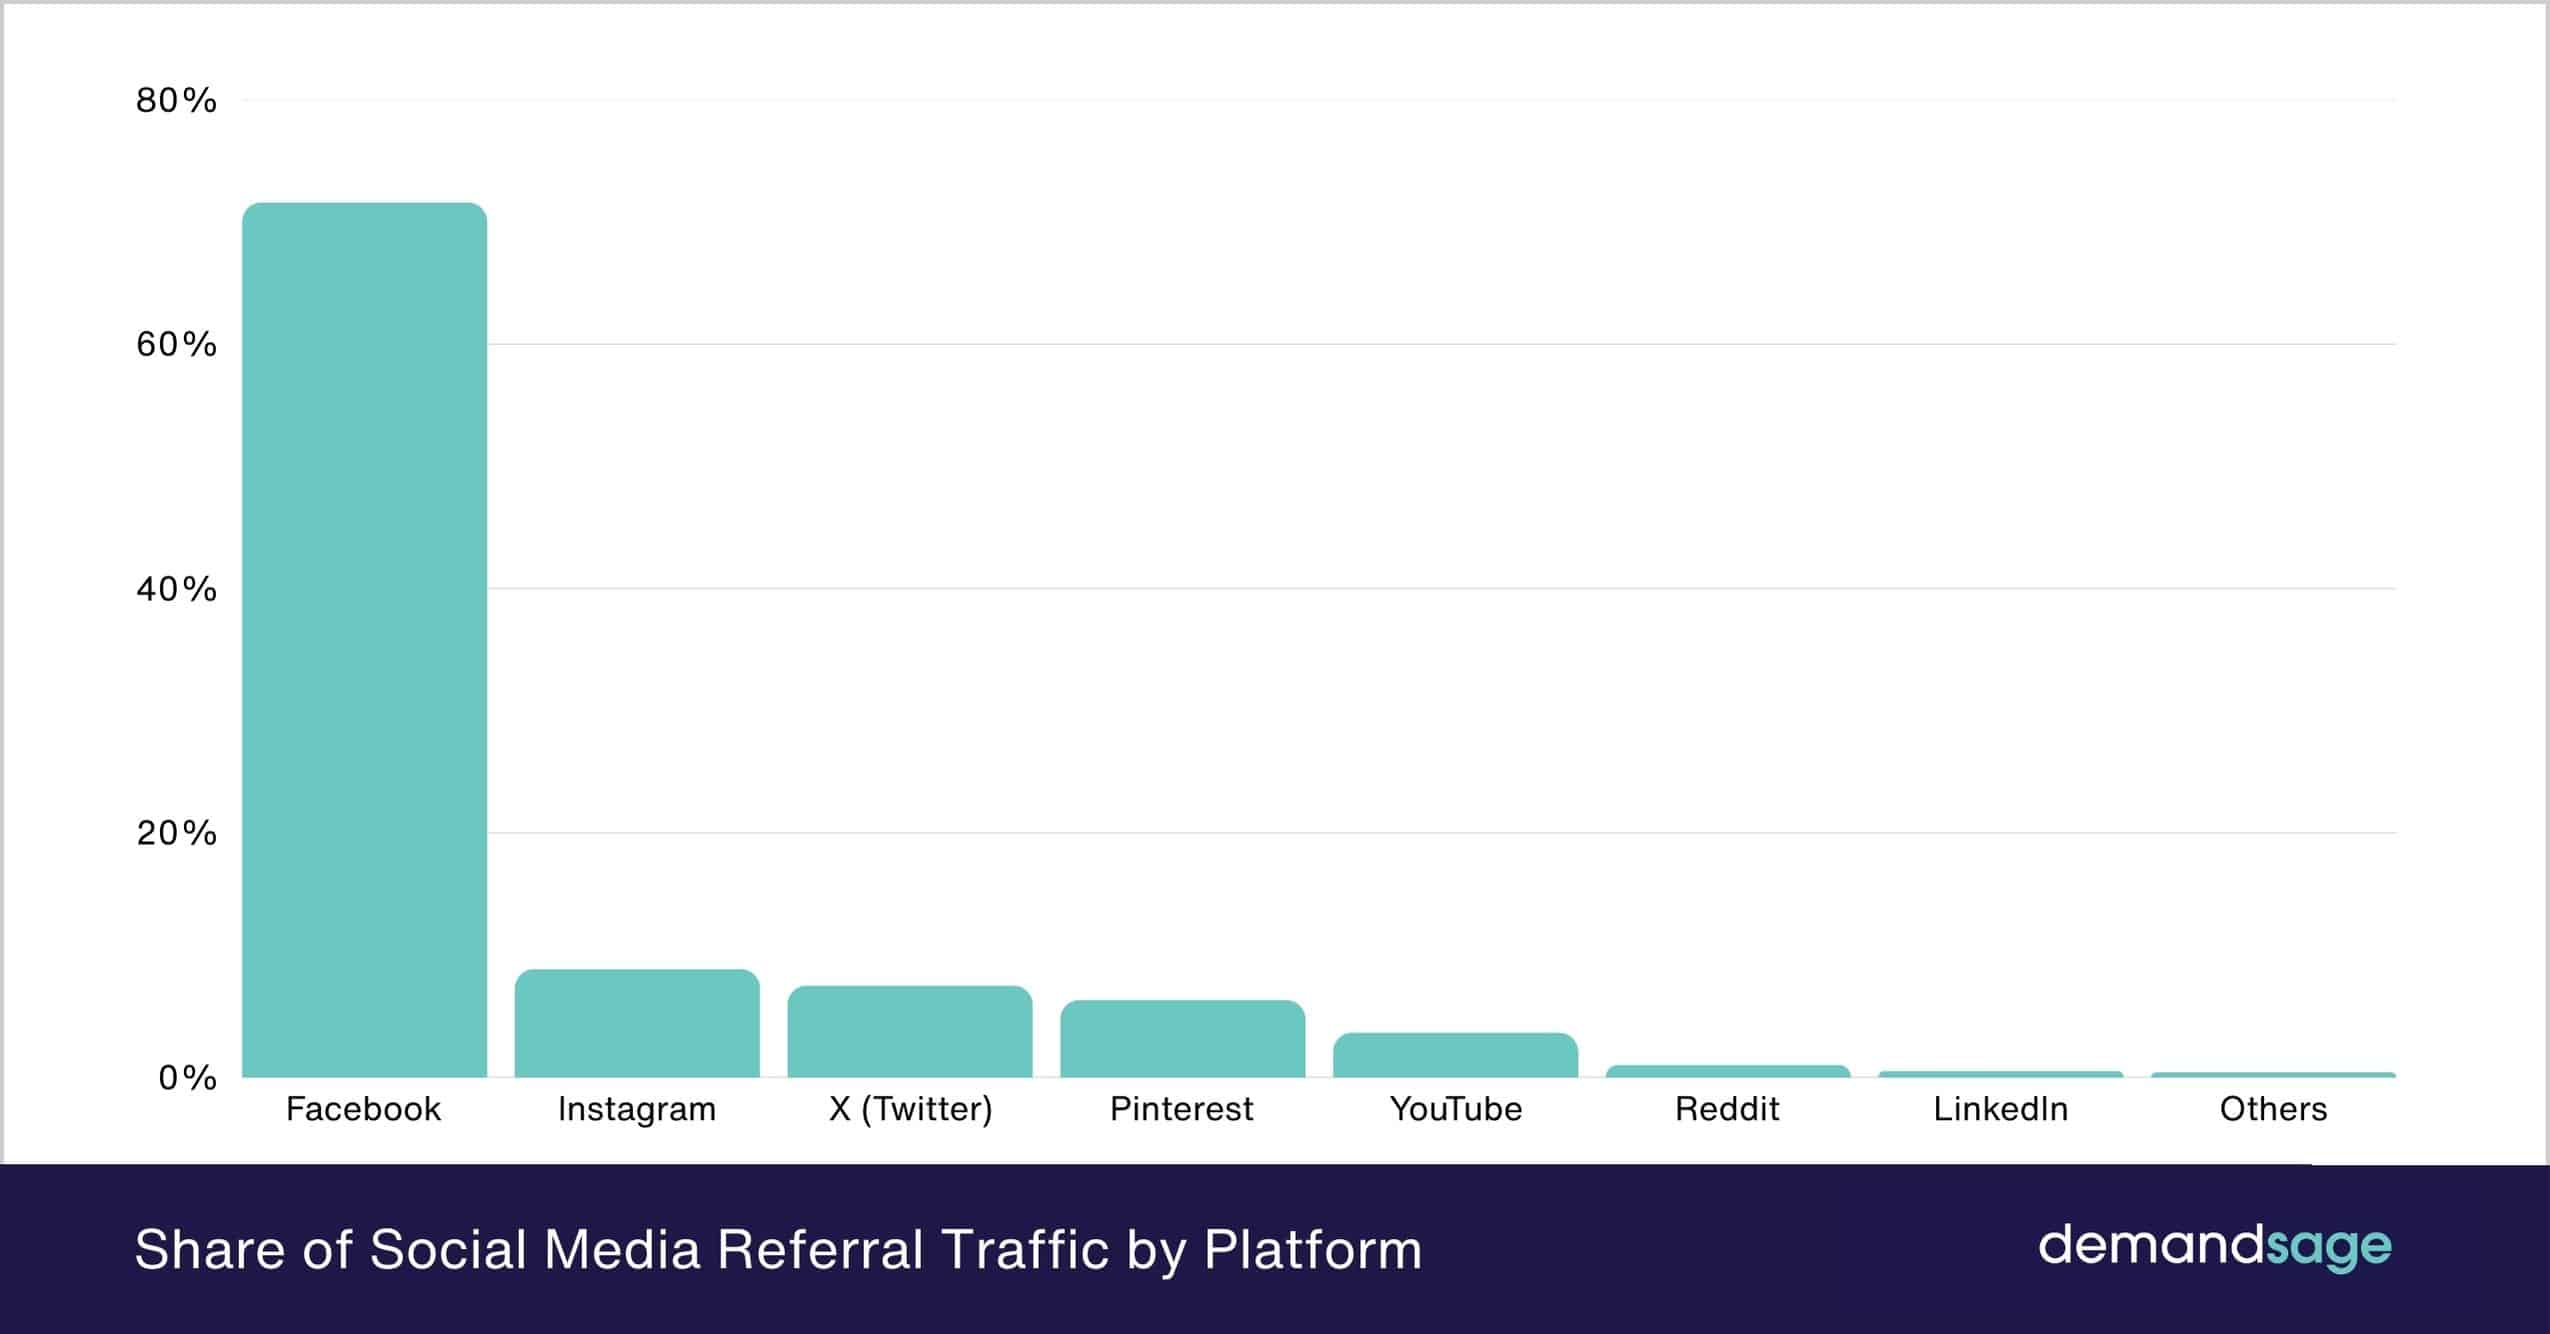
Facebook accounts for 71.58% of social media referral traffic, making it the dominant platform, driving more than almost 8 times the traffic of Instagram, which is the second largest platform at 8.88%.
The combined share of Instagram, X, and Pinterest totals 22.74%. This is less than one-third of Facebook’s (23.86%).
LinkedIn and Reddit together send only 1.59% of traffic; they direct a few users to other sites compared to mainstream platforms.
Sr. No.Social Media PlatformShare of Referral Traffic (%)1Facebook71.58%2Instagram8.88%3X (Twitter)7.52%4Pinterest6.34%5YouTube3.67%6Reddit1.04%7LinkedIn0.55%8Others0.42%
Source: Datareportal
Website Traffic Benchmarks
According to HubSpot, an average website gets 375,773 visits per month, but the top websites with very high traffic easily change this average.
A median website draws 20,000 unique visitors each month.
46% of the websites get 1,001 to 15,000 total monthly visitors.
Only 0.5% of the websites get over 10 million visitors every month.
Sr. No.Monthly Unique Visitors% of Websites11,001-15,00046%215,001-50,00019.3%350,001-250,00023.2%4250,001-10 million11%5Over 10 million0.5%
Source: Hubspot
Conclusion: Google Is Top Visited Website With 100+ Billion Monthly Active Visits!
Over 63% of all visits to websites in 2025 now come from smartphones, showing the small screen dominates browsing behavior. Additionally, Google still commands the lion’s share with 105 billion visits monthly, setting the pace for discovery.
Organic search is another important driver that drives 53% of site visits, far outpacing social media, where Facebook alone contributes a staggering 71.58% of referrals.
In conclusion, the success of any website now depends on following traffic flows. Brands that align with these patterns will capture attention, those that don’t risk fading into obscurity.

