
Sep 1, 2025
IndexBox has just published a new report: U.S. – Silver Ores And Concentrates – Market Analysis, Forecast, Size, Trends And Insights.
The silver ore market in the United States is forecasted to experience a slight increase in performance, with a projected CAGR of +1.6% in volume and +2.2% in value from 2024 to 2035. By the end of 2035, the market volume is expected to reach 1.3K tons, with a market value of $7.6M in nominal prices.
Market Forecast
Driven by rising demand for silver ore in the United States, the market is expected to start an upward consumption trend over the next decade. The performance of the market is forecast to increase slightly, with an anticipated CAGR of +1.6% for the period from 2024 to 2035, which is projected to bring the market volume to 1.3K tons by the end of 2035.
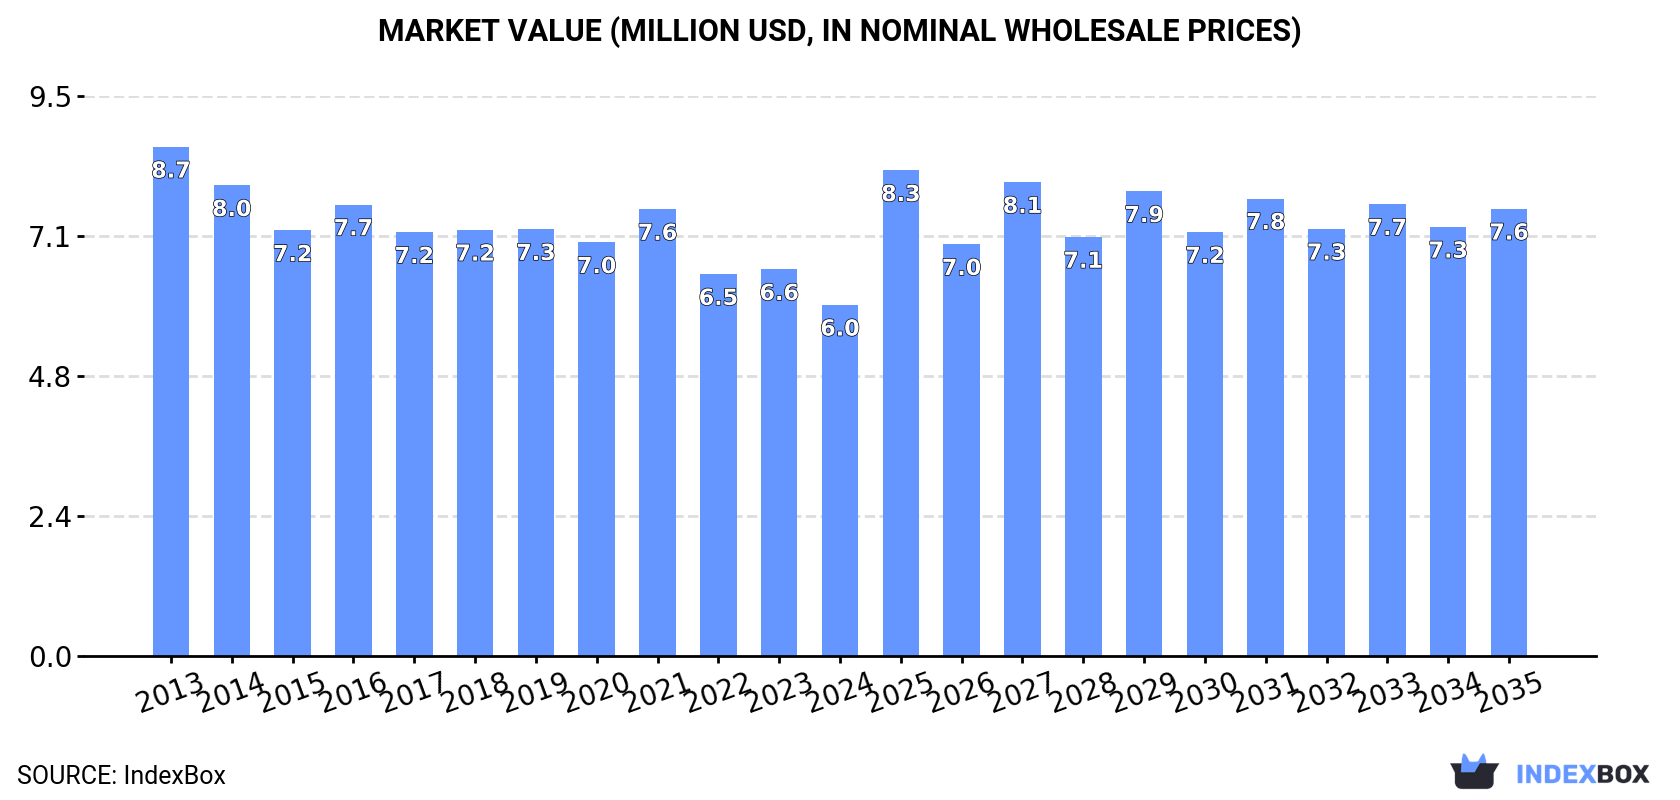
In value terms, the market is forecast to increase with an anticipated CAGR of +2.2% for the period from 2024 to 2035, which is projected to bring the market value to $7.6M (in nominal wholesale prices) by the end of 2035.
 ConsumptionUnited States’s Consumption of Silver Ores And Concentrates
In 2024, consumption of silver ores and concentrates decreased by -11.3% to 1.1K tons for the first time since 2021, thus ending a two-year rising trend. In general, consumption saw a slight decline. The pace of growth was the most pronounced in 2022 when the consumption volume increased by 4.6% against the previous year. Silver ore consumption peaked at 1.3K tons in 2014; however, from 2015 to 2024, consumption remained at a lower figure.
The revenue of the silver ore market in the United States declined to $6M in 2024, reducing by -9.2% against the previous year. This figure reflects the total revenues of producers and importers (excluding logistics costs, retail marketing costs, and retailers’ margins, which will be included in the final consumer price). Over the period under review, consumption saw a pronounced decline. The pace of growth appeared the most rapid in 2021 when the market value increased by 8% against the previous year. Over the period under review, the market attained the peak level at $8.7M in 2013; however, from 2014 to 2024, consumption remained at a lower figure.
ProductionUnited States’s Production of Silver Ores And Concentrates
For the fourth year in a row, the United States recorded growth in production of silver ores and concentrates, which increased by 0% to 1.3K tons in 2024. Overall, production saw a relatively flat trend pattern. The pace of growth was the most pronounced in 2014 when the production volume increased by 317%. As a result, production reached the peak volume of 5.3K tons. From 2015 to 2024, production growth failed to regain momentum.
In value terms, silver ore production expanded to $6.2M in 2024. Over the period under review, production continues to indicate a noticeable downturn. The pace of growth was the most pronounced in 2014 when the production volume increased by 269%. As a result, production attained the peak level of $33M. From 2015 to 2024, production growth failed to regain momentum.
ImportsUnited States’s Imports of Silver Ores And Concentrates
In 2023, silver ore imports into the United States contracted rapidly to 17 kg, which is down by -79.5% on the previous year’s figure. In general, imports saw a precipitous slump. The most prominent rate of growth was recorded in 2018 when imports increased by 17,373%. Over the period under review, imports hit record highs at 68 tons in 2014; however, from 2015 to 2023, imports failed to regain momentum.
In value terms, silver ore imports skyrocketed to $199K in 2023. Over the period under review, imports recorded a dramatic slump. The most prominent rate of growth was recorded in 2017 with an increase of 15,613%. Over the period under review, imports attained the maximum at $3.5M in 2013; however, from 2014 to 2023, imports remained at a lower figure.
Imports By Country
In 2023, Colombia (13 kg) constituted the largest silver ore supplier to the United States, accounting for a 76% share of total imports. Moreover, silver ore imports from Colombia exceeded the figures recorded by the second-largest supplier, Turkey (4 kg), threefold.
From 2013 to 2023, the average annual growth rate of volume from Colombia was relatively modest.
In value terms, Colombia ($196K) constituted the largest supplier of silver ores and concentrates to the United States, comprising 99% of total imports. The second position in the ranking was held by Turkey ($2.6K), with a 1.3% share of total imports.
From 2013 to 2023, the average annual growth rate of value from Colombia was relatively modest.
Import Prices By Country
The average silver ore import price stood at $11,693,000 per ton in 2023, increasing by 17,422% against the previous year. In general, the import price continues to indicate a significant increase. The pace of growth was the most pronounced in 2017 an increase of 469,613% against the previous year. As a result, import price reached the peak level of $15,153,331 per ton. From 2018 to 2023, the average import prices remained at a somewhat lower figure.
Prices varied noticeably by country of origin: amid the top importers, the country with the highest price was Colombia ($15,090,692 per ton), while the price for Turkey stood at $650,500 per ton.
From 2013 to 2023, the most notable rate of growth in terms of prices was attained by Canada (+33.4%).
ExportsUnited States’s Exports of Silver Ores And Concentrates
In 2024, shipments abroad of silver ores and concentrates was finally on the rise to reach 147 tons for the first time since 2021, thus ending a two-year declining trend. Overall, exports enjoyed significant growth. The pace of growth appeared the most rapid in 2014 when exports increased by 26,123%. As a result, the exports reached the peak of 4.1K tons. From 2015 to 2024, the growth of the exports remained at a lower figure.
In value terms, silver ore exports surged to $76M in 2024. In general, exports posted a strong expansion. The exports peaked at $76M in 2019; however, from 2020 to 2024, the exports remained at a lower figure.
Exports By Country
South Korea (110 tons) was the main destination for silver ore exports from the United States, with a 75% share of total exports. Moreover, silver ore exports to South Korea exceeded the volume sent to the second major destination, South Africa (34 tons), threefold. Japan (3 tons) ranked third in terms of total exports with a 2.1% share.
From 2013 to 2024, the average annual rate of growth in terms of volume to South Korea stood at +35.5%. Exports to the other major destinations recorded the following average annual rates of exports growth: South Africa (+158.2% per year) and Japan (+82.7% per year).
In value terms, South Korea ($65M) remains the key foreign market for silver ores and concentrates exports from the United States, comprising 86% of total exports. The second position in the ranking was taken by Japan ($7.7M), with a 10% share of total exports. It was followed by South Africa, with a 3.4% share.
From 2013 to 2024, the average annual rate of growth in terms of value to South Korea totaled +19.5%. Exports to the other major destinations recorded the following average annual rates of exports growth: Japan (+83.7% per year) and South Africa (+77.4% per year).
Export Prices By Country
The average silver ore export price stood at $513,725 per ton in 2024, with a decrease of -67.5% against the previous year. Over the period under review, the export price recorded a drastic downturn. The pace of growth appeared the most rapid in 2015 an increase of 64,423% against the previous year. As a result, the export price attained the peak level of $3,207,586 per ton. From 2016 to 2024, the average export prices remained at a lower figure.
There were significant differences in the average prices for the major export markets. In 2024, amid the top suppliers, the country with the highest price was Japan ($2,526,793 per ton), while the average price for exports to South Africa ($76,074 per ton) was amongst the lowest.
From 2013 to 2024, the most notable rate of growth in terms of prices was recorded for supplies to Canada (+114.4%), while the prices for the other major destinations experienced more modest paces of growth.