
Electronic data
This work was based on EHR data from Clalit, Israel’s largest healthcare provider, containing more than 5.5 million demographically heterogeneous members dating back to 200218. Data collected spanned from January 1st 2004, through December 31st 2020, including routine laboratory results, diagnoses (coded as ICD-9 codes), and demographic information. Anonymized medical records comprise members’ complete clinical registry, including lab test results and diagnoses recorded as International Classification of Diseases, Ninth Edition (ICD-9) codes19. The electronic study protocol was approved by the Clalit Helsinki committee 0195-17-COM2. This study is based on retrospective data; therefore, it was exempt from the requirement for patients’ written informed consent.
Retrospective study design
EHR data were temporarily split using a rolling-origin-update methodology18, whereby we defined three consecutive, non-overlapping follow-up periods: 2005–2010, 2010–2015, and 2015–2020. Each period started at an index date (T0) and spanned five years from the index date (Fig. 1). Since a member could be recorded during more than one period, we define an observation as a pair of members and an index date. For each period, we constructed a cohort, input the data, and tracked the follow-up outcomes (Table S7).
Fig. 1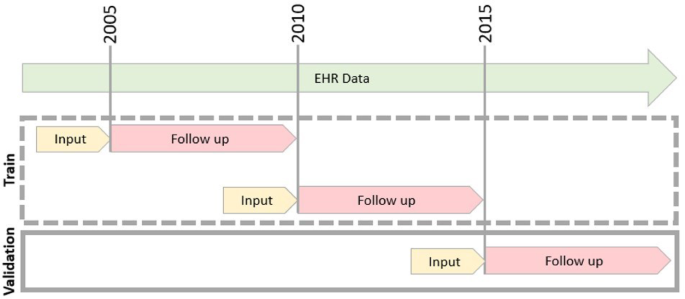
Retrospective Cohort Overview. In the first retrospective stage of the study, EHR data were split into three non-overlapping time periods. Each time period is uniquely defined by an index date (T0), marked as a gray line. Each period includes input lab test results from the previous year (marked in yellow), and a follow-up period of up to five years marked in pink. The first two time periods were used to train the model (dashed gray box), and the last period was used for validation of the model.
Eligibility was determined based on the index date (Table S4), including only members aged 40–75 years who were Clalit members at the index date. Specifically, we required valid hemoglobin (HB), platelet (PLT), and white blood cell counts (WBC) within one year before T0 to ensure recent routine bloodwork. These three lab tests were defined as our minimal criteria, indicating that individuals underwent a complete blood count, often part of a routine checkup. We excluded those with prior known liver cirrhosis or one of the predefined exclusion diagnoses (Table S8). All eligible individuals from the Clalit membership database were included, resulting in a population-based sample.
For each period, input data was defined as sex and age at index date, as well as latest lab test results: HB, PLT, WBC, Aspartate Aminotransferase (AST), Alanine Transaminase (ALT), Albumin, Bilirubin, Prothrombin Time International Normalized Ratio (PT-INR), Vitamin B12, Glucose, Hemoglobin A1c, Cholesterol, HDL cholesterol, LDL cholesterol, triglycerides, and total protein. Only the most recent lab test results within predefined thresholds (Table S9) taken one year before the index date were considered. Thresholds considered excluded nonrealistic values (e.g., harmful albumin levels) while maintaining extreme values that might indicate liver malfunctioning. We did not perform subgroup-specific data quality assessments. However, all preprocessing steps and thresholds were applied uniformly across all individuals, regardless of age, sex, or other demographic characteristics. While a known limitation of EHR-based research is potential data incompleteness, the Clalit Healthcare system integrates both care provision and insurance, and is the primary dispenser of medications under national subsidy. Additionally, healthcare enrollment is lifelong and stable, with rare transitions between providers. These factors contribute to a relatively high level of data completeness in our population (Fig. 2).
Fig. 2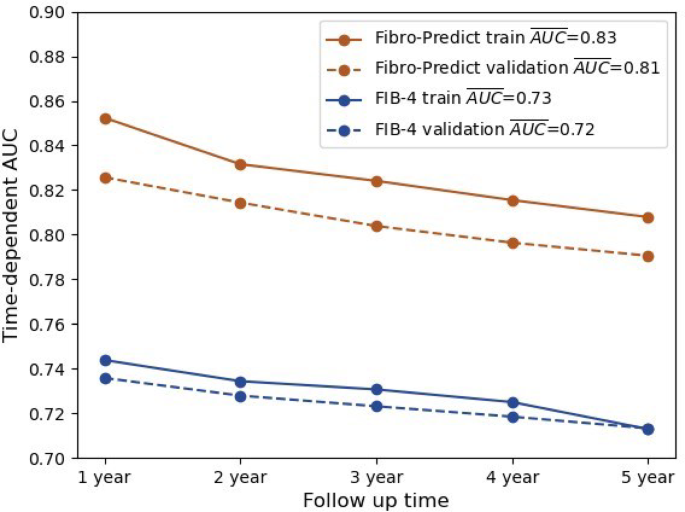
Time-Dependent AUC Retrospective Cohort. The annual (x-axis) time-dependent AUCs (y-axis) for the Fibro-Predict score (orange) and the FIB-4 score (blue) are shown. The scores were computed on the train (continuous) and the validation (dashed) cohorts. For the Fibro-Predict score, all observations were considered, whereas for the FIB-4 score, only observations with available scores were considered. The mean AUC for each line is specified in the legend.
This study determined the sample size by summing the number of individuals who met the inclusion and exclusion criteria at each index date. It’s important to note that in this context, some individuals may contribute to the sample size across multiple index dates. As a result, the final sample size, based on these eligibility criteria, consisted of 2,255,580 observations. No formal power calculation was performed; however, the large sample size of over 2 million observations provides robust statistical power for model training and validation.
To avoid overlap between follow-up periods, which could cause information leakage, where train data includes information unavailable during validation, we limited follow-up to five years post-index date. Individual follow-up ended at an observed outcome event of liver cirrhosis diagnosis (Table S10) or at a suitable censoring event, where no liver cirrhosis diagnosis occurred but can no longer be observed. Right, censoring events were exclusion diagnosis (Table S8), death, disenrollment from Clalit, or the end of the five-year follow-up period, whichever occurred first.
We note that although it is not expected to apply the right censoring for exclusion diagnosis, our goal in this work is to assist in identifying individuals at risk for liver cirrhosis who are currently underdiagnosed and not under any follow-up program. Thus, in our study, patients who are constantly monitored in the clinic, such as carriers of Hepatitis C (Table S8), are censored from our target population upon diagnosis.
Treatment data was not used as model input or explicitly tracked during model development or evaluation. Individuals with prior diagnoses indicating advanced liver disease or conditions likely requiring treatment (e.g., chronic liver disease and cirrhosis) were excluded using ICD-9 based exclusion criteria (Table S4 and S5), thereby indirectly accounting for treatment exposure.
Model training and evaluation
We constructed a machine-learning model to predict the hazard for liver cirrhosis diagnosis based on the following features: HB, PLT, WBC, AST, ALT, Albumin, Bilirubin, PT-INR, Vitamin B12, Glucose, Hemoglobin A1c, Cholesterol, HDL cholesterol, LDL cholesterol, triglycerides, total protein, days from latest blood test result (to index-date), age and sex. All laboratory values were included as continuous measures, with biologically implausible values excluded based on predefined thresholds (Table S9). Age (in years) was treated as a continuous variable and sex as a binary indicator We trained a survival analysis gradient boosting decision trees regression model on the two earlier periods. We evaluated its predictions on the latest period (using XGBoost21 with objective=” survival: cox,” estimator = 100, and base score = 1). Survival analysis models enable the prediction of time-to-event of the first diagnosis, rather than whether a diagnosis will occur within the follow-up period, making them a better fit than binary classifications for prioritizing individuals in general populations. The model was trained using time-fixed covariates derived from baseline (index date) measurements, and we did not formally assess proportional hazards; however, the use of gradient boosted Cox models allows for flexible modeling of non-linear effects without assuming strict proportional hazards. The survival models enable the inclusion of information from individuals who have not completed follow-up periods without having a known diagnosis outcome. Furthermore, unlike linear regression models, gradient-boosting decision trees with a sparsity-aware splitting algorithm20 enable us to maintain missing data without imputation and account for higher-order nonlinear interactions between variables. Therefore, no imputation was applied, missingness was handled internally by the model. Furthermore, due to the use of tree-based models, no transformation or rescaling was applied to the data. Prediction outcomes were evaluated using C/D ROC annually, and the results were concluded using AUCs to assess annual performance. All measures were compared between the training and validation periods to analyze performance on unseen data and alternative FIB-4 scoring.
We did not examine or adjust for heterogeneity in model performance or parameter estimates across clusters such as geographic regions or healthcare sites. All training data were obtained from a single national healthcare provider (Clalit) using unified coding and data standards. As such, no clustering structure was imposed during model development, and the model was trained and validated as a single pooled cohort. Although the outcome of interest—liver cirrhosis diagnosis—is relatively rare in the dataset, no class imbalance correction methods (e.g., reweighting or resampling) were applied. The use of a Cox survival model allowed the algorithm to incorporate time-to-event and censoring information directly, mitigating the need for binary classification thresholding or label balancing. We note that death prior to cirrhosis diagnosis was treated as a right-censoring event rather than as a competing risk, consistent with standard Cox model assumptions; as such, competing risks were not explicitly modeled.
Following retrospective evaluations, we trained a new model with the same parameters on all three EHR periods to predict prospective cohorts. This was based on the assumption that the validation set, which comprised the last five years of data, might contain underlying information that affects model performance (e.g., changes due to COVID-19 or regulations).
Prospective clinical cohort
External prospective validation was performed on a clinical cohort from the Afula subdistrict (Fig. 3). The latest diagnoses, lab test results, and demographics data were received on December 8, 2021, consisting of 90,136 individuals who passed the inclusion-exclusion criteria. Unlike in the retrospective cohorts, in the prospective cohort, the latest lab test results were considered regardless of their date. A predicted risk was computed for all individuals using the EHR-based model, and FIB-4 scores were obtained when possible, provided AST and ALT levels were available. We selected the highest-risk individuals using a 3:1 ratio (Fibro-Predict: FIB-4) for invitation, with no overlap between groups. This ensured that each individual’s origin was attributed to a single risk score. Computed risk scores were concealed during the clinical trial to ensure a double-blinded study. All individuals were contacted and invited for hepatology consultation and noninvasive fibrosis tests, and morbidity cases were recorded. Recruitment for the study began on April 19, 2022, and concluded on August 24, 2022. Participants who arrived at the clinic underwent TE exams, had their height and weight measured, and completed the AUDIT questionnaire. Liver stiffness was measured in kPa, steatosis grade was measured via CAP score (results in Table S6), and advanced liver fibrosis was diagnosed at kPa > 12. Emek Medical Center Helsinki Committee 0208-20-EMC approved the clinical cohort and the entire study protocol. All authors had access to the study data and reviewed and approved the final manuscript.
Fig. 3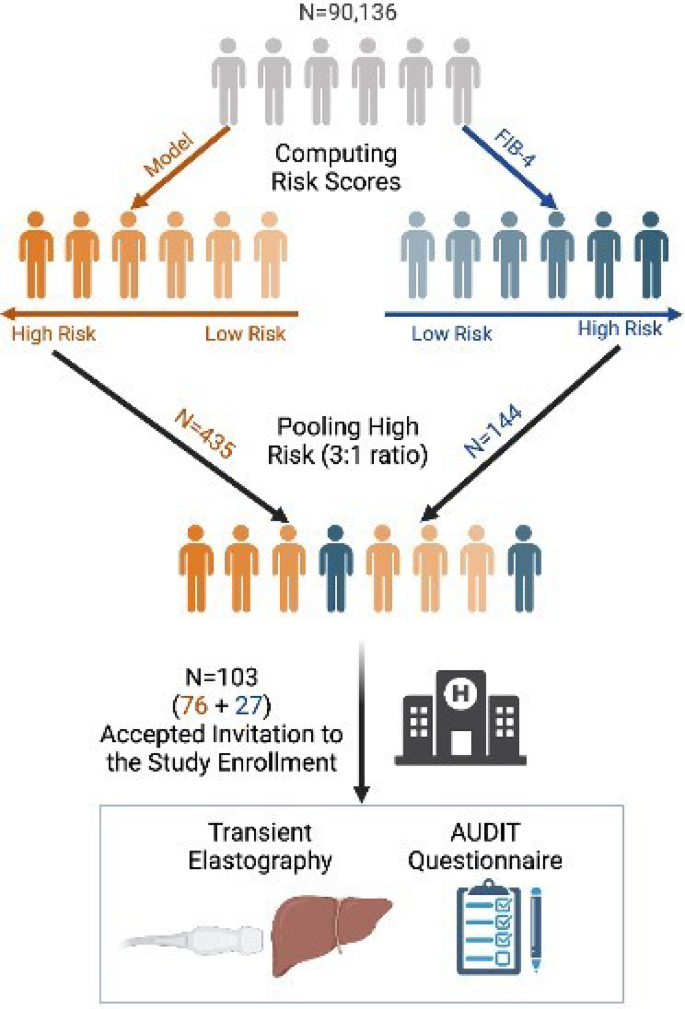
Prospective Cohort Overview. The latest age, gender, and laboratory test results were obtained from 115,211 Afula subdistrict’s Clalit members, 90,136 of whom passed the inclusion-exclusion criteria. The model predicted, and FIB-4 risks were computed for all individuals, identifying individuals at low to high risk for each risk category (high-risk individuals displayed as darker and low-risk individuals as lighter). The highest-risk individuals from each group were pooled together in a 3:1 ratio, based on the model and FIB-4 origin. All 579 pooled individuals were contacted and invited to the clinic for enrollment in the study. However, only 103 individuals arrived at the clinic to undergo transient elastography and complete AUDIT questionnaires. Created with Bio Render.