

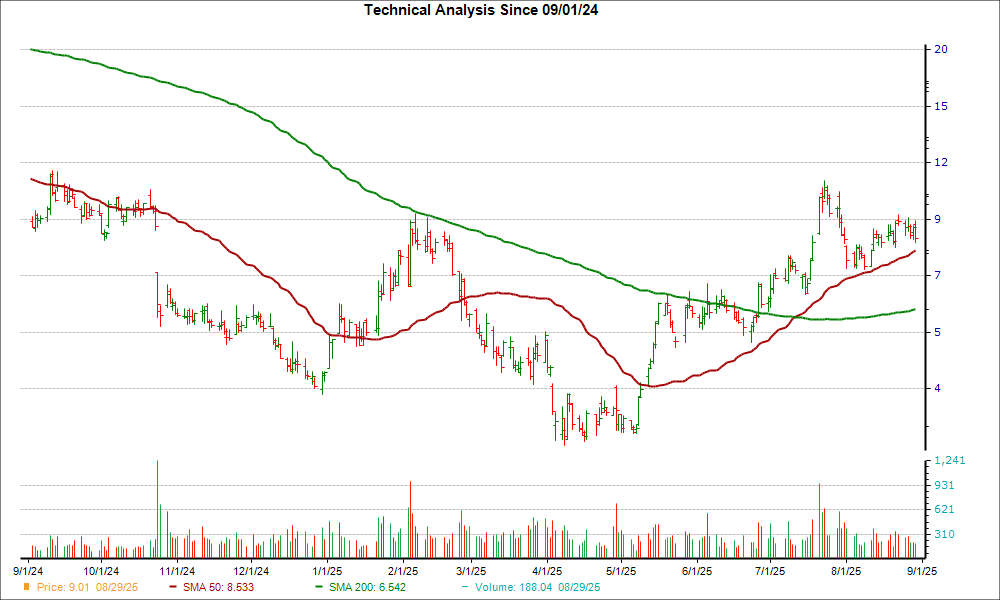
Beyond, Inc. reached a significant support level, and could be a good pick for investors from a technical perspective. Recently, BBBY’s 50-day simple moving average broke out above its 200-day moving average; this is known as a “golden cross.”
Considered an important signifier for a bullish breakout, a golden cross is a technical chart pattern that’s formed when a stock’s short-term moving average breaks above a longer-term moving average; the most common crossover involves the 50-day and the 200-day, since bigger time periods tend to form stronger breakouts.
There are three stages to a golden cross. First, there must be a downtrend in a stock’s price that eventually bottoms out. Then, the stock’s shorter moving average crosses over its longer moving average, triggering a positive trend reversal. The third stage is when a stock continues the upward momentum to higher prices.
This kind of chart pattern is the opposite of a death cross, which is a technical event that suggests future bearish price movement.
BBBY could be on the verge of a breakout after moving 10.4% higher over the last four weeks. Plus, the company is currently a #2 (Buy) on the Zacks Rank.
Once investors consider BBBY’s positive earnings outlook for the current quarter, the bullish case only solidifies. No earnings estimate has gone lower in the past two months compared to 2 revisions higher, and the Zacks Consensus Estimate has increased as well.
Investors should think about putting BBBYon their watchlist given the ultra-important technical indicator and positive move in earnings estimates.