
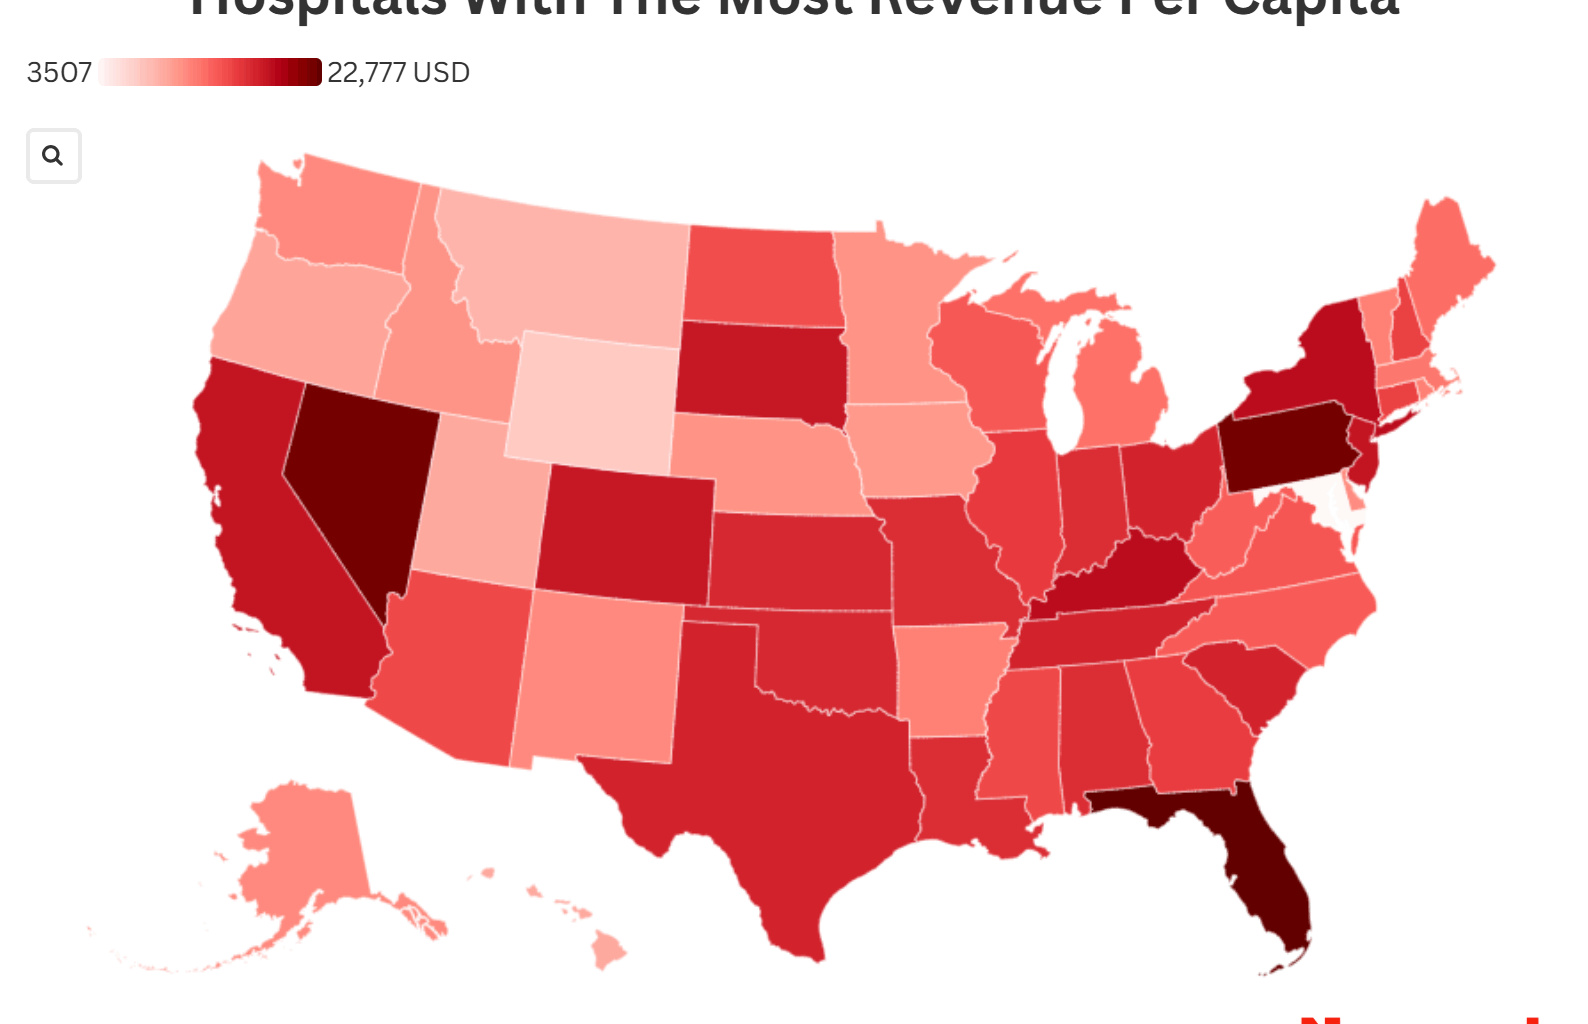
Newsweek has created a map showing which hospitals have the highest patient revenue per capita, after new analysis by a personal injury firm.
Florida came out on top at the top with $22,776.55 per patient and Maryland at the bottom with $3,506.89—a gap of more than $19,000 between the highest- and lowest-ranked states, according to Bader Scott, which based its findings on hospital gross patient revenue and state population figures.
Why It Matters
The state-level differences in gross patient revenue per person highlight wide variation in hospital billing, utilization and market structure across the United States—topics that influence affordability and access to care.
Variations in hospital and health care prices have been documented by health care researchers and news organizations as a major driver of overall U.S. health spending and household medical bills.
In 2023, the United States had the most expensive health care in the world, both in total cost and per capita spending, according to data from the Organisation for Economic Co-operation and Development.
What To Know
Complete state rankings by hospital revenue per capita:
Florida—$22,776.55Pennsylvania—$21,955.01Nevada—$21,907.89New York—$18,606.96Kentucky—$18,585.63New Jersey—$18,079.27California—$18,042.29South Dakota—$17,873.49Colorado—$17,862.88Tennessee—$17,288.17Texas—$17,120.96South Carolina—$17,104.28Ohio—$16,910.33Kansas—$16,824.26Oklahoma—$16,811.45Missouri—$16,572.75Indiana—$16,413.29Louisiana—$16,389.14Alabama—$16,261.18Illinois—$15,493.47Georgia—$15,407.44New Hampshire—$15,256.03Connecticut—$15,109.57Mississippi—$14,807.07Arizona—$14,744.83North Dakota—$14,480.33Virginia—$13,868.34Wisconsin—$13,849.03North Carolina—$13,672.12West Virginia—$13,499.87Maine—$12,643.46Michigan—$12,486.10Massachusetts—$12,244.86Rhode Island—$11,699.67Vermont—$11,660.75Arkansas—$11,559.25New Mexico—$11,183.80Alaska—$11,117.41Washington—$11,084.03Delaware—$10,912.00Minnesota—$10,670.05Nebraska—$10,597.66Idaho—$10,517.74Iowa—$10,326.83Oregon—$9,608.17Utah—$9,263.48Hawaii—$9,185.08Montana—$8,486.93Wyoming—$7,008.90Maryland—$3,506.89
The Bader Scott analysis ranked states by dividing each state’s aggregate gross patient revenue for non-federal, short-term, acute care hospitals (sourced from the American Hospital Directory) by the state population (sourced from the U.S. Census Bureau).
The firm reports using each hospital’s most recent Medicare cost report and that the data set was last updated for the year ending December 31, 2023.
What People Are Saying
Bader Scott spokesperson Seth Bader said: “These substantial variations in hospital revenue per capita raise important questions about health care pricing, utilization, and access across different states. The nearly $20,000 gap between the highest and lowest states points to major differences in how health care systems operate across the country.
“States with higher hospital revenue relative to population may be experiencing a combination of factors, including higher medical costs, more intensive utilization of services, or different approaches to billing and reimbursement.”
What Happens Next
The Bader Scott rankings are likely to prompt additional scrutiny from researchers, consumer advocates and policymakers interested in why hospital revenue per capita differs so sharply by state and what that means for affordability and access.