
This section presents the numerical results for the streamlines and isotherms to evaluate the influence of rotating cylinders on flow circulation and thermal performance in a square cavity filled with \(Cu – Water\)nanofluid. The study is carried out using COMSOL Multiphysics 6.3. The governing dimensionless parameters considered in the analysis include the Reynolds number is set at \(\operatorname{Re} =600\), while the rotational Reynolds number \(({\operatorname{Re} _\omega })\)is varied as 0, 50, and 100 to investigate the impact of cylinder rotation on the flow structure and heat transfer characteristics. Additionally, two volume fractions of nanoparticles \((\phi =1.5\% )\) and \((\phi =3\% )\) are considered to assess the influence of nanoparticle loading on convection enhancement. The Prandtl number is kept constant at \(\Pr =4.1588\), corresponding to the \(Cu – Water\)nanofluid properties. Four distinct rotation cases are studied: For each case, the flow structures are visualized using streamlines, while the temperature distribution is represented by isotherms. The effects of varying rotational speed and nanoparticle concentration are clearly observed in the graphical outputs.
Case 1: all the cylinder rotating clockwise
Figures 2 and 3 illustrate the streamline distributions with rotational Reynolds numbers set at \({\operatorname{Re} _\omega }=0,50,{\text{ and }}100\), and nanoparticle volume fractions of \(\phi =3\%\) and \(\phi =1.5\%\) respectively. In Fig. 2a \(({\operatorname{Re} _\omega }=0)\)a single large primary vortex dominates the cavity, exhibiting moderate circulation. As the rotation intensifies to \({\operatorname{Re} _\omega }=50\)and 100 (Fig. 2b and c), strong secondary vortices develop around the cylinders, indicating enhanced momentum transfer due to rotation. In comparison, Fig. 3\((\phi =1.5\% )\) shows smoother and more symmetric flow structures at \({\operatorname{Re} _\omega }=0\), with weaker recirculation. Although vortex formation increases with \({\operatorname{Re} _\omega }\), the strength and complexity remain lower than in the 3% case. This comparison clearly demonstrates that a higher nanoparticle volume fraction amplifies rotational effects, leading to more confined and intensified vortical regions, thereby enhancing convective mixing within the cavity. Figures 4 and 5 show the isotherm contours, for \(\phi =3\%\) (Fig. 4) and \(\phi =1.5\%\) (Fig. 5). In Fig. 4a, with \({\operatorname{Re} _\omega }=0\), the flow is mainly conduction-dominated, and the isotherms appear smooth, horizontal, and layered, showing limited fluid motion. As we move to Fig. 4b \({\operatorname{Re} _\omega }=50\)and Fig. 4c \({\operatorname{Re} _\omega }=100\), the isotherm patterns become more curved, compressed, and circulate around the cylinders, indicating a strong shift toward convection-dominated heat transfer. Physically, this rising trend in isotherm distortion occurs because increasing rotational Reynolds number injects more kinetic energy into the fluid, which strengthens circulation and mixing. The rotating cylinders drag nearby fluid, disturbing the thermal boundary layers and enhancing convective transport. Additionally, at \(\phi =3\%\)the presence of more nanoparticles improves the thermal conductivity of the nanofluid, supporting faster heat diffusion. In contrast, Fig. 5\((\phi =1.5\% )\)shows the same trend with \({\operatorname{Re} _\omega }\), but the isotherm lines are more spread out and less intense due to the lower nanoparticle concentration, which results in weaker thermal conductivity and reduced heat transfer performance.
Case 2. C1 static, C2 and C3 rotating clockwise
Figures 6 and 7 highlight the streamline distributions for nanoparticle volume fractions \(\phi =3\%\)and \(\phi =1.5\%\) respectively. In both cases, increasing \({\operatorname{Re} _\omega }\) from 0 to 100 enhances vortex formation near the rotating cylinders. In Fig. 6\({\text{(}}\phi =3\% )\), strong secondary vortices develop around C2 and C3 at higher \({\operatorname{Re} _\omega }\), while the region near the static C1 remains less active. The higher nanoparticle concentration results in tighter and stronger vortices due to increased momentum diffusion. In Fig. 7\((\phi =1.5\% )\)similar vortex trends are observed, but with noticeably weaker circulation and more diffused streamlines. Physically, the absence of rotation in C1 reduces shear generation in its vicinity, while the rotating C2 and C3 dominate the flow field, driving asymmetry and enhanced motion on their side of the cavity. The comparison shows that higher \(\phi\) and cylinder rotation enhances convective mixing, while the static C1 locally suppresses flow intensity. Figures 8 and 9 show the isotherm distributions when Cylinder C1 is static, and C2 and C3 rotate clockwise at \(\phi =3\%\) and \(\phi =1.5\%\), respectively. In Fig. 8\({\text{(}}\phi =3\% )\),the presence of more nanoparticles improves the fluid’s thermal conductivity, which helps transfer heat more efficiently. The rotating C2 and C3 stir the fluid, causing stronger mixing and tighter thermal layers near their surfaces. However, near the static C1, the absence of rotation weakens local fluid motion, resulting in wider isotherms and reduced heat transport. In Fig. 9\((\phi =1.5\% )\), similar changes occur but are less pronounced. The lower nanoparticle volume fraction leads to weaker thermal conductivity, and the isotherms are broader, indicating less efficient heat distribution. Physically, rotation injects angular momentum, which enhances convection. Meanwhile, the static C1 creates a low-shear region where heat transfer remains mainly conduction-dominated. The uneven motion results in asymmetric heat dispersion across the cavity.
Case 3. C2 static, C1 and C3 rotating clockwise
Figures 10 and 11 demonstrate the streamline graphs. In Fig. 10\({\text{(}}\phi =3\% )\), higher nanoparticle concentration and rotation result in compact, stronger vortices, especially near C1 and C3. The stationary C2 interrupts the central flow, causing asymmetry and splitting the circulation zones. In Fig. 11\((\phi =1.5\% )\), although the rotational effect still promotes circulation near C1 and C3, the lower φ results in weaker momentum diffusion, leading to broader, less intense vortices. Physically, increasing \({\operatorname{Re} _\omega }\) injects more angular momentum into the system, intensifying fluid rotation around moving cylinders, while the static center cylinder acts as a barrier, weakening flow connection between the top and bottom zones. Figures 12 and 13 show the isotherm (temperature) distributions when C2 is static, and C1 and C3 rotate clockwise. In Fig. 12\({\text{(}}\phi =3\% )\), increasing \({\operatorname{Re} _\omega }\) causes noticeable bending and compression of isotherms around the rotating C1 and C3, indicating enhanced convective heat transfer. The higher nanoparticle concentration improves thermal conductivity, making heat spread more effectively throughout the cavity. However, the static center cylinder (C2) weakens flow circulation near the middle, creating a less active thermal zone. This disrupts the continuity of thermal transport across the cavity. In Fig. 13\((\phi =1.5\% )\), similar trends appear but with broader and more spaced isotherms. The reduced nanoparticle content lowers the effective thermal conductivity, and weaker rotational energy limits mixing. As a result, heat remains more localized, and the transfer becomes less efficient. Physically, increasing the rotational Reynolds number intensifies shear and momentum near rotating surfaces, which enhances convective heat transfer. Moreover, the central static cylinder (C2) breaks the symmetry of the cavity, blocking the thermal pathway between the top and bottom rotating zones. This leads to thermal isolation in the middle and shifts most of the heat exchange activity toward the cavity’s upper and lower regions.
Case 4. C3 static, C1 and C2 rotating clockwise
Figures 14 and 15 depict the flow patterns. In Fig. 15\((\phi =1.5\% )\), similar flow structure is seen, but they are softer and wider because the lower \(\phi\) gives weaker thermal and momentum effects. Physically, the rotating C1 and C2 energize the upper flow field, while the static C3 acts as a local barrier. The inlet (top left) supports circulation near C1, while the outlet (bottom right) helps remove flow near the weakened zone around C3, adding to the asymmetry. Figures 16 and 17 present the isotherm distributions when C3 is static, and C1 and C2 rotate clockwise. In Fig. 16\({\text{(}}\phi =3\% )\), the higher nanoparticle content improves thermal conductivity, allowing stronger temperature gradients and better heat spreading. In Fig. 17\((\phi =1.5\% )\), this effect is weaker, with broader, less intense isotherms due to reduced heat-carrying capacity. Physically, rotation injects kinetic energy into the flow, disturbing thermal boundary layers and promoting convection near moving cylinders. The static C3 lacks this effect and forms a relatively stagnant region, reducing local heat transfer. Additionally, the inlet at the top-left introduces warm fluid near the rotating C1–C2, while the outlet at the bottom-right helps discharge cooler fluid near static C3 creating a strong vertical thermal gradient and asymmetry in the temperature field.
Numerical validation and grid independency test
Table 3 represents the detailed grid independence test at \(\operatorname{Re} =600\), \({\operatorname{Re} _\omega }=100\), and \(\phi =0.015\)to ensure the reliability and accuracy of our numerical simulations. The test includes a range of mesh densities from “Extremely coarse” to “Extremely fine,” highlighting convergence behavior in Nusselt numbers for each cylinder.
Furthermore, to validate our numerical model, we have added a comparative Table 4 showing the Nusselt number values at different rotational Reynolds number against benchmark results from Ref26. This confirms strong agreement between our results and the reference study, thus reinforcing the validity of our model.
Table 3 The grid independence test at \(\operatorname{Re} =600\), \({\operatorname{Re} _\omega }=100\) and \(\phi =0.15\%\).Table 4 Comparison of Nusselt number.Fig. 2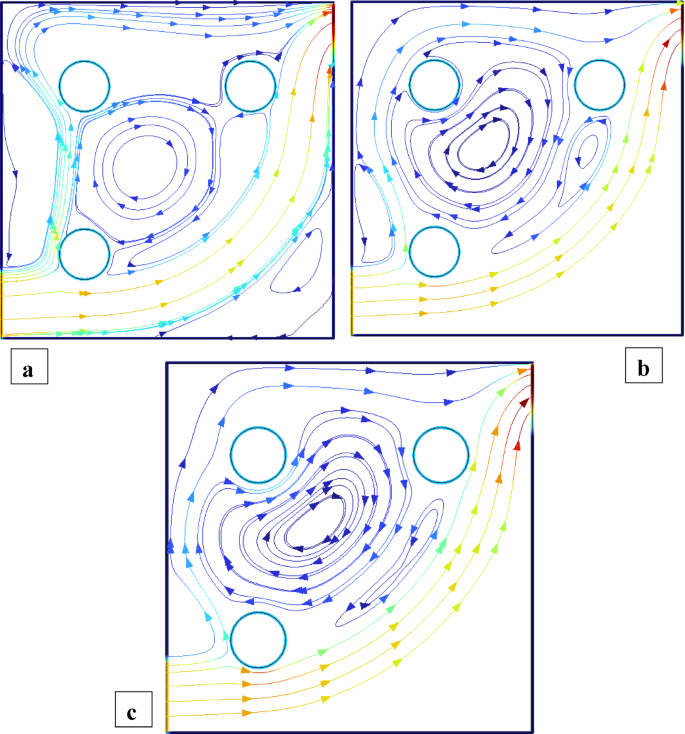
Streamlines distribution when all the cylinders are rotating and \(\operatorname{Re} =600,{\text{ }}\phi =3\%\).
Fig. 3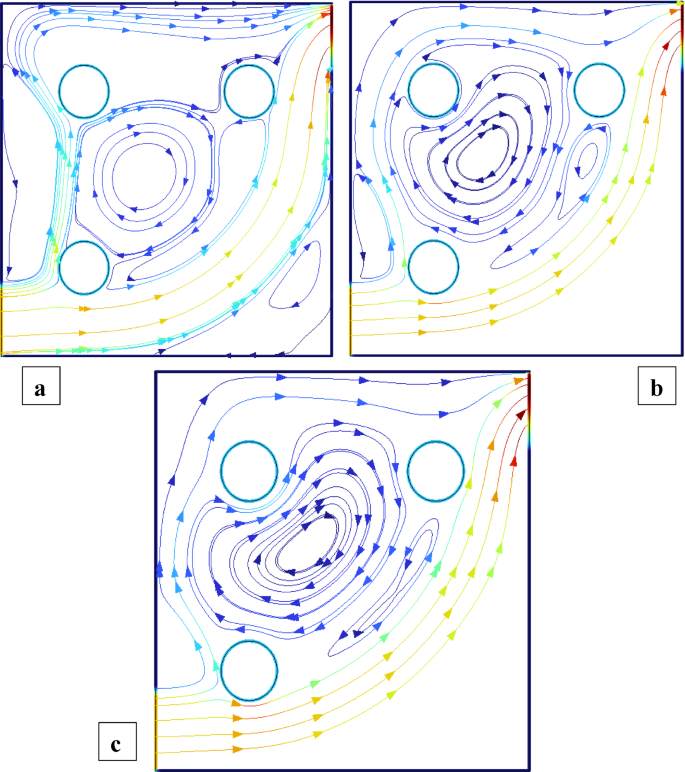
Streamlines distribution when all the cylinders are rotating and \(\operatorname{Re} =600,{\text{ }}\phi =1.5\%\).
Fig. 4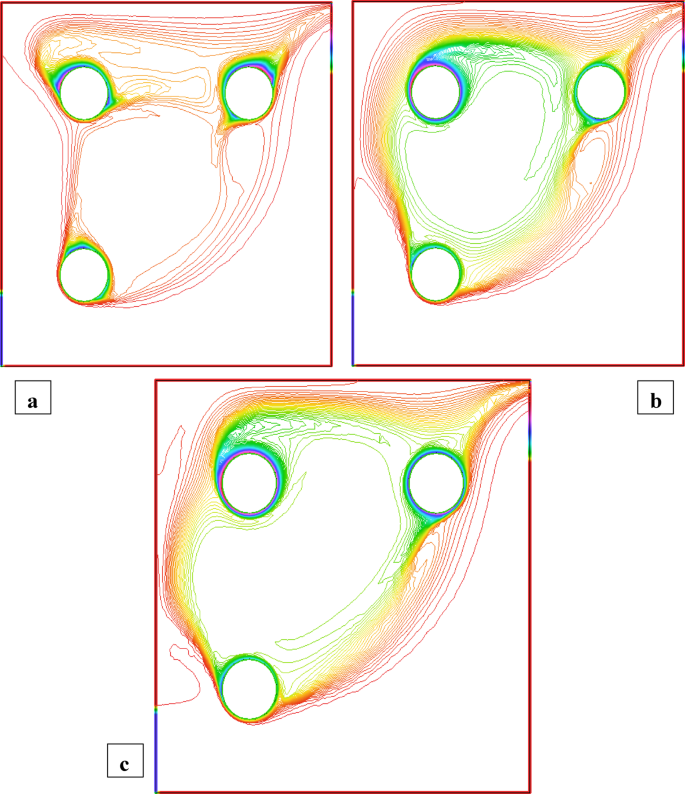
Temperature distribution when all the cylinders are rotating and \(\operatorname{Re} =600,{\text{ }}\phi =3\%\).
Fig. 5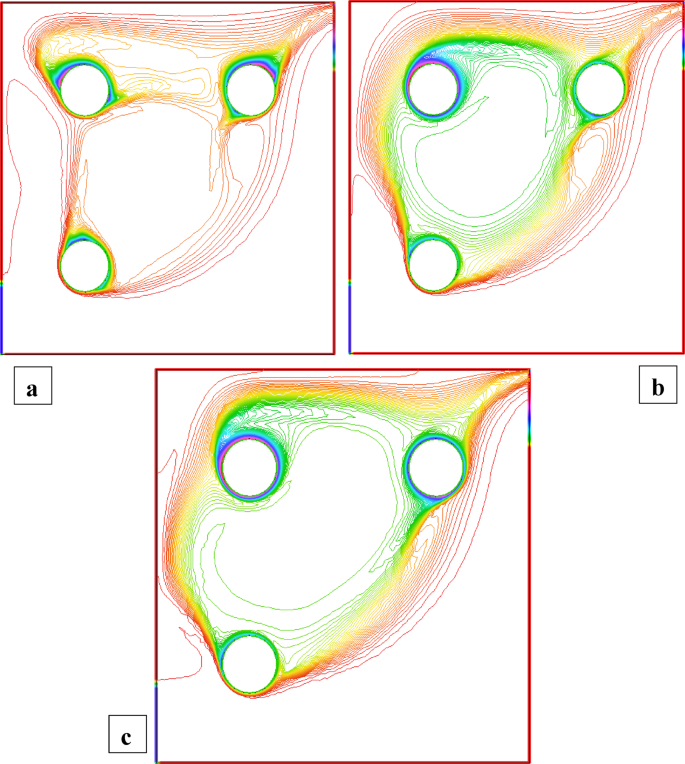
Temperature distribution when all the cylinders are rotating and \(\operatorname{Re} =600,{\text{ }}\phi =1.5\%\).
Fig. 6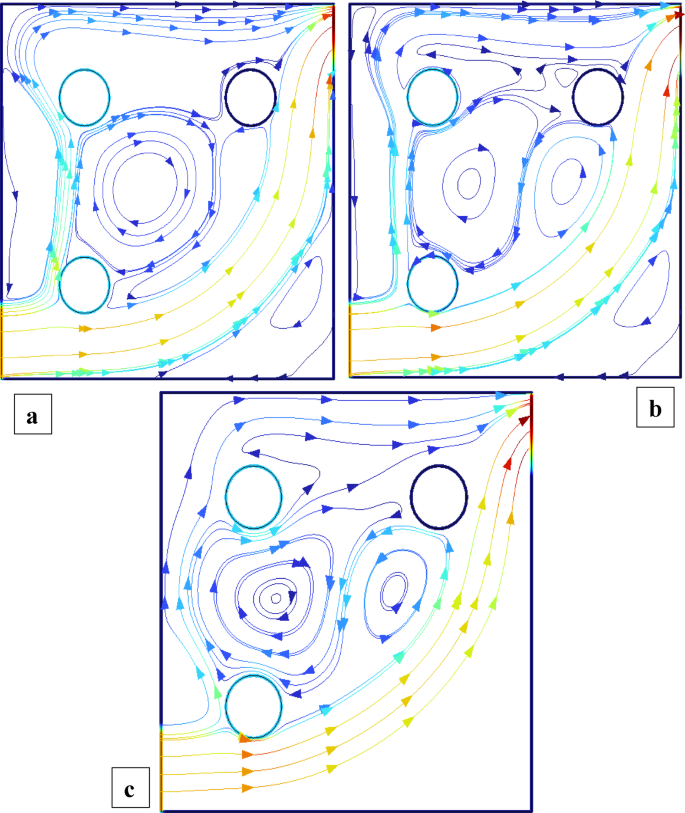
Streamlines distribution when C1 static and C2 = C3 are rotating, and \(\operatorname{Re} =600,{\text{ }}\phi =3\%\).
Fig. 7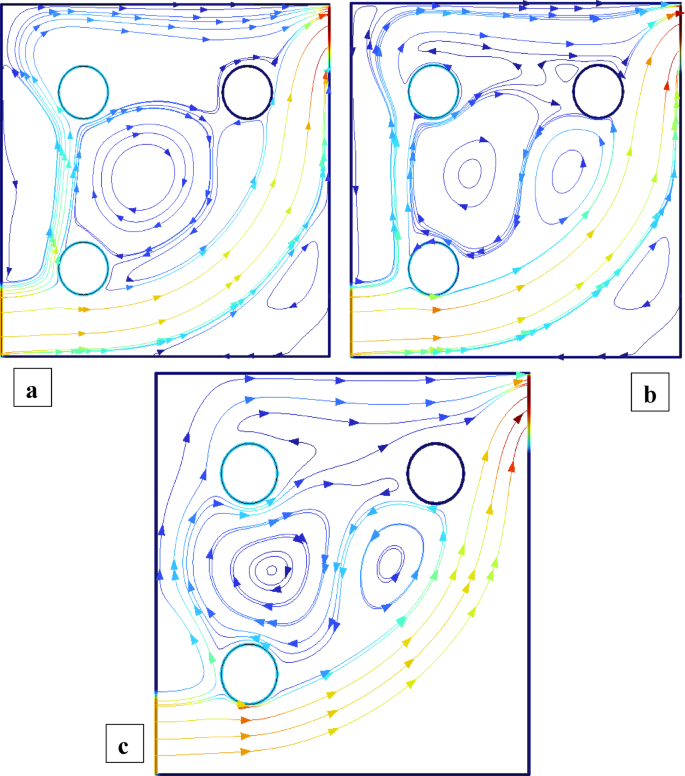
Streamlines distribution when C1 static and C2 = C3 are rotating, and \(\operatorname{Re} =600,{\text{ }}\phi =1.5\%\).
Fig. 8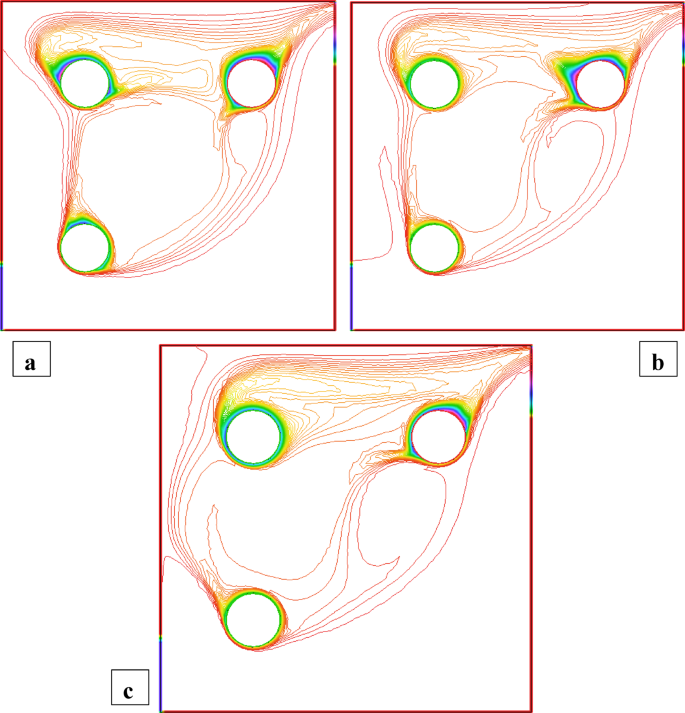
Temperature distribution when C1 static and C2 = C3 are rotating, and \(\operatorname{Re} =600,{\text{ }}\phi =3\%\).
Fig. 9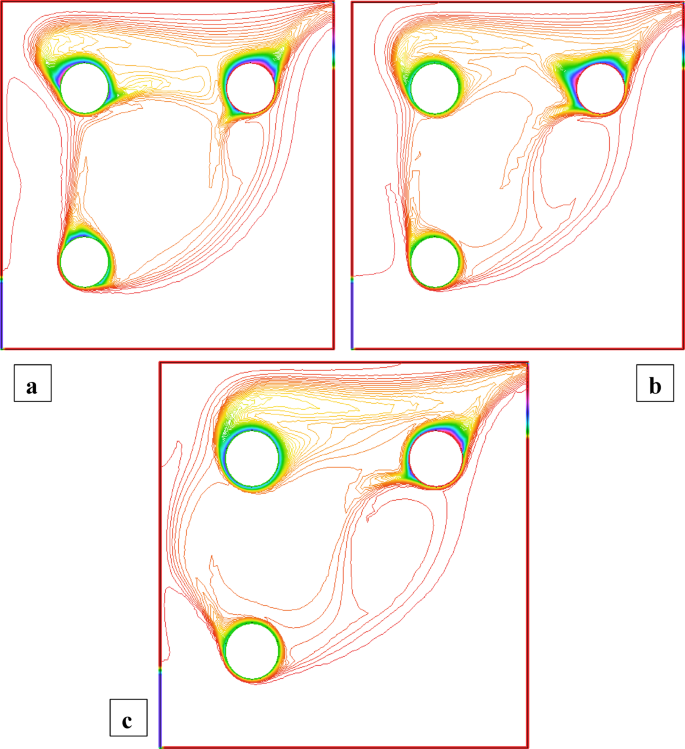
Temperature distribution when C1 static and C2 = C3 are rotating, and \(\operatorname{Re} =600,{\text{ }}\phi =1.5\%\).
Fig. 10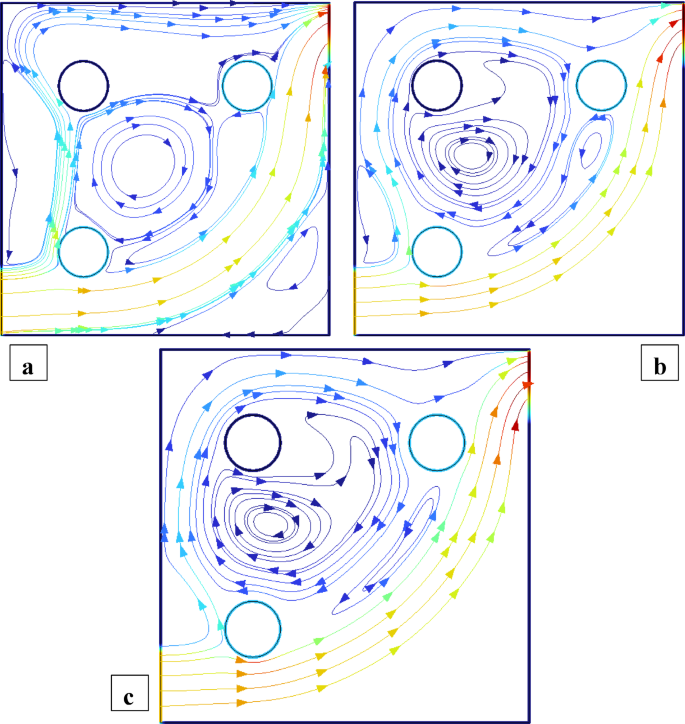
Streamlines distribution when C2 static and C1 = C3 are rotating, and \(\operatorname{Re} =600,{\text{ }}\phi =3\%\).
Fig. 11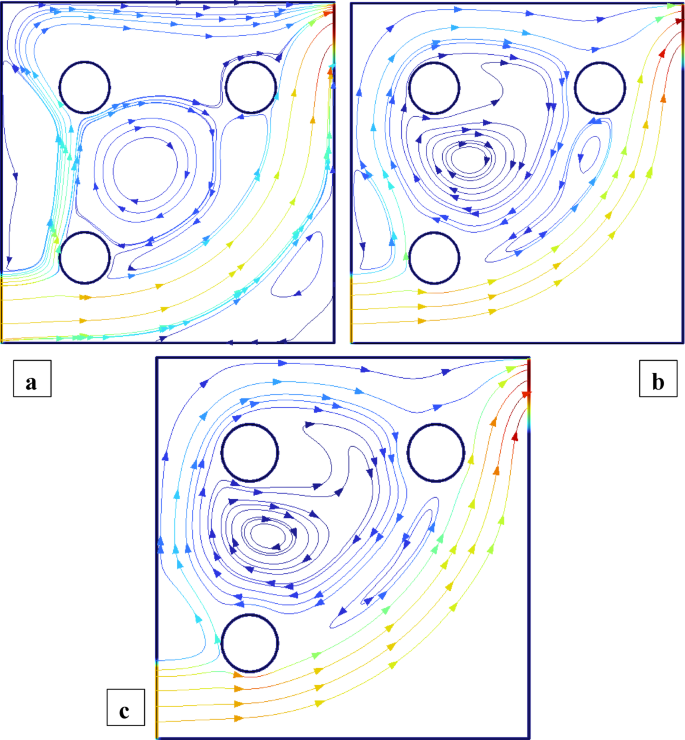
Streamlines distribution when C2 static and C1 = C3 are rotating, and \(\operatorname{Re} =600,{\text{ }}\phi =1.5\%\).
Fig. 12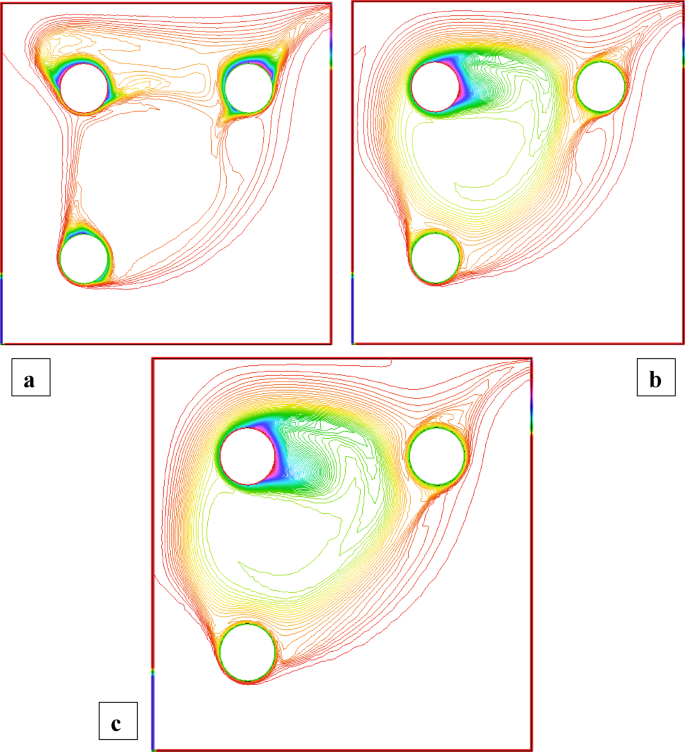
Temperature distribution when C2 static and C1 = C3 are rotating, and \(\operatorname{Re} =600,{\text{ }}\phi =3\%\).
Fig. 13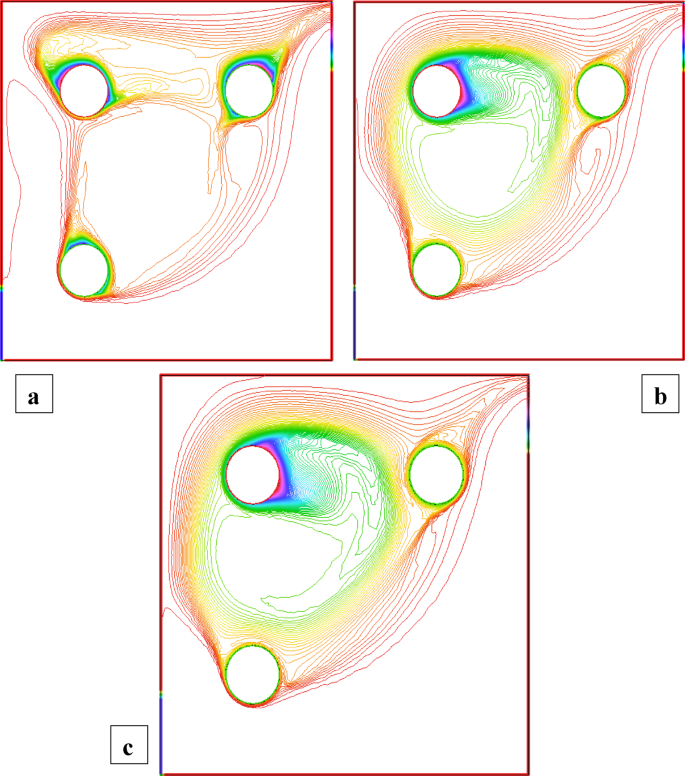
Temperature distribution when C2 static and C1 = C3 are rotating, and \(\operatorname{Re} =600,{\text{ }}\phi =1.5\%\).
Fig. 14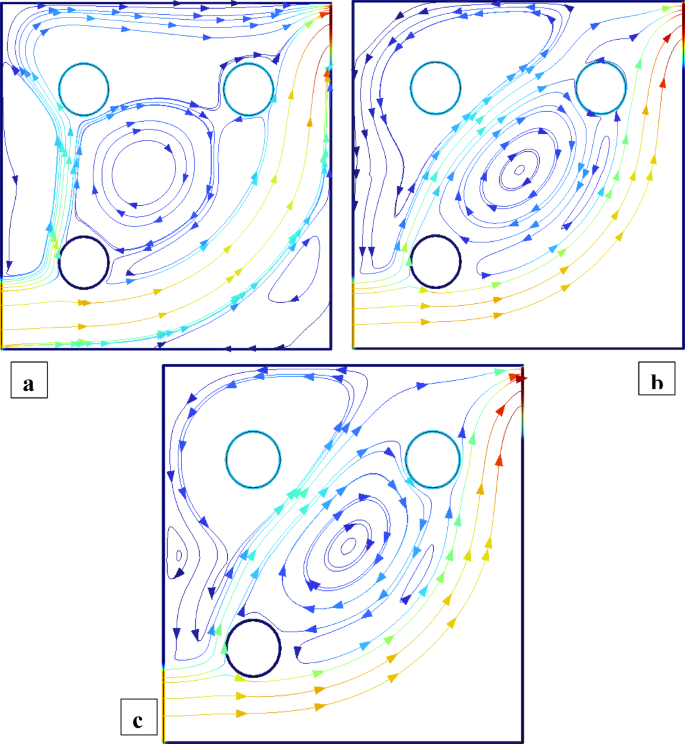
Streamlines distribution when C3 static and C1 = C2 are rotating, and \(\operatorname{Re} =600,{\text{ }}\phi =3\%\).
Fig. 15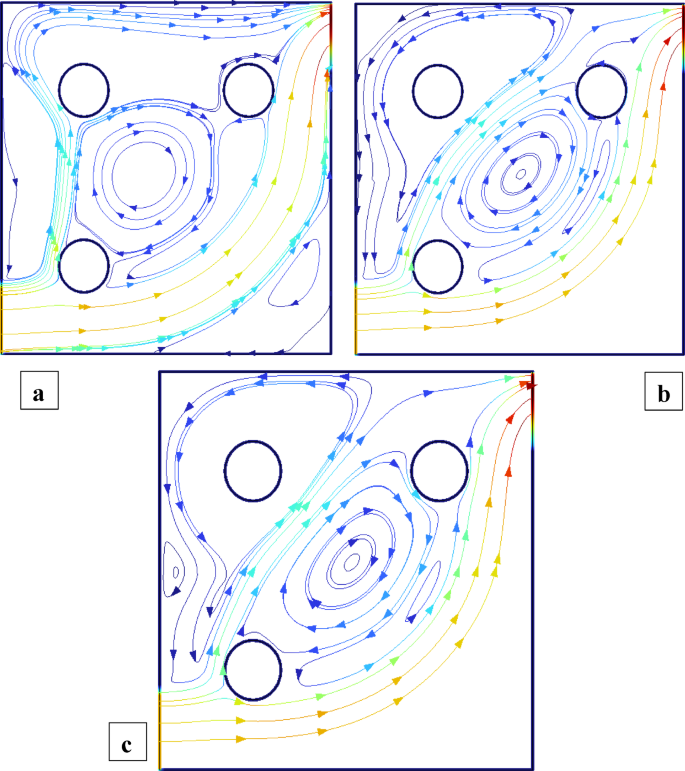
Streamlines distribution when C3 static and C1 = C3 are rotating, and \(\operatorname{Re} =600,{\text{ }}\phi =1.5\%\).
Fig. 16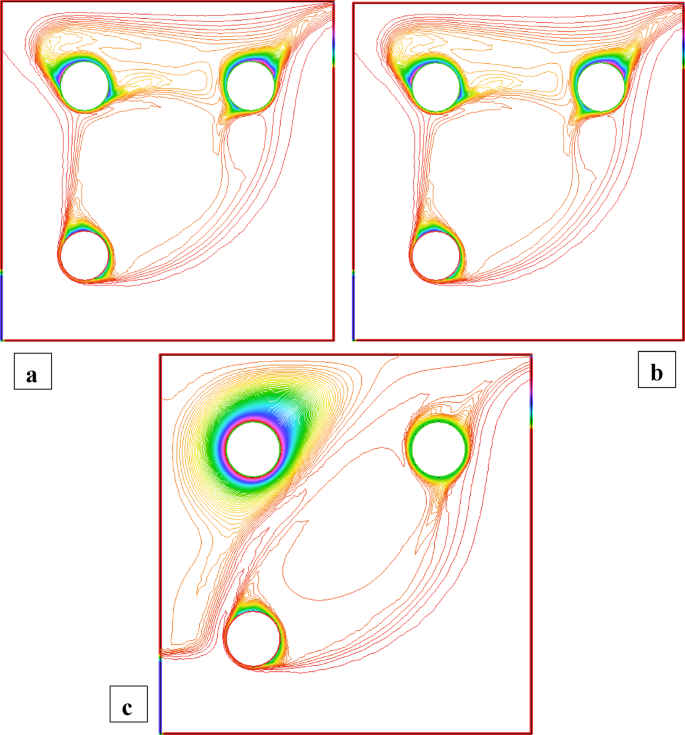
Temperature distribution when C3 static and C1 = C2 are rotating, and \(\operatorname{Re} =600,{\text{ }}\phi =3\%\).
Fig. 17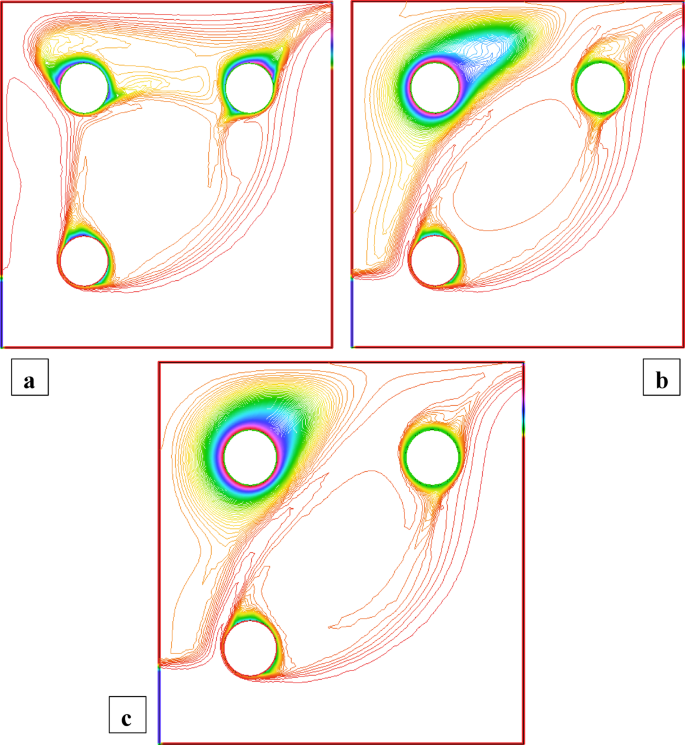
Temperature distribution when C3 static and C1 = C2 are rotating, and \(\operatorname{Re} =600,{\text{ }}\phi =1.5\%\).
Figures 18, 19, 20, 21 present a comparative analysis of the average Nusselt numbers associated with each rotating cylinder under various rotational Reynolds numbers and nanoparticle volume fractions. These bar graphs collectively illustrate the thermal performance across different scenarios by displaying the Nusselt number for each cylinder. Specifically, Nu₁, Nu₂, and Nu₃ represent the Nusselt numbers for cylinders C1, C2, and C3 at a nanoparticle volume fraction of 3%, while Nu₁₂, Nu₂₁, and Nu₃₂₁ correspond to the same cylinders at 1.5%. The color scheme represents the rotational Reynolds number, with yellow indicating \({\operatorname{Re} _\omega }=0\), green for \({\operatorname{Re} _\omega }=50\), and red for \({\operatorname{Re} _\omega }=100\).
Figure 18 illustrates the average Nusselt number for all three cylinders when they rotate clockwise. Among all cases, the highest Nusselt number is observed at \({\operatorname{Re} _\omega }=100\)for \(\phi =3\%\), highlighting the significant enhancement in convective heat transfer due to intensified and symmetric circulation induced by collective rotation. This configuration increases shear around each cylinder, thinning the thermal boundary layers and improving heat exchange. In contrast, the lowest Nusselt number is recorded for Cylinder 2 at \(\phi =1.5\%\), where weaker nanoparticle loading results in reduced thermal diffusion and weaker rotational effects. Figure 19 shows the scenario where C1 is static and C2 and C3 rotate. Here, the Nusselt number of C1 remains relatively low, especially for \({\operatorname{Re} _\omega }=0\), because of reduced local flow agitation and weaker vortex development. In contrast, C2 and C3, being active rotors, show a substantial increase in Nusselt number with higher \({\operatorname{Re} _\omega }\), particularly at \(\phi =3\%\), highlighting the dominance of rotational shear in enhancing local heat transfer. In Fig. 19, at \(\phi =3\%\), the maximum Nusselt number \((Nu \approx 24.06)\) occurs at C3 for \({\operatorname{Re} _\omega }=100\), attributed to the strong rotational mixing and improved thermal conductivity of the nanofluid. Meanwhile, the stationary C1 consistently exhibits lower Nusselt numbers due to reduced fluid agitation near its surface. From Fig. 20, for \(\phi =3\%\), the highest Nusselt number \((Nu \approx 21.04)\) is observed at C3 for \({\operatorname{Re} _\omega }=100\), highlighting intensified convective activity around the rotating lower cylinder. Interestingly, C2 consistently shows the lowest heat transfer rates, particularly at higher \({\operatorname{Re} _\omega }\), with Nu dropping to nearly 5.0. This is attributed to the central static cylinder acting as a thermal and flow obstruction, suppressing momentum exchange and vortex formation near its surface. At \(\phi =1.5\%\), the overall Nusselt numbers are lower due to reduced thermal conductivity of the nanofluid. In Fig. 21, The highest Nusselt number is observed for Cylinder C3 at \(\phi =3\%\) and \({\operatorname{Re} _\omega }=100\), reaching a value of 16.405. In contrast, the lowest Nusselt number, 4.1684, occurs for Cylinder C2 at \(\phi =1.5\%\) and \({\operatorname{Re} _\omega }=50\). This reduction stems from weakened thermal conductivity at lower nanoparticle concentration, compounded by asymmetric flow disruption near C2 due to differential cylinder rotation.
Fig. 18
Comparisin of Nusselt number when C1 = C2 = C3 = rotating, and \(\phi =3\% {\text{ and }}\phi =1.5\%\).
Fig. 19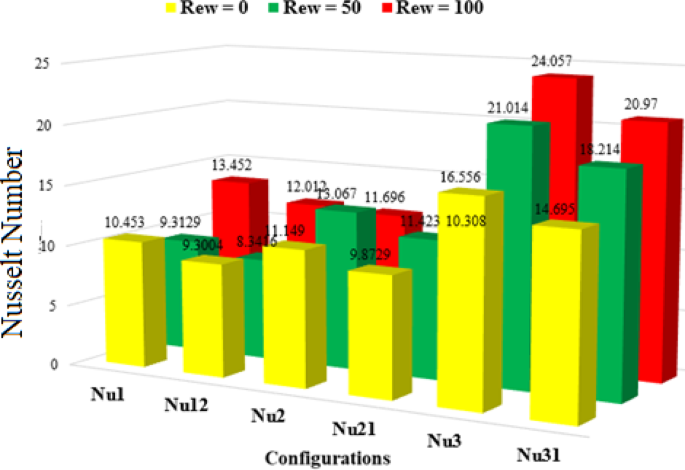
Comparisin of Nusselt number when C1 = 0, C2 = C3 = rotating, and \(\phi =3\% {\text{ and }}\phi =1.5\%\).
Fig. 20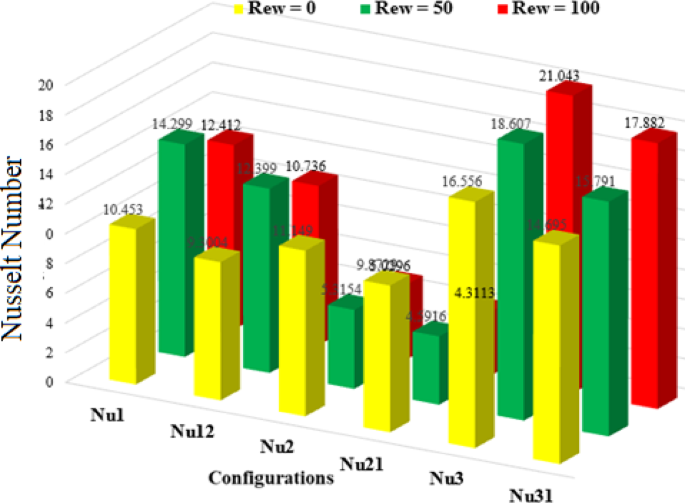
Comparisin of Nusselt number when C2 = 0, C1 = C3 = rotating, and \(\phi =3\% {\text{ and }}\phi =1.5\%\).
Fig. 21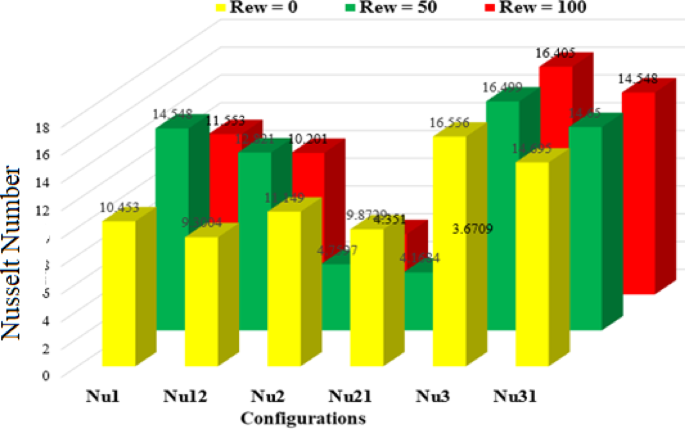
Comparisin of Nusselt number when C3 = 0, C1 = C2 = rotating, and \(\phi =3\% {\text{ and }}\phi =1.5\%\).
To enhance the clarity of comparative understanding of the result, a series of heatmap Figs. 22, 23, 24, 25 have been added to clearly compare the Nusselt number variations across four different rotation configurations (Cases 1 to 4) for both 3% and 1.5% nanoparticle volume fractions under varying rotational Reynolds numbers. These visualizations strengthen the interpretation of the findings by providing an immediate graphical comparison of thermal performance, ensuring a clearer and more structured presentation of the study.
Fig. 22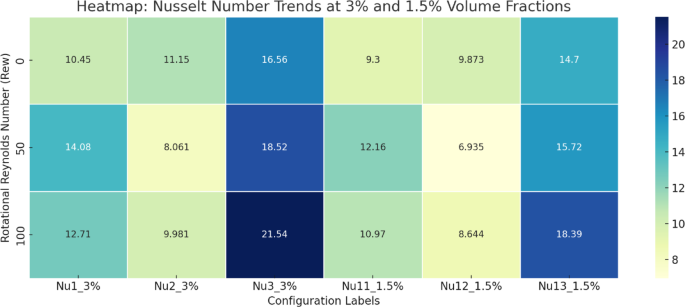
Comparisin of Nusselt number when C1 = C2 = C3 = rotating, and \(\phi =3\% {\text{ and }}\phi =1.5\%\).
Fig. 23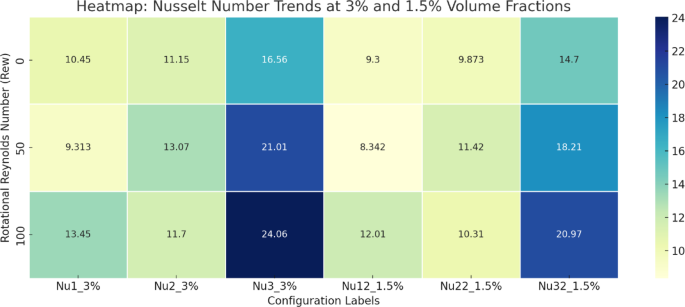
Comparisin of Nusselt number when C1 = 0, C2 = C3 = rotating, and \(\phi =3\% {\text{ and }}\phi =1.5\%\).
Fig. 24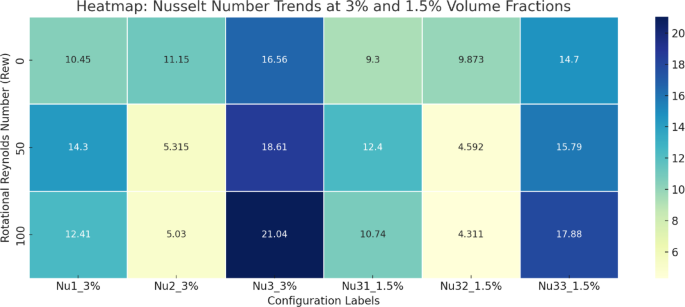
Comparisin of Nusselt number when C2 = 0, C1 = C3 = rotating, and \(\phi =3\% {\text{ and }}\phi =1.5\%\).
Fig. 25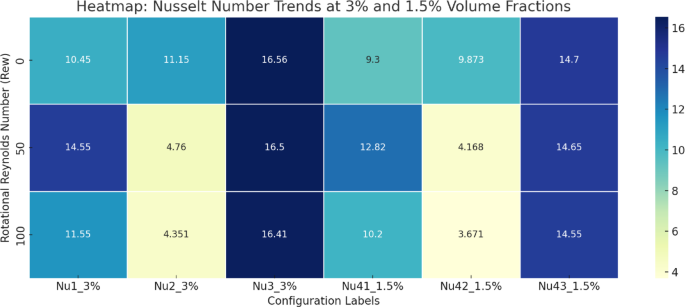
Comparisin of Nusselt number when C3 = 0, C1 = C2 = rotating, and \(\phi =3\% {\text{ and }}\phi =1.5\%\).
The tabulated Nusselt number data represents in Tables 5, 6, 7 and 8 for all four configurations under three rotational Reynolds numbers \(({\operatorname{Re} _\omega }=0,50,100)\)and two nanoparticle volume fractions (3% and 1.5%) reveals that increasing \({\operatorname{Re} _\omega }\) generally enhances heat transfer performance. In Case 1 (all cylinders rotating), the Nusselt numbers for both volume fractions consistently rise with rotational speed, reaching their highest values at \({\operatorname{Re} _\omega }=100\). In Case 2 (C1 static) and Case 3 (C2 static), the actively rotating cylinders show significant Nu improvement with higher \({\operatorname{Re} _\omega }\), while static cylinders exhibit smaller gains or non-monotonic trends due to asymmetric vortex development. Case 4 (C3 static) shows a similar pattern, where heat transfer enhancement is most notable for rotating cylinders but less pronounced for the stationary one. Across all cases, the effect of increasing nanoparticle volume fraction from 1.5% to 3% is positive, with higher thermal conductivity leading to consistently larger Nu values. These trends confirm that higher rotational speeds and increased nanoparticle concentrations synergistically boost convective heat transfer, though the degree of improvement depends on cylinder placement and flow symmetry.
Table 5 Comparisin of Nusselt number when C1 = C2 = C3 = rotating, and \(\phi =3\% {\text{ and }}\phi =1.5\%\).Table 6 Comparisin of Nusselt number when C1 = 0, C2 = C3 = rotating, and \(\phi =3\% {\text{ and }}\phi =1.5\%\).Table 7 Comparisin of Nusselt number when C2 = 0, C1 = C3 = rotating, and \(\phi =3\% {\text{ and }}\phi =1.5\%\).Table 8 Comparisin of Nusselt number when C3 = 0, C1 = C2 = rotating, and \(\phi =3\% {\text{ and }}\phi =1.5\%\).