
Data source
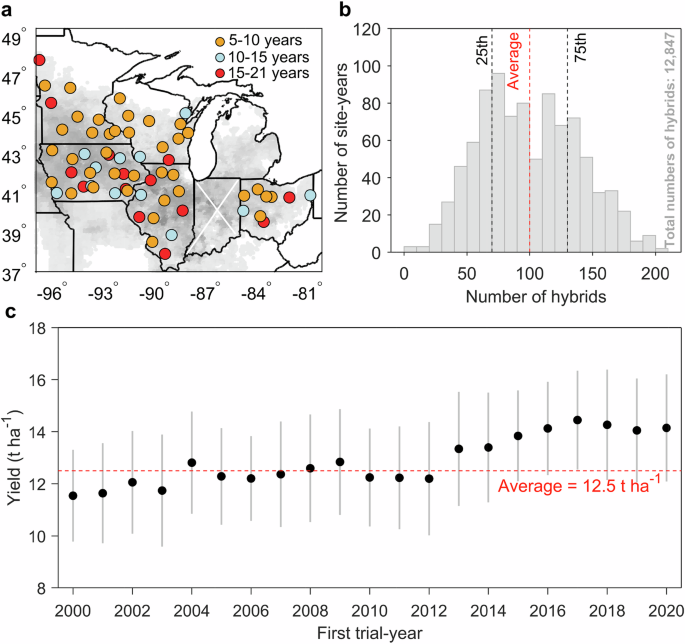
Maize hybrid data, including observed hybrid-specific yields (adjusted to 15.5% moisture content) and phenological dates (planting and harvest), were collected and digitized from rainfed, university field performance tests of maize hybrids from 2000 to 2020 for five main production states, including Iowa, Illinois, Minnesota, Ohio, and Wisconsin, accounting for 50% of the U.S. maize harvested area (Fig. 1a). In total, the database we used included 92,096 data points across 63 field sites. The sources of all hybrids were provided by U.S. companies. The original purpose of these trials was to evaluate the performance of advanced hybrids under diverse environmental conditions, aiming to identify resilient hybrids suitable for release to farmers. Trials were conducted under “optimal” rainfed management conditions, employing site-specific agronomic treatments to optimize nutrients and minimize disease and other stresses. We segmented maize phenological periods into the vegetative growth period (VEG, from sowing to silking) and the grain filling period (GFP, from silking to maturity). Based on reported planting and harvest dates, we used state-level phenological data (Supplementary Fig. S21) from the United States Department of Agriculture’s National Agricultural Statistical Service’s Crop Progress Report to estimate silking and maturity dates for each trial site. Details are shown in Supplementary Text 1. To assess the impact of drought on different yield levels in subsequent analyses, we divided the maize hybrids of each site-year into three yield categories based on percentile thresholds (A case using hybrid yield data in 2000 at Belleville, Illinois for dividing maize hybrids into three yielding types is shown in Supplementary Fig. 22). These categories encompass high-yielding hybrids (HYH; >75th percentile of all hybrid yields for a given site-year), median-yielding hybrids (MYH; 25th percentile ≤ MYH ≤ 75th percentile), and low-yielding hybrids (LYH; <25th percentile) (Supplementary Text 2 and Supplementary Fig. 6).
Daily surface observational weather data, including maximum (Tx; oC), minimum (Tn; oC), and dew point (Td; oC) temperatures, along with precipitation (Prcp; mm), were derived from the Integrated Surface Dataset (ISD)56 and interpolated with a Delaunay Triangulation57 and applied to the field trial sites (Fig. 1a) to approximate the daily weather experienced by the crop. We used the ISD data due to its high-quality measurement of Td, which is a critical weather variable in the calculation of VPD. Daily weighted VPD (kPa) to reflect the daily pattern of transpiration rate was calculated as follows58,59,60:
$${e}_{s}=\alpha \times \left[0.611\times \exp (\frac{17.3\times {T}_{x}}{{T}_{x}+237.3})\right]+\left(1-\alpha \right)\times \left[0.611\times \exp \left(\frac{17.3\times {T}_{n}}{{T}_{n}+237.3}\right)\right]$$
(1)
$${e}_{a}=0.611\exp \left(\frac{17.3\,{T}_{d}}{{T}_{d}+237.3}\right)$$
(2)
$${VPD}={e}_{s}-\,{e}_{a}\,$$
(3)
where es is daily weighted saturation vapor pressure (kPa), assuming the daily es should be integrated from about 0900 h to evening, when net radiation becomes negative58. α equals 0.75, accounting for the daytime fraction. ea refers to actual vapor pressure (kPa) for a given daily dew point temperature (Td).
Yield gains with breeding progress
To assess yield gains due to breeding progress under various environmental stress levels for three yield types (HYH, MYH, and LYH), we calculated the environment index (EI) for each site-year, providing an overall environmental level in field trials. This approach, widely used in plant breeding, enables the assessment of crop variety/hybrids’ adaptation across diverse environmental conditions by offering a simplified yet integrative measure of complex natural environments. Although this approach does not pinpoint specific environmental stressors or yield-reducing mechanisms, such as poor establishment, pest and disease, lodging, or abiotic stresses, it remains a practical tool for capturing patterns of crop performance across varying levels of integrated environmental stress. In terms of each yield type, the environment index is defined as the average yield across all hybrids grown at a given site-year41, providing a reliable measure of stress level in field trials. We then categorized the EI of all trial sites for each year into five percentile intervals: ≤ 10th, 10th–25th, 25th–75th, 75th–90th, and ≥90th and calculated average yields. These intervals signify different degrees of environmental stress, with the smallest interval representing the most stressed and the highest interval representing the least stressed. It is important to note that we established the threshold of each percentile separately based on all sites in a specific year, which eliminates variations in technology and management between bins within each year. Next, we estimated yield trends for each environmental stress level using standard least-squares linear regression. The calculated process is shown in Supplementary Text 4 and Supplementary Fig. 23. To assess whether the yield trend over breeding shows a statistically significant difference across varying environmental conditions, we performed a two-sided Student’s t-test at a 95% confidence level. A p-value greater than 0.05 would suggest that breeding progress contributes to relatively parallel gains in maize yield across a range of environmental conditions. We also tested other threshold intervals (20th, 40th, 60th, and 80th) to estimate yield gains of maize hybrids (Supplementary Fig. 13). To further explore this point, we analyzed relative yields, calculated as the ratio of the actual yields at specific environmental levels to the trend yields under the most favorable conditions, which serves as a reference baseline (Supplementary Fig. 24). If breeding progress had disproportionately favored higher-yielding environments, we would expect declining trends (negative slopes) in fractional yields under stressed conditions.
Statistical yield model
Maize hybrids typically exhibit a threshold response to VPD, where partial stomata closure occurs above a certain VPD threshold to reduce water loss under high VPD conditions36,45. Below this threshold, VPD tends to be positively associated with yield change. To account for this physiological factor, we developed two indices of VPD: one for the average intensity of VPD below the threshold (VPDb) and the other for the average intensity of VPD above the threshold (VPDa), calculated during specific phenological periods (p) using daily weighted VPD data.
$${{VPD}}_{b,p}=\frac{{\sum }_{i=1}^{n}{{VPD}}_{i,p}}{{N}_{p}};{{VPD}}_{i,p}=\left\{\begin{array}{c}{{VPD}}_{i,p},{{VPD}}_{i,p}\le {{VPD}}_{p}^{*}\\ {{VPD}}_{p}^{*},\,{{VPD}}_{i,p} > {{VPD}}_{p}^{*}\end{array}\right.$$
(4)
$${{VPD}}_{a,p}=\frac{\mathop{\sum }_{i=1}^{n}{{VPD}}_{i,p}}{{N}_{{{{VPD}}_{i,p} > {VPD}}_{p}^{*}}};{{VPD}}_{i,p}=\left\{\begin{array}{c}0,\,{{VPD}}_{i,p}\le {{VPD}}_{p}^{*}\\ {{VPD}}_{i,p}-{{VPD}}_{p}^{*},{{VPD}}_{i,p} > {{VPD}}_{p}^{*}\end{array}\right.$$
(5)
where VPDi,p is the daily VPD value (VPDi) during phenological period p, with p = 1 for the VEG period and p = 2 for the GFP period. Np is the total number of days (N) within period p, and VPD* is the threshold of VPD. NVPDi,p > VPD*p refers to the number of days during period p when daily VPD exceeds the threshold of VPD. Note that the index VPDa primarily captures the average intensity of VPD above the threshold but does not account for the frequency of VPD above the threshold, both of which are crucial factors in determining crop yield change. To account for this factor, we further adjusted VPDa,p by incorporating the frequency of VPD above the threshold during the phenological period, as follows,
$$\widehat{{{VPD}}_{a,p}}={{VPD}}_{a,p}+{{VPD}}_{a,p}\times \frac{{N}_{{{{VPD}}_{i,p} > {VPD}}_{p}^{*}}}{{N}_{p}}$$
(6)
where \(\widehat{{{VPD}}_{a,p}}\) represents the adjusted VPD above the threshold. \(\frac{{N}_{{{{VPD}}_{i,p} > {VPD}}_{p}^{*}}}{{N}_{p}}\) reflects the frequency of days when VPD exceeds the threshold, relative to the total number of days in the period.
We defined 1.4 kPa and 1.3 kPa as the VPD thresholds for the VEG and GFP periods, respectively. These thresholds were selected based on optimal model performance (Eq. (7)), as determined by the smallest Akaike Information Criterion (AIC; Supplementary Fig. 7) using the full dataset. The AIC is a statistical measure used to assess the goodness of fit of different models, with a lower AIC value indicating a better fit61. To identify the optimum VPD thresholds, we systematically tested a range of values from 1.3 kPa to 1.9 kPa with a step size of 0.1 kPa based on the distribution of daily VPD during each phenological stage (Supplementary Fig. 7a). This range represents the 50th to 90th percentiles of daily VPD, resulting in 49 combinations of VPD thresholds (7 values for VEG period × 7 values for GFP period). For each threshold combination, model fitting was conducted to assess performance, allowing us to identify the threshold that produced the best model performance (Supplementary Fig. 7). Details regarding the selection of the threshold are shown in Supplementary Text 3. The thresholds VPD identified in this study are slightly lower than those found in a previous study39, likely due to the difference in calculating actual vapor.
$${Y}_{i,l,t,s}= {\alpha }_{i}+{\alpha }_{l}+{\alpha }_{t,s}+\mathop{\sum }_{p=1}^{2}{\left(\right.\beta }_{1,p}{{Prcp}}_{i,l,t,s,p}+{\beta }_{2,p}{{{Prcp}}_{i,l,t,s,p}}^{2} \\ +{\beta }_{3,p}{{VPD}}_{b,i,l,t,s,p}+{\beta }_{4,p}{{VPD}}_{a,i,l,t,s,p}\left)\right.+{\varepsilon _{i,l,t,s}}$$
(7)
where Yi,l,t,s is maize yield for hybrid i at location l in trial-year t for a specific state s. The first three terms (αi, αl, αt,s) are effects across hybrids, locations, and a specific state-year group. This approach is commonly used to control unobserved factors (e.g., fertilizer use, soil quality) that might influence yield. β1, β2, β3, and β4 refer to the sensitivity of precipitation, precipitation squared, and VPD below and above the threshold for a specific phenological period. The squared precipitation term is included to capture the nonlinear effect of precipitation on yield. The subscript p refers to the phenological period, including the vegetative period and grain filling period. The ε is the error term. We quantified uncertainty in the historical maize yields-weather variables relationship by a bootstrap approach (1000 times, sampling with replacement)62. Our model used actual yield data instead of log-transformed yield data because the model using actual yield data had more explanatory power (R2 = 0.63; Supplementary Table 1) and more normally distributed residuals (Supplementary Fig. S25). After identifying the optimum threshold of VPD, we used Eq. 7 to estimate the VPD effect on yield for three hybrid yield types (HYH, MYH, and LYH) (Fig. 2 and Supplementary Fig. 8). We also assessed whether drought-tolerant (DT) hybrids, characterized by Pioneer Optimum AQUAmax and DroughtGard products25, improve drought resistance compared to non-DT hybrids. Specifically, maize hybrids were classified into DT and non-DT types, and the interaction terms between VPDa and hybrid types (DT and non-DT) were incorporated into Eq. 7 to estimate the sensitivity of VPDa for these two hybrid types (Supplementary Fig. 16 and Supplementary Table 2).
To investigate heterogeneous effects of VPD above the threshold (VPDa) on hybrids due to breeding progress, we modified the statistical model (Eq. 7) to allow the effect of VPDa to vary across the years in which the hybrids first appeared in the trials (first trial-year; fty) (Fig. 4a). This was achieved by including the interaction term between VPDa and dummy variables for first trial-year. The specification of the model is,
$${Y}_{i,{fty},l,t,s}= {\alpha }_{i}+{\alpha }_{l}+{\alpha }_{t,s}+{\sum }_{p=1}^{2}{\left(\right.\beta }_{1,p}{{Prcp}}_{i,l,t,s,p}+{\beta }_{2,p}{{{Prcp}}_{i,l,t,s,p}}^{2} \\ +{\beta }_{3,p}{{VPD}}_{b,i,l,t,s,p}+{\beta }_{4,{fty},p}{{VPD}}_{a,i,{fty},l,t,s,p}\left)\right.+{\varepsilon }_{i,{fty},l,t,s}$$
(8)
Effect of VPD change on maize yield through 1 oC warming
To better reflect temporal and spatial changes in yield driven by climate warming and hybrid advancements, we categorized maize hybrids into three age groups based on the first-trial-year, representing old (2000-2006), intermediate (2007–2013), and new (2014–2020) hybrids. The sensitivity of maize yield to VPD for each group was then estimated by adding interaction terms between hybrid groups and VPDa into Eq. 7 (Fig. 4b). To estimate the effect of VPD change on maize yield for each hybrid group under 1 oC warming, we artificially raised observed temperature by 1 oC on each day during the growing season, including the VEG and GFP periods, for each location-year (63 locations × 21 years). VPD indices were then recomputed for each phenological period. Based on the calculated VPD values, we used the regression model to predict the yield. The effects of VPD change were summarized for each location as the average across all years (2000–2020) (Fig. 4c), as follows,
$$\%{Y}_{l}=\frac{\frac{1}{n}\times {\sum }_{{yr}=2000}^{2020}(\widehat{{Y}_{2,{yr},l}\,}-\,\widehat{{Y}_{1,{yr},l}})}{\hat{Y}}\,\times 100$$
(9)
where %Y represents the percentage change in yield relative to the mean observed yield (\(\hat{Y}\) = 12.5 t ha−1; Fig. 1c) for each location l. n refers to the number of years, which equals 21. \(\hat{{Y}_{1}}\) and \(\hat{{Y}_{2}}\) are the predicted yields using the original and 1 oC-warming VPD values, respectively.
Projected impact of VPD on maize yield
To investigate how VPD during the maize growing season would change in the future and its influence on yield, we downloaded the climate projections from the NASA Earth Exchange-Global Daily Downscaled Projections-Coupled Model Intercomparison Project Phase 6 (NEX-GDDP-CMIP6)63, using seven climate models (EC-Earth3, INM-CM4-8, MPI-ESM1-2-HR, MPI-ESM1-2-LR, MRI-ESM2-0, NorESM2-LM, and NorESM2-MM) under three climate scenarios (SSP2-4.5, SSP3-7.0, and SSP5-8.5). The SSP2-4.5 scenario is associated with a nominal radiative forcing level of 4.5 W m−2 anticipated by the year 2100. The SSP3-7.0 scenario is a medium-high reference scenario within the “regional rivalry” socioeconomic family with a high emission and CO2 doubled by the year 2100, while the SSP5-8.5 marks the upper edge of the SSP scenario spectrum with a high reference scenario in a high fossil-fuel development world throughout the 21st century. We then interpolated these projections to each field site with a Delaunay Triangulation57 to calculate daily VPD. Because projections for dew point temperature were not available, we used specific humidity, which describes the mass of water vapor present in a unit mass of moist air, to calculate actual vapor pressure64. We cannot know future maize phenological periods for certain; thus, an average of observed historical phenological periods (Supplementary Fig. 19) was used to calculate VPD. Using a fixed phenology allows for a more accurate estimation of the impact of climate change on yield by isolating the effects of phenological changes. However, given the potential for future warming to drive earlier sowing dates and faster plant development rates, we also recalculated daily VPD for the future by artificially advancing the phenological periods by 10 days. Finally, VPD derived from the seven climate models, along with the sensitivity of maize yield to VPD, were used to estimate the average yield effects. All data sources used in this study are shown in Supplementary Table 3.
We then estimated impacts of projected VPD on maize yield for three hybrid age groups: old (2000–2006), intermediate (2007–2013), and newer (2016–2020) hybrids as follows:
$${{imp}}_{{VPD},g}=\frac{{\sum }_{p=1}^{2}({\beta }_{3,p}\times {{VPD}}_{b,p}+{\beta }_{4,g,p}\times {{VPD}}_{a,p})}{\hat{Y}}\times 100$$
(10)
where \({{imp}}_{{VPD}}\) refers to projected impacts of VPD on yields (%) relative to historical averaged yields (\(\hat{Y}\); 12.5 t ha−1, Fig. 1c) and g refers to either old, intermediate, or new hybrids.
Reporting summary
Further information on research design is available in the Nature Portfolio Reporting Summary linked to this article.