
VANCOUVER — The New York Rangers were off Monday as they attempt to regroup following three straight losses. The latest came Sunday in Calgary, where a 5-1 defeat against the Flames prompted coach Mike Sullivan to bluntly state, “We’re not at our best right now.”
That’s been the case for much of the first 10 games of the 2025-26 season, albeit for different reasons. At first, the Rangers were executing a tight defensive system but couldn’t score. And while those offensive woes have largely continued, the defense has taken a step back during this losing streak. It’s left fans wondering if their hope for a rebound following last season’s crash-and-burn is destined for disappointment.
The 3-5-2 record isn’t pretty, leaving New York tied with the Boston Bruins for worst points percentage in the Eastern Conference entering play Monday. But a deeper look into the statistics reveals a mix of both positive and negative trends.
To give us a better idea of how the Rangers are performing in all facets of the game — both as a team and individually — here are 10 numbers that caught my eye through 10 games. (Big thanks to colleagues Shayna Goldman and Dom Luszczyszyn for assists on a few of these!)
10 stats for 10 games
10 goals allowed to begin and end periods — Ten is the number of goals the Rangers have surrendered in the first two or final two minutes of a period this season. Three have been empty-netters in the closing moments of losses, but as captain J.T. Miller said Sunday, poor starts are “becoming a trend.” New York has allowed a goal in the opening two minutes of three of its last four games. The Rangers seem to lose focus at the end of periods, as well. San Jose Sharks rising star Macklin Celebrini scored in the final 10 seconds of the first and second periods during the Rangers’ 6-5 OT loss on Thursday. It nearly happened again Sunday, with the Rangers receiving a fortunate bounce when a Nazem Kadri shot redirected off defenseman Will Borgen’s skate and away from the net in the final seconds of the first period.
11.44 goals below expected — That’s the gap between the Rangers’ actual goals (22) and expected goals (33.44) in all situations, according to Evolving-Hockey, which ranked as the third-worst differential behind the Capitals (11.68) and Flames (11.57) entering play Monday. The Rangers have argued they deserve better based on the quality of their scoring chances, with these numbers backing up that claim. In theory, their luck should even out if they continue at this pace.
17.32 Corsi For/60 — Mika Zibanejad is the poster child for generating looks and not getting rewarded. His average of 17.32 shot attempts per 60 minutes in all situations ranks as a career high, as does his rate of 1.47 individual expected goals per 60, according to Evolving-Hockey. The latter stat leads the team, as do his 25 individual high-danger scoring chances, according to Natural Stat Trick. For comparison, Zibanejad was at 12.4 shot attempts per 60 and 0.6 ixG last season while producing a total of only 72 iHDCF across all 82 games. Does that guarantee the goals will come? No, but it serves as evidence that he’s more aggressively seeking his shot and getting to the high-danger areas.
7.7 SH% — That’s the Rangers’ collective shooting percentage, which ranks 31st in the NHL. The glass-half-full take would be that they’re due for an uptick, but this isn’t all about bad luck. New York’s roster is as light on finishing talent as it’s been since the late-2010s rebuild era, and it’s becoming painfully obvious. Their top six has only three proven point producers — Miller, Zibanejad and Artemi Panarin — leaving Sullivan to rely on limited veterans such as Taylor Raddysh and Conor Sheary in critical spots. Meanwhile, the bottom six is devoid of skill, and the D-corps has no offensive threat outside of Adam Fox. Their goal output and shooting percentage reflects that harsh reality.
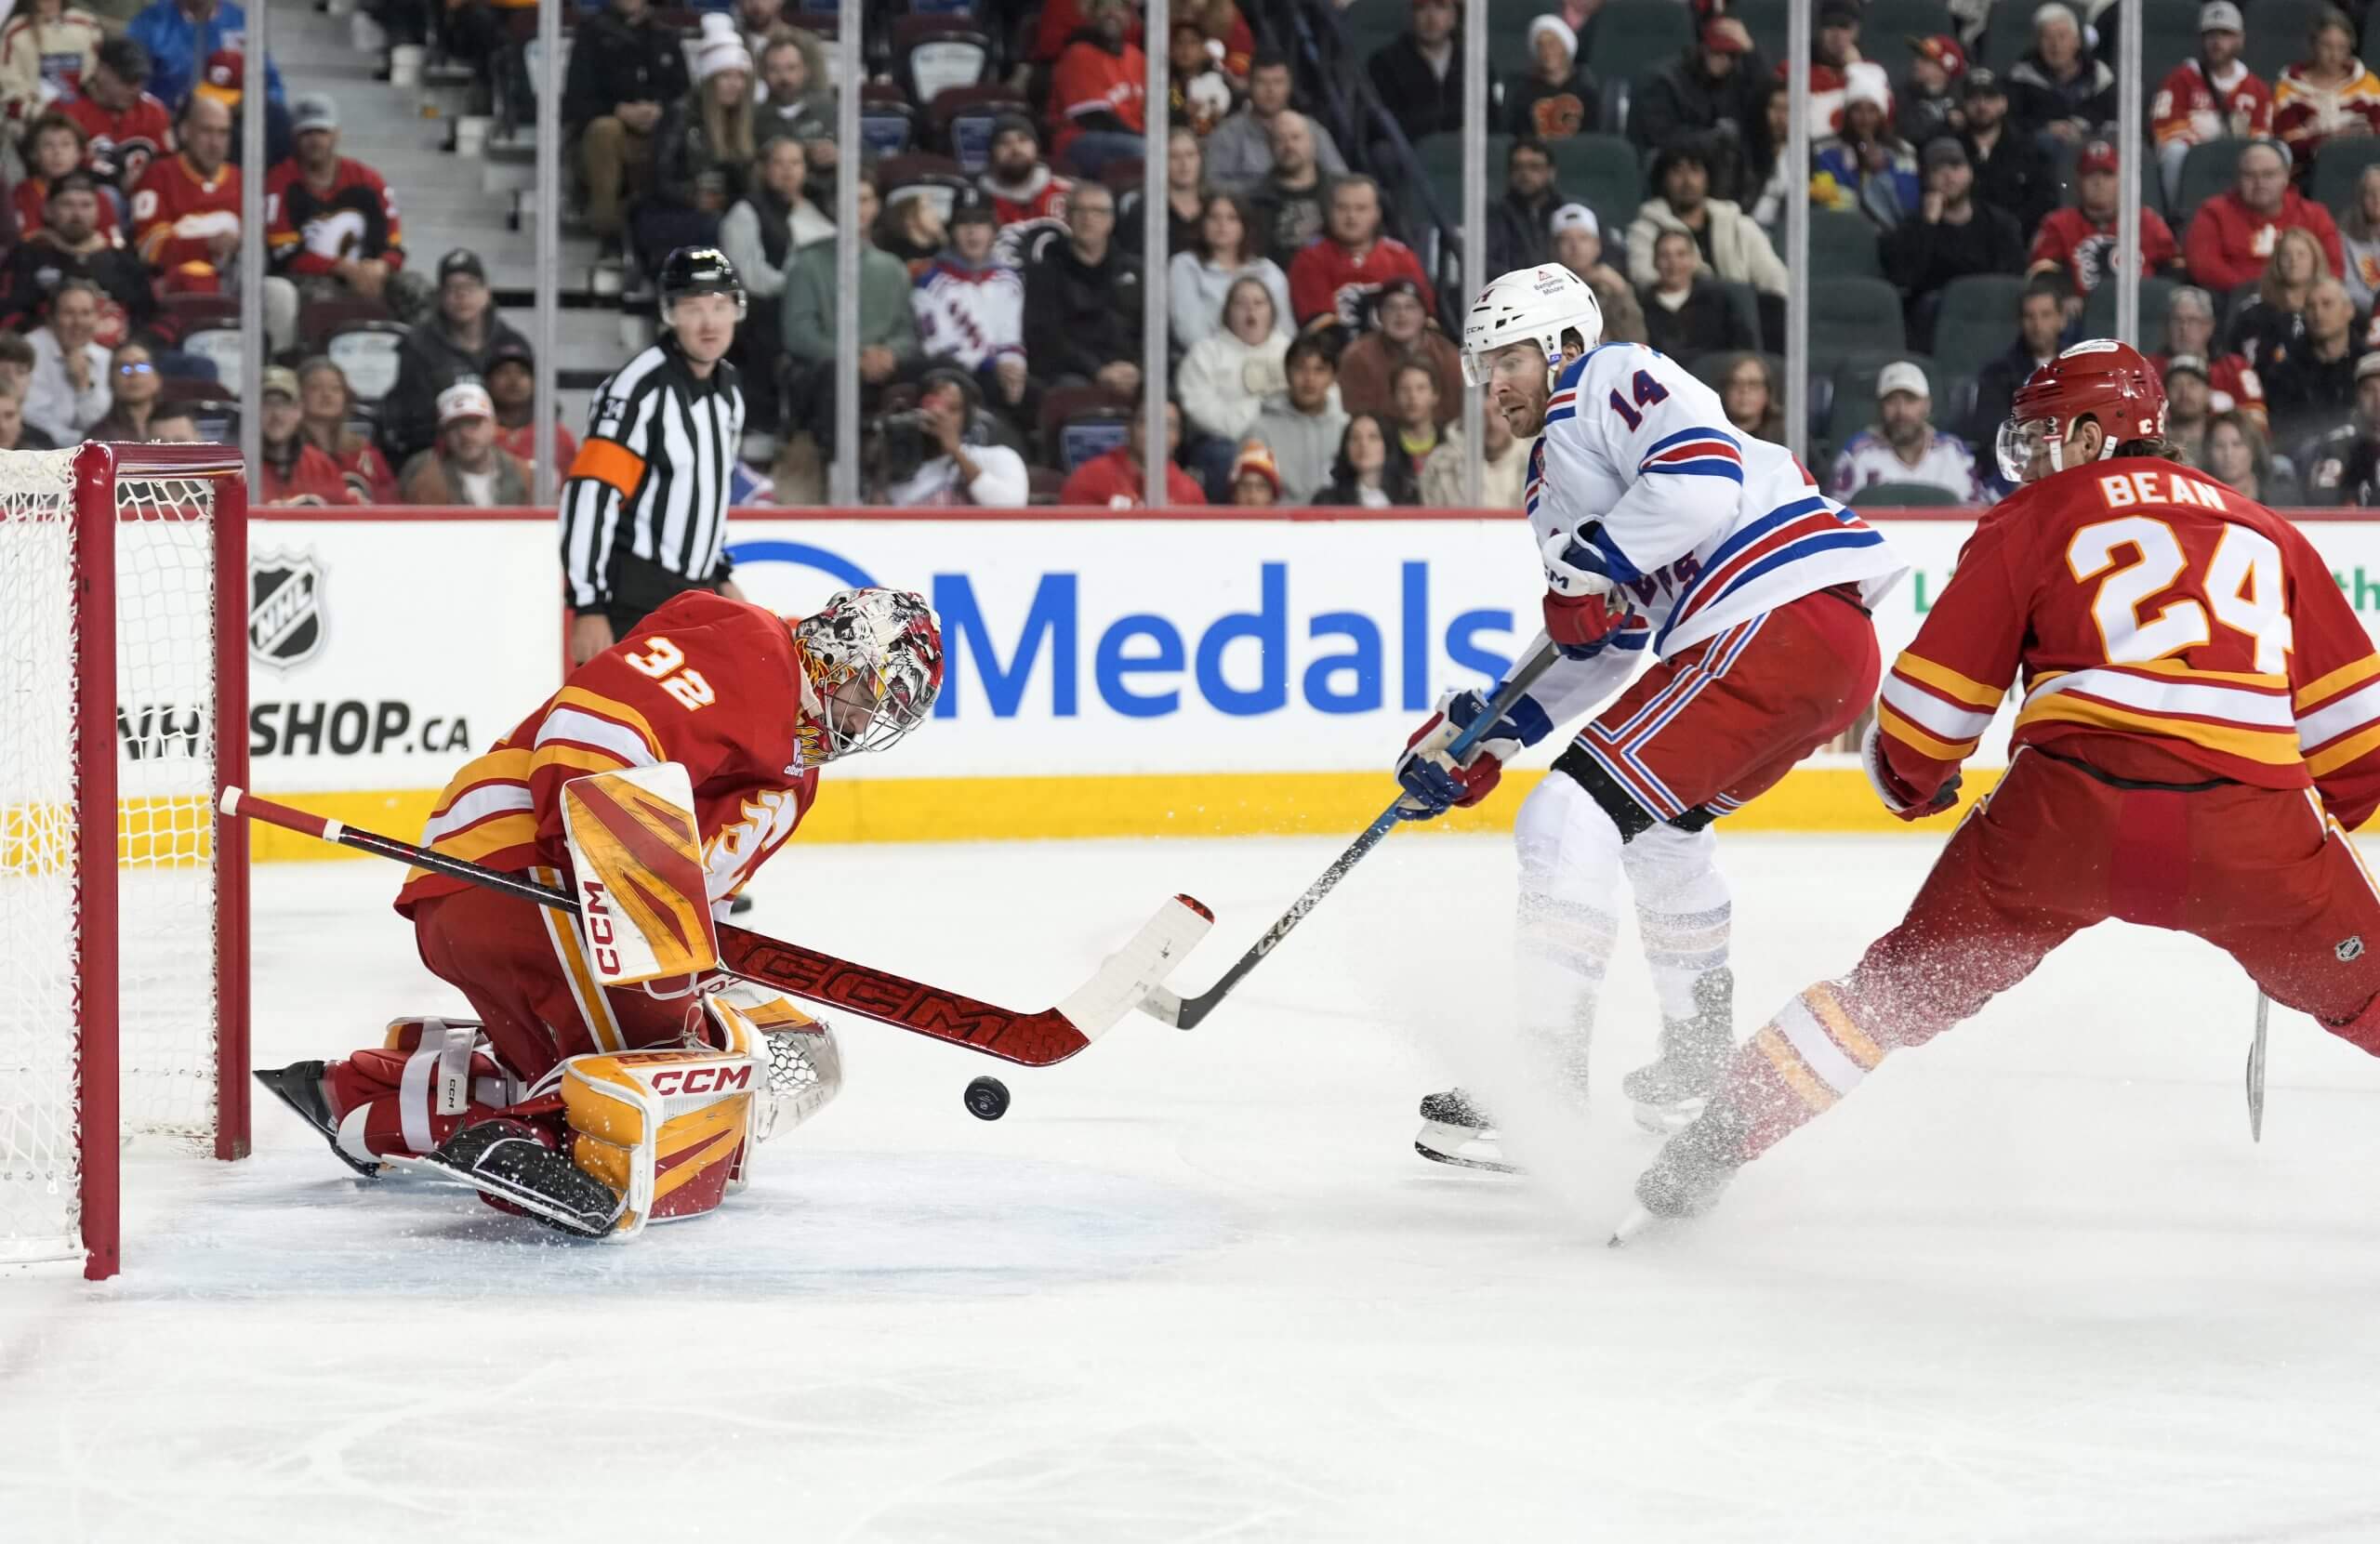
The Rangers are struggling to put the puck into the net this season. (Leah Hennel / Getty Images)
16.0 PP% — The Rangers have been a mediocre to bad team at five-on-five for years, but their offense has been fueled by one of the NHL’s best power plays. From 2019 to 2024, they ranked fourth with a 24 percent success rate. They plummeted to 17.6 percent last season, which sat 28th in the league, and have gotten off to an even worse start at 16 percent to begin the 2025-26 season. They’ve converted four of 25 opportunities, with their once-feared top unit struggling to get into a groove.
2.5 PP per game — This stat may be part of the problem. Entering Monday, the Rangers were tied for last in the NHL with an average of 2.5 power-play opportunities per game. They’re simply not drawing enough penalties, especially of late. They’ve had two power plays or fewer in three of their last four games, a sign that they’re not spending enough time with possession of the puck.
7 points — That’s how many points the Rangers’ co-leaders, Fox and Panarin, have through 10 games. Their average of 0.7 points per game falls well short of their lofty standards. It’s been especially glaring for Panarin, who entered the season with a 1.28 points-per-game mark since coming to New York in 2019. He’s been held off the scoresheet in six of 10 games so far. There’s a long way to go, but with his 34th birthday Thursday, it’s looking like the Rangers should proceed with caution when deciding how much — and how long — to offer the pending free agent.
7.87 HDCA/60 — There’s a lot to be concerned with at this early juncture, but we’ll finish with a few stats on the positive side of things, starting with defensive improvements. There’s been a dip the last few games — “We’re getting away from a team game,” as Sullivan put it — but the overall numbers remain encouraging. The Rangers sit first in the NHL with an average of 7.87 high-danger scoring chances allowed per 60 minutes at five-on-five, according to Natural Stat Trick, which is a quantum leap from the 12.2 HDCA/60 that ranked 29th last season. They also rank second with 2.1 xGA/60 and fifth with 1.94 goals allowed per 60. Sullivan’s emphasis on defense has paid immediate dividends; now it’s a matter of maintaining it.
60.29% xGF — Alexis Lafrenière has taken a lot of heat, some of it deserved. The Rangers are counting on him to fortify a thin top six, so three points (one goal and two assists) and inconsistent all-around play aren’t going to cut it. But a look under the hood shows an impact that’s better than the general perception suggests. The 24-year-old’s 60.29 percent xGF is best on the team, according to Natural Stat Trick, with New York holding a decisive 34-14 edge in high-danger chances at five-on-five. It needs to result in better production, but the Rangers typically have the advantage while Lafrenière is on the ice.
1.74 QoC — Our final stat comes from Luszczyszyn, who built a model that measures the difficulty of the matchups a given player faces. It gives Fox a 1.74 offensive quality of competition rating, which ranks highest among Rangers defensemen. But what exactly does that mean? For context, Fox was fourth last season with a 1.18 QoC. What this tells us is that he’s being used in more of a true shutdown role with new partner Vladislav Gavrikov, who ranks right behind Fox at 1.69. Under previous coach Peter Laviolette, the K’Andre Miller-Borgen pair was used more often against opposing teams’ top lines, and as such, had a higher QoC.
Under increasingly strenuous circumstances, Fox is holding up quite well. His 59.35 percent xGF and 1.99 xGA/60 both rank tops among New York’s defensemen this season, according to Natural Stat Trick, with positive results in some of his tougher head-to-head matchups. His xGF was 64 percent against Edmonton’s Leon Draisaitl (along with 55.07 percent against Connor McDavid), 81.01 percent against Toronto’s Auston Matthews and 75.8 percent against Minnesota’s Kirill Kaprizov, as a few examples.