
Reconstructed patterns
The spatial patterns of our reconstructed fine-scale AGC changes between 2010 and 2020 in the Amazon were compared against the original, coarse resolution AGC estimates (Fig. 1a, b), evaluated against forest plot data aggregated to a 0.1° spatial resolution (Fig. 1c), and compared with other AGC products (Fig. 1d). Supplementary sections C2 to C5 present further validations and comparisons, including a validation at high resolution against Light Detection and Ranging (LiDAR) data. The last comparison shows that CCI data has a higher linear correlation with LiDAR than our maps across all land cover types, but our maps often exhibit lower root mean square error than CCI (Table S1, Table S2). Our reconstructed high-resolution values of AGC change ranged between -204 and 371 MgC ha−1, with 99% of the changes between -64 and 34 MgC ha−1, and with a median of 0.2 MgC ha−1, respectively. The major losses occurred in areas of intense deforestation and degradation, such as the arc of deforestation in Brazil and the Santa Cruz department in Bolivia. The comparison of reconstructed AGC values with field estimates yielded a Pearson correlation coefficient of 0.83 and a root mean squared error of 53.94 MgC ha−1 (n = 482 cells containing forest plots, Fig. 1c, see Fig.S6 and Fig.S7 for comparison with other datasets). The analysis of convergence among datasets showed reduced uncertainty across 81.5% of the study domain (Fig. 1d). Such a reduction was characterized by a variance ratio comparing the uncertainty across our dataset combined with JPL19, CCI17,18 and WRI20,21, to the uncertainty among JPL, CCI and WRI alone. This finding indicates that our dataset contributes to consolidating the existing knowledge on the trends and spatial patterns of AGC changes in the Amazon. Our data-driven consistent time series of AGC change maps simultaneously agreed with existing sources at different spatial scales, opening new possibilities for spatial analyses in the Amazon.
Fig. 1: Spatial pattern of aboveground biomass carbon (AGC) changes the Amazon biome.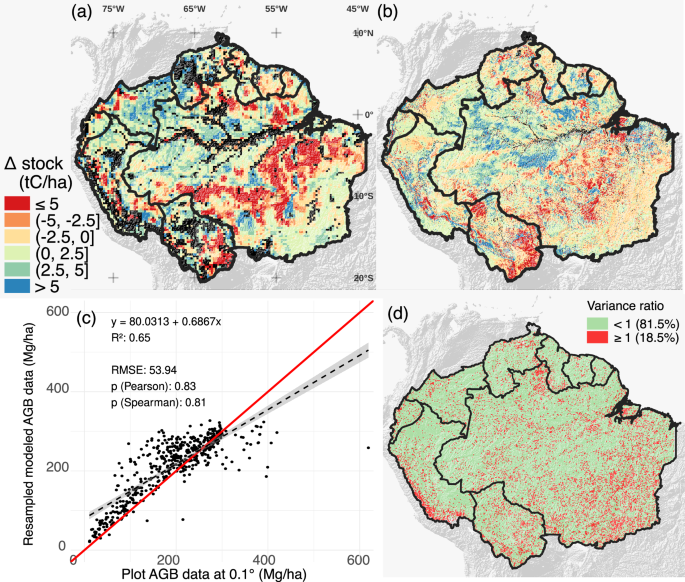
a–d: (a) change of AGC 2010-2020 (∆) from vegetation optical depth (VOD) measurements at a coarse 0.25° spatial resolution (~ 27.8 km at the Equator), b reconstructed delta AGC 2010-2020 at high spatial resolution (~100-m at the Equator), (c) comparison of 100 m AGC stocks against forest plot data at a 0.1° spatial resolution, with a 1:1 line in red, and (d) the variance ratio of biomass change (2010-2018) with and without our reconstruction. Black pixels in (a, b) represent flooded areas and masked outliers (see “Materials and Methods”).
The map of AGC stocks (Supplementary Material, Fig.S6) indicates a pattern of low biomass values in areas with intense direct human activity (e.g., eastern Brazil) or with a mountainous topography (e.g., western Peru), and higher AGC values when far from these areas. At the borders between undisturbed and non-undisturbed areas (Fig.S6), medium values may represent a loss of AGC possibly due to spillover effects of deforestation and degradation due to fragmentation, such as drier microclimate and other edge effects28. The 2020 map presents median AGC values of 132 MgC ha−1 in undisturbed and 69 MgC ha−1 in degraded forests (i.e., according to the TMF dataset26, see “Materials and Methods”). These values are lower than the 179 MgC ha−1 for undisturbed and similar to the range of 48-86 MgC ha−1 for degraded areas reported by forest inventory plots of ref. 29. AGC estimates in pixels with secondary forest regrowth in the Peruvian Amazon (Fig.S23) averaged 74 ± 35 MgC ha−1, higher than airborne LiDAR estimates on the Peruvian Amazon30 (i.e., 33 ± 7 MgC ha−1), and the same relationship held for deforested areas, at 38 ± 24 MgC ha−1 in our results versus 28 ± 17 MgC ha−1 in the LiDAR estimates30. In the Brazilian arc of deforestation, we estimated average gross losses of -97.8 TgC year−1 and gross gains of 37.8 TgC year−1 in 2016-2018, comparable to the −134.6 TgC year−1 and the 44.1 TgC year−1 estimated from LiDAR data by ref. 31. For the limitations of our deforestation and regrowth estimates, see sections C5 and C6 of the Supplementary Material, where the following subjects are evaluated: i) validation at finer scale; ii) distribution of disaggregated AGC stocks and limitations of L-VOD AGC; iii) effect of the land cover change dataset; iv) effect of the AGC input dataset; and v) impact of forcing model behavior.
High-resolution AGC change
We analyzed the high-resolution net AGC change in the Amazonian rainforest with respect to the reference year of 2010, considering the contribution of each class: undisturbed forests, areas with regrowth, degraded forests, deforested areas, and other land cover types. Figure 2 shows the original coarse-scale budget derived from L-VOD directly with a dashed black line, and the reconstructed high-resolution budget with a continuous black line. The later information shows that the total net AGC change reached a maximum as stocks increased by 0.96 ± 0.16 PgC (mean ± standard deviation) over 2010–2012 and a minimum when they decreased by -0.61 ± 0.17 PgC over 2010-2018, respectively. Changes in stocks of undisturbed forests explain much of the annual variation in the first two years of the decade (Fig. 2b-d). These forests thrive in a dynamic equilibrium between biomass accumulation, continuous turnover, and discrete losses associated with natural disturbances such as droughts, insect outbreaks and pathogens, or windthrows32. After 2012, the increased participation of degradation and regrowth outweighed the contribution of undisturbed forests. The losses of AGC in undisturbed forests found in 2016 and 2017 matches the period when losses reached their highest levels in the region after the El Niño drought of 201625. As a result, a net cumulative loss of -0.37 ± 0.17 PgC was calculated for 2010-2020, resulting from sinks of 0.33 ± 0.13 and 0.33 ± 0.05 PgC in undisturbed and secondary forests, respectively, offset by sources of -0.06 ± 0.03, -0.42 ± 0.08 and -0.55 ± 0.04 PgC by other land covers, degraded forests, and deforested areas, respectively (Table S3).
Fig. 2: High-resolution reconstructed aboveground carbon (AGC) budget for the Amazon Biome over 2010-2020.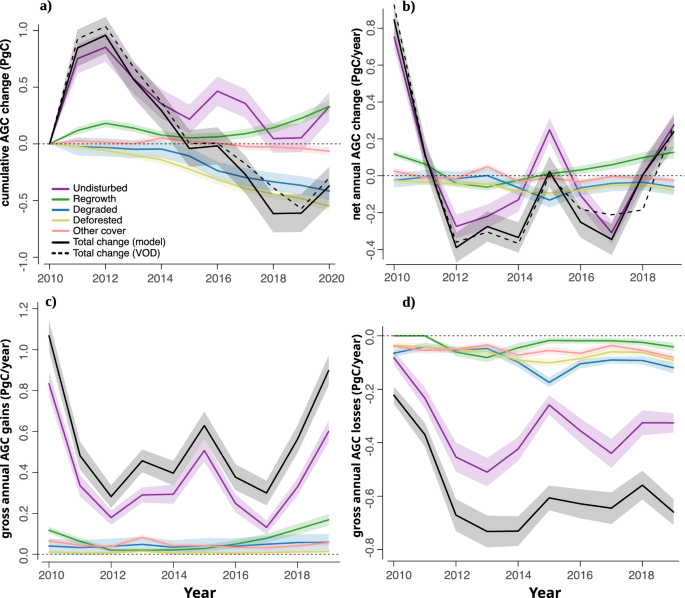
a, b Cumulative AGC change split by land cover category, and comparison against raw VOD (a), net annual AGC change per land cover category (b), gross annual AGC gains per land cover category (c), and gross annual AGC losses per land cover category (d). The gross AGC change corresponds to the separation of losses and gains within a land cover category. For visualization purposes, uncertainty bands correspond to 1 times the standard deviation in (a) and 0.5 times the standard deviation in (b), (c) and (d). In the case of annual changes, values assigned to “year” were calculated as Stock[year+1] – Stock[year]. The “Total change (VOD)” line refers to the original VOD budget at a coarse resolution, while the “Total change (model)” line refers to the reconstructed high-resolution budget.
The results can be compared to those from the bottom-up carbon accounting model to disentangle AGC changes of Fawcett et al. 11. Within the same simulation domain (Fig.S23), the annual source due to deforestation and sink from regrowth (Fig.S25) are lower than those of Fawcett et al. 11. Degradation contributed to net emissions of −34 ± 29 TgC year−1 and deforestation amounted to −45 ± 18 TgC year−1, while Fawcett et al. 11 predicted around −37 ± 27 for degradation in non-edge areas, −54 ± 15 in edge areas and −135 ± 44 TgC year−1 for deforestation. Our deforestation estimates, however, do not depart much from -57.1 TgC year−1 obtained as the product between the average AGC in undisturbed forests (i.e., 134.86 MgC ha−1, Table S6), average deforestation rate (i.e., 14,595 km2 year−1, Table S6), and the fraction of biomass lost after fire events in the Amazon estimated by Anderson et al. (i.e., 29.16%)33. Secondary forests represented a sink of 20 ± 38 TgC year−1, much lower than the 42 ± 2 TgC year−1 found by ref. 11. Undisturbed forests were a net sink with an average of 26 ± 267 TgC year−1, which is comparable to the sink in old-growth forests of 36 ± 197 TgC year−1 in11. Although informative, such a comparison is not conclusive due to methodological differences between the two works. Such differences comprise the use of different datasets to map deforestation, degradation and regrowth, and the distinction between edge and non-edge degradation in ref. 11, which is absent in the current work.
Gross annual AGC gains were 0.55 ± 0.26 PgC year−1 over 2010–2020 (Fig. 2c). This gross gain occurred mainly in undisturbed forests, responsible for a gain of 0.37 ± 0.21 PgC year−1, while the contribution of secondary forests was only 0.07 ± 0.05 PgC year−1, similar to that from the recovery of degraded forests of 0.04 ± 0.01 PgC year−1. These values correspond to an average gross annual accumulation rate of 1.3 ± 0.3, 16.3 ± 7.3, and 1.6 ± 0.2 MgC ha−1 year−1 by undisturbed, secondary and recovering degraded forest, respectively (Table S3). Gross AGC gains in non-forest land cover types (i.e., agriculture, savanna, shrubland, and non-vegetated areas26) and in previously and newly deforested areas were very small, with 0.05 ± 0.02 and 0.01 ± 0.003 PgC, respectively. The gross annual AGC loss was found to be −0.58 ± 0.16 PgC year−1 (Table S3) over the same period, most of which came from natural forest areas (−0.34 ± 0.13 PgC year−1), degraded forests (-0.09 ± 0.04 PgC year−1) and deforestation (−0.07 ± 0.02 PgC year−1). Other land cover types, −0.05 ± 0.02 PgC year−1, and secondary forests, -0.03 ± 0.03 PgC year−1, presented smaller gross losses. Our results align with those of27, which described that although forest degradation leads to lower losses per unit area compared to deforestation, it leads to higher total emissions due to the larger area affected6,27. Besides, degradation losses per unit area can increase over time, since forest degradation events occur repeatedly and can lead to deforestation. We calculated a contribution of degradation to the annual gross losses of 16 ± 8% (Fig. 2b-d), below the 30% of34, the 33.3% of selective logging in ref. 35 for drought years, but within the 18-40% range reported in local inventories and bookkeeping models27. The 65.6% contribution of gross losses by degradation reported by ref. 35 for non-drought years and the 73% found by another model using VOD data27 are close to the 56 ± 6% that we find as the proportion of losses due to degradation relative to the sum of degradation plus deforestation (Fig.S24, and Table S3).
Human influence and implications
Our attribution of AGC losses to natural or human-influenced land (see “Materials and Methods”) is presented in Fig. 3. Human-influenced lands were responsible for an annual gross loss of −242 ± 73 TgC year−1 and gain of 170 ± 65 TgC year−1, encompassing 43.0 ± 11.1% and to 33.5 ± 10.5% of the annual gross losses and gains, respectively (Fig. 3a). The share of losses in human-influenced land was exacerbated during El Niño episodes of 2010 and 201536,37, as shown by the red line of losses in Fig. 3a. A high impact in human-influenced areas also happened in 2019-2020, the peak of deforestation during the study period36. In terms of area affected, human activities influenced 147 104 km² out of the total 330 104 km² (i.e., 44.5%) that had AGC losses in 2020, and 165 104 km² out of the total 493 104 km² (i.e., 33.5%) that had AGC gains in 2020 (Fig. 3b). The analysis per political region (i.e., federative unit in Brazil due to its larger size, and country elsewhere) provides meaningful insights. The fraction of the total area with gains that is human-influenced has a one-to-one correspondence with the fraction of the total AGC gains that they represent (Fig. 3c and d, right). However, for the losses, the proportionality deviates from a one-to-one relationship (Fig. 3c and d, left), indicating a variable intensity of forest degradation and deforestation in human-influenced land in the Amazon biome (Section C7.1, Table S7). The results show that the share of AGC losses in human-influenced land increased at a faster pace than the share of area of such activities (Fig. 3e, and Table S8), pointing to a pattern of significantly increased land use intensity from the first half (−1.57 MgC ha−1 year−1) to the second half of the last decade (−1.85 MgC ha−1 year−1, Section C7.2). Such a pattern, however, was not evenly distributed, with increases in Central and Northern regions and decreases in Eastern and Western regions (Fig.S29).
Fig. 3: Annual changes in aboveground carbon (AGC) attributed to natural or human-influenced land and their corresponding spatial patterns.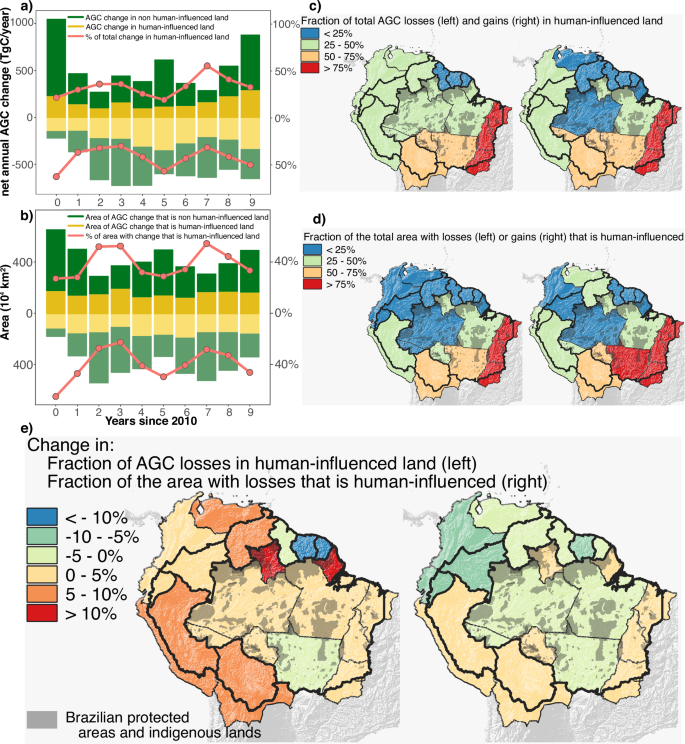
a–d Attribution of annual AGC change (a), attribution of area with AGC losses and gains (b); The share of total AGC losses [left] and gains [right] that happened in human-influenced land, averaged over 2015-2019 (c), and the share of the total area with losses [left] and gains [right] that were human-influenced land, averaged over 2015-2019 (d); Difference from the first to the second half of the decade in: the share of the total AGC losses that happened in human-influenced land [left], and the share of the total area with losses that were human-influenced land [right] (e). In the case of annual changes, values assigned to “year” were calculated as Stock[year+1] – Stock[year]. The “human-influenced” class corresponds to the sum of all classes except undisturbed forests.
The analysis suggests a significant role of human activities in the AGC dynamics in the Amazon from 2010 to 2020, with changes in regional patterns. Inside Brazilian protected areas and indigenous lands (BPAs, Fig. 3e and Fig.S23), average gross losses by degradation increased from -7.8 to -17.1 TgC year−1 from the first to the second half of the decade, while losses by deforestation increased from -4.9 to -6.8 TgC year−1. Outside BPAs, average losses by degradation increased from -27.7 to -56.7 TgC year−1 in the same period, and losses by deforestation increased from -37.7 to -53.7 TgC year−1 (Table S4 and Table S5). In terms of intensity, losses in all human-influenced land inside BPAs increased from −2.0 to −2.8 MgC ha−1 year−1 ( + 40%), while outside BPAs the increase was less pronounced, from −1.4 to −1.6 MgC ha−1 year−1 ( + 13%). The intensification of AGC losses within BPAs is worrisome and raises concerns about the future of the Amazon rainforest. Sustained degradation and deforestation can accelerate regional climate change38,39,40,41,42, thus amplifying climate-related AGC losses. The implementation of policies aimed at reducing emissions due to deforestation and degradation will remain difficult if not based on near real-time and trusted maps, but the present study, together with other recent contributions, e.g.43, shows that this goal is within reach.