
What’s happening in a dark tunnel in Northamptonshire might be the key to unlocking the next decade of aerodynamic design.

Red Bull Content Pool / George Marshall
Aerodynamic testing in cycling has always provided us with numbers, binary faster or slower responses, and inevitably more questions than answers. A wind tunnel, for instance, tells us total drag, a single value representing the sum of all aerodynamic forces acting on the rider and bike, from which we can calculate CdA (coefficient of aerodynamic drag).
Even computational fluid dynamics (CFD) can show airflow patterns, but it’s a simulation, and it struggles with friction drag, especially across textiles and fabrics. Without real-world validation, it’s hard to know which models to trust.
In other words, we can accurately measure how much drag there is, but not where it’s coming from, nor why. Until now.
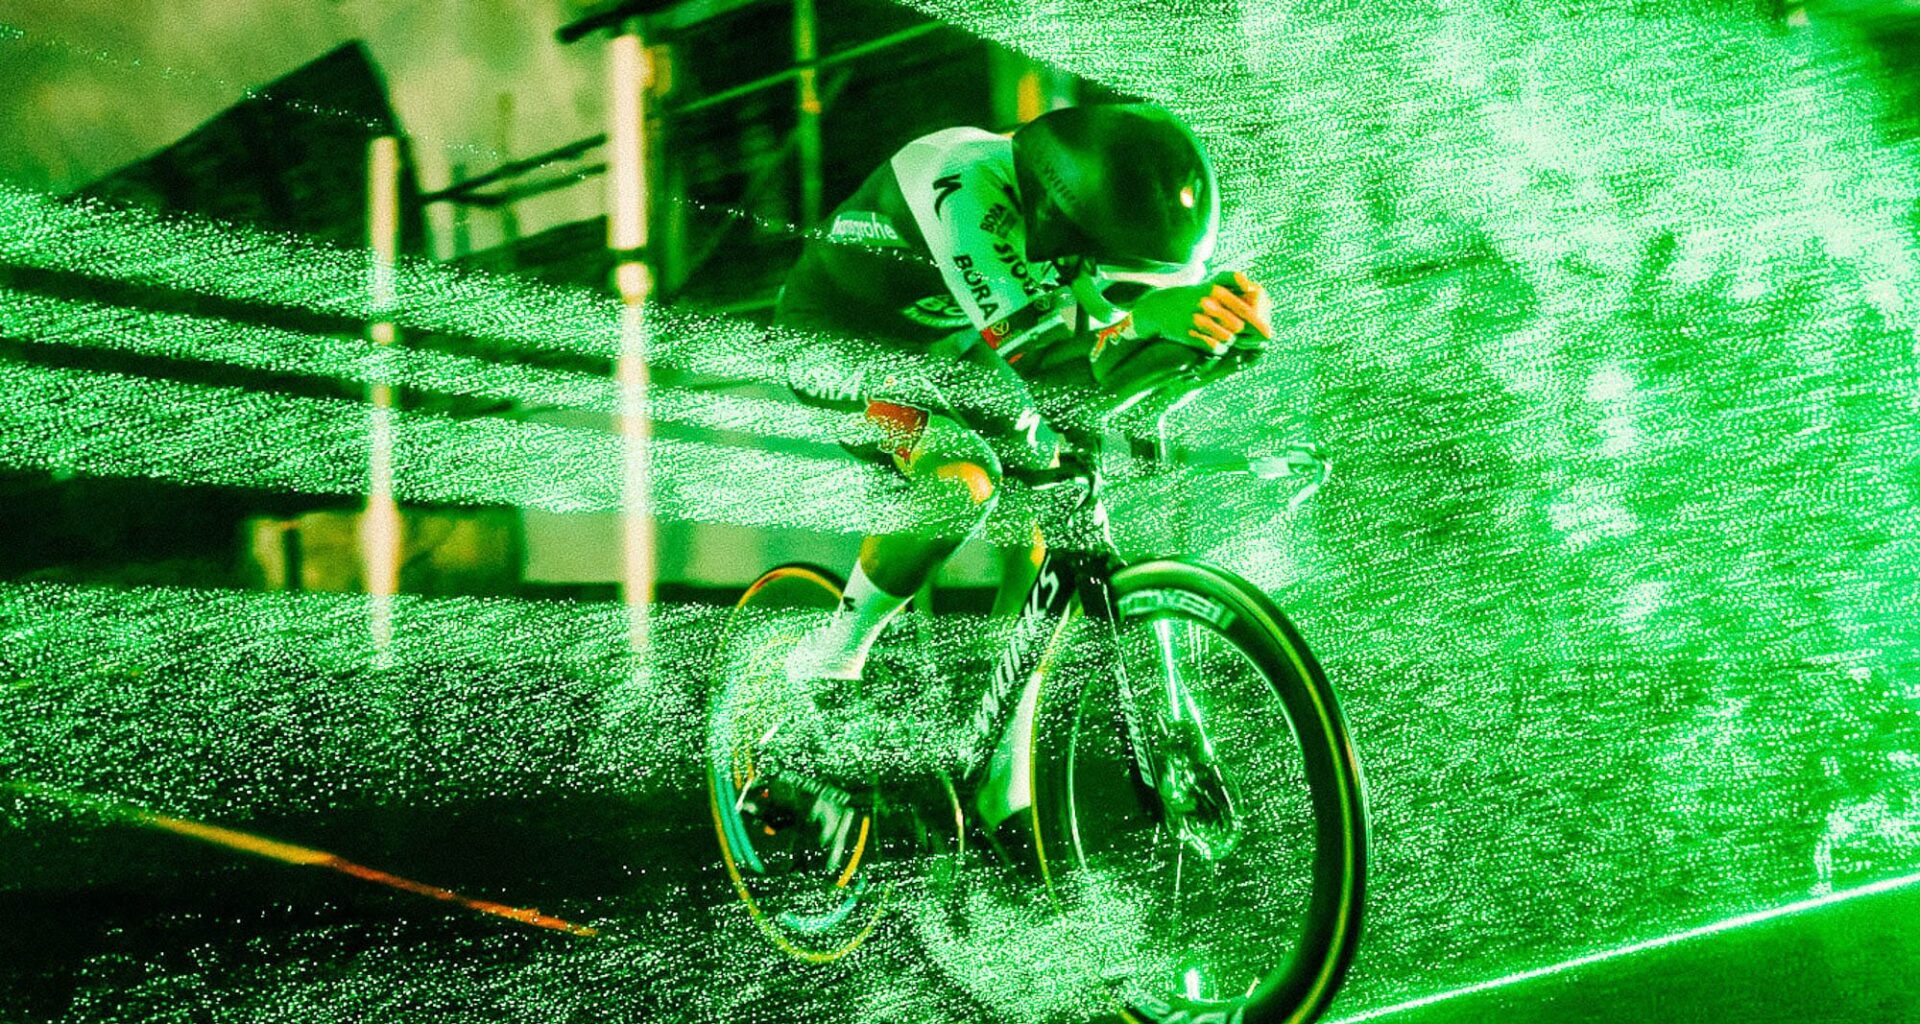
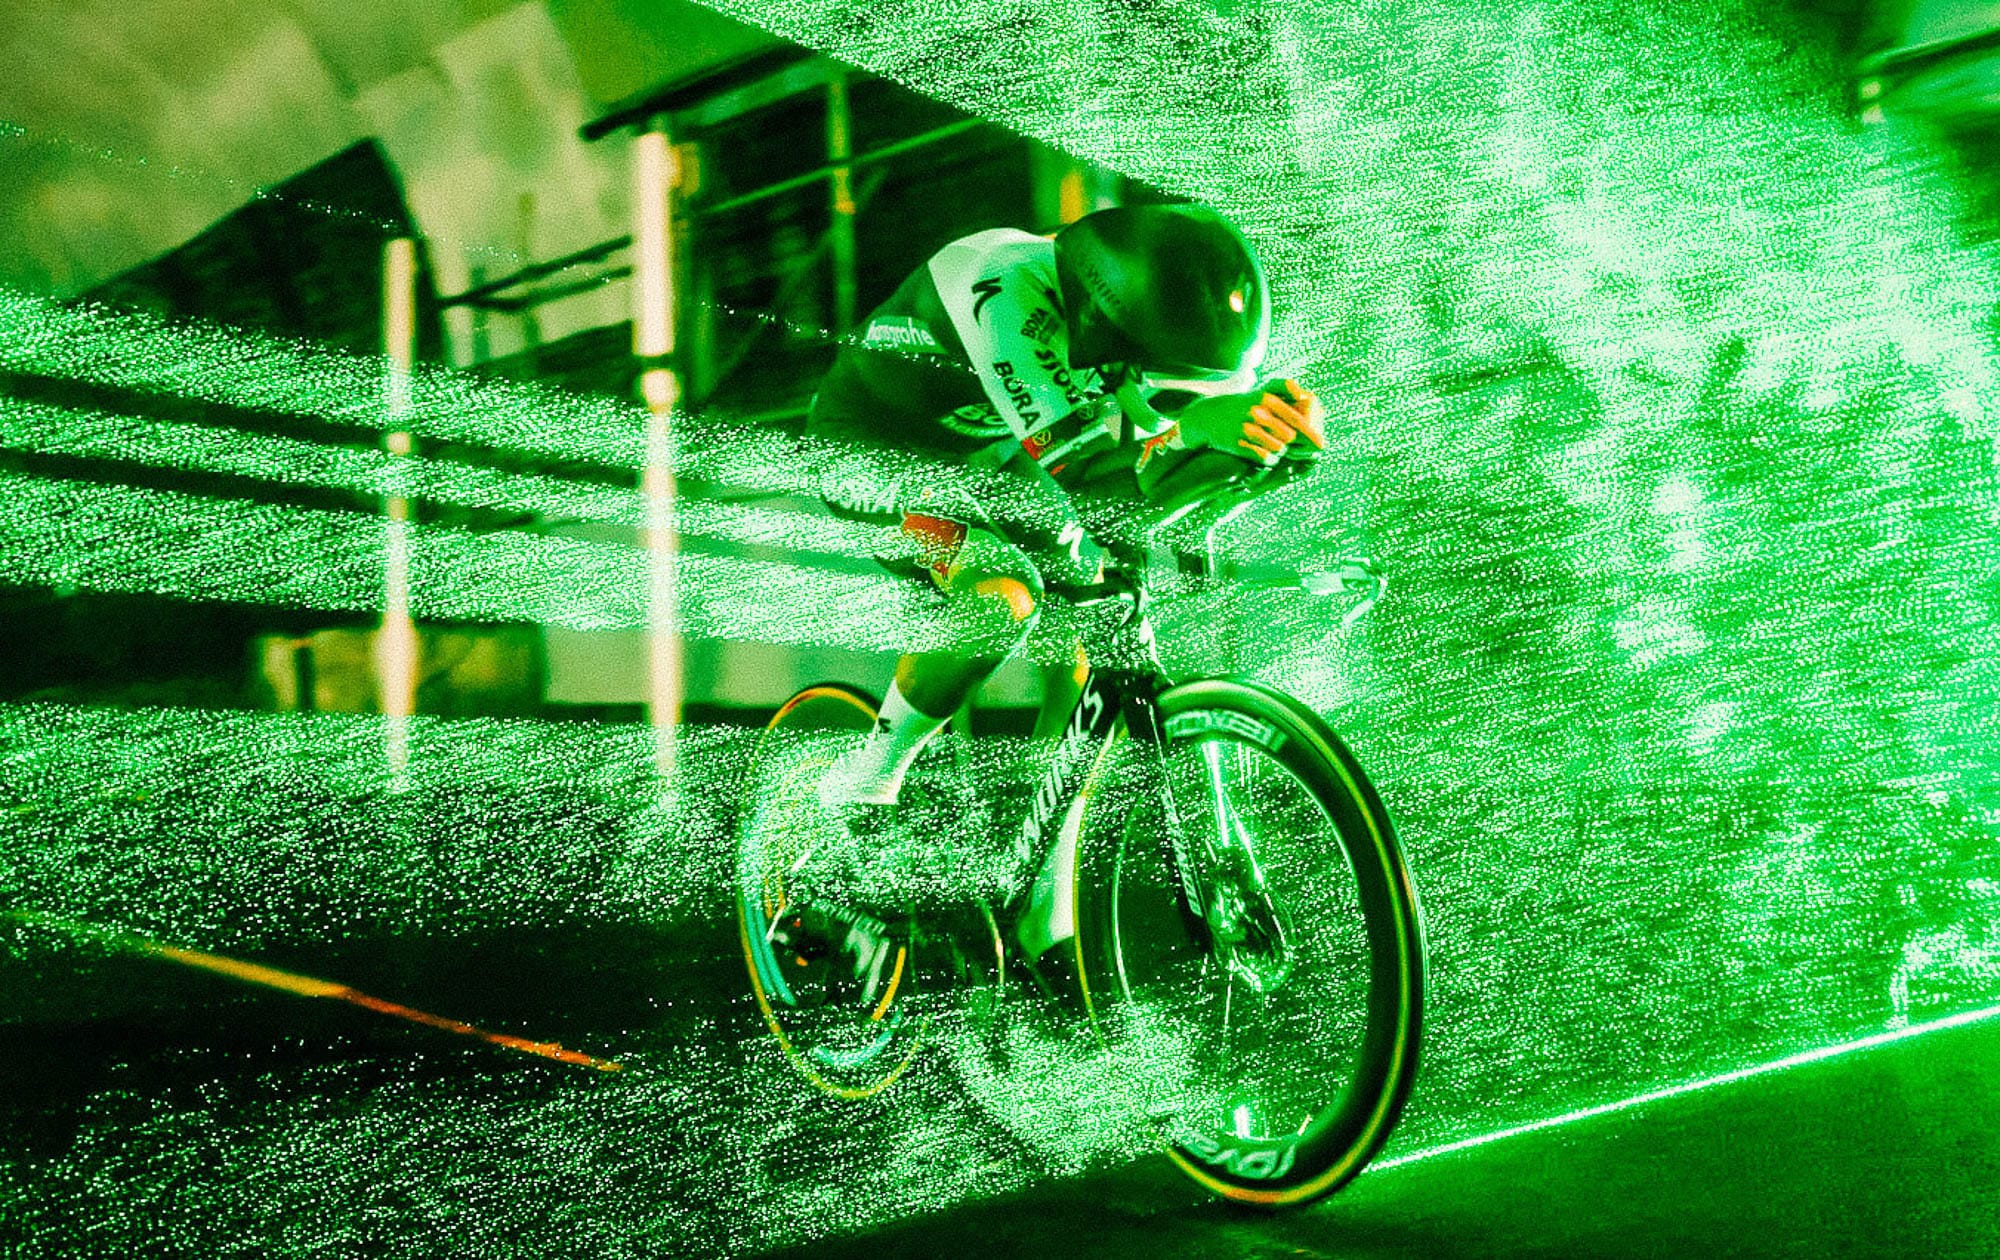
Dan Bigham and the Red Bull-Bora-Hansgrohe performance team have recently used particle image velocimetry (PIV), a laser-based imaging technique that visualises airflow in 3D to map the wake behind a rider.


At its simplest, PIV is a way of making air flows visible. It’s the same method that had CyclingSpy giddy on the Performance Process podcast earlier this year, and for good reason. PIV represents a potential step change in aerodynamic R&D, giving Bigham and Red Bull “full-field data” for the first time.
That phrase, “full-field data,” means they can now capture information across an entire plane of air around the rider and bike. PIV literally tracks the motion of thousands of tiny helium-filled particles displaced by a rider as they move through a sheet of laser light. From those movements, the team can reconstruct the velocity vectors, pressure distribution, and vorticity at every point in that plane.
That effectively gives the team a 3D visualisation of the wake, showing how air moves, where vortices form, how pressure recovers, and where energy is lost.
In short: while we’ve always known how much drag there is, with PIV, we can finally see where it is and why. And once we understand the why, new ways to go faster may start to reveal themselves.
We unpack all of this – lasers, bubbles, and the future of aero, in the full conversation with Bigham and the CyclingSpy on this week’s Performance Process podcast below.
So what exactly is PIV?
Bigham was giddy with excitement after the test. A pre-existing commitment meant I couldn’t take up an invite to attend, but Bigham had sent through a photo of himself standing in Catesby Tunnel, head to toe in black chalk with oversized laser goggles, surrounded by green laser wall, calling it “possibly the coolest moment” of his career.
The Catesby Tunnel isn’t a wind tunnel. Once a Victorian railway line cutting through the English countryside, it’s now a 2.7-kilometre-long sealed, perfectly straight testing facility that’s become a playground for motorsport engineers and cyclists chasing a repeatable semi-real-world test environment. Inside, the air is still, the temperature stable, and the environment repeatable, making it one of the world’s most precise venues for real-world aerodynamic testing.
This post is for paying subscribers only
Subscribe now
Already have an account? Sign in
Did we do a good job with this story?
👍Yep
👎Nope