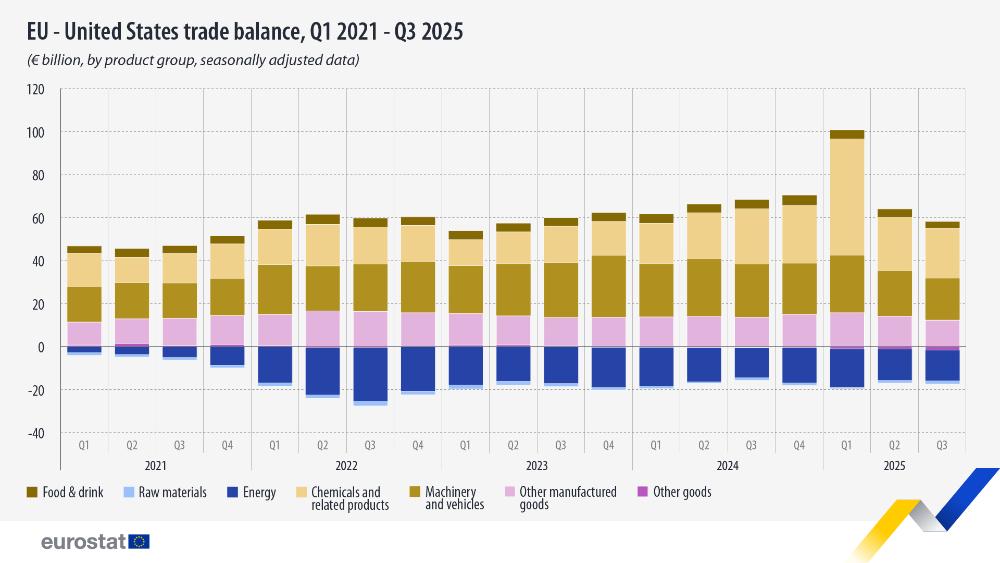
In the third quarter of 2025, the EU registered a €40.8 billion trade in goods surplus with the United States. This was a 13.3% decline from the €47.1 billion surplus recorded in the second quarter, and a substantial decline (49.7%) compared with the €81.2 billion trade surplus in the first quarter of 2025. The first quarter stood out as exports to the United States increased sharply in the light of potential tariffs from the United States.
In the third quarter of 2025, the EU recorded a trade surplus in chemicals and related products, machinery and vehicles, other manufactured goods and food and drink. In contrast, deficits were registered for energy, raw materials and other goods. The trade surplus for chemicals and related products decreased in the second and third quarters of 2025 (€24.7 and €23.0 billion surplus, respectively) after peaking in the first quarter of 2025 (€54.1 billion surplus) in the light of potential United States tariffs.
Source dataset: ext_st_eu27_2020sitc
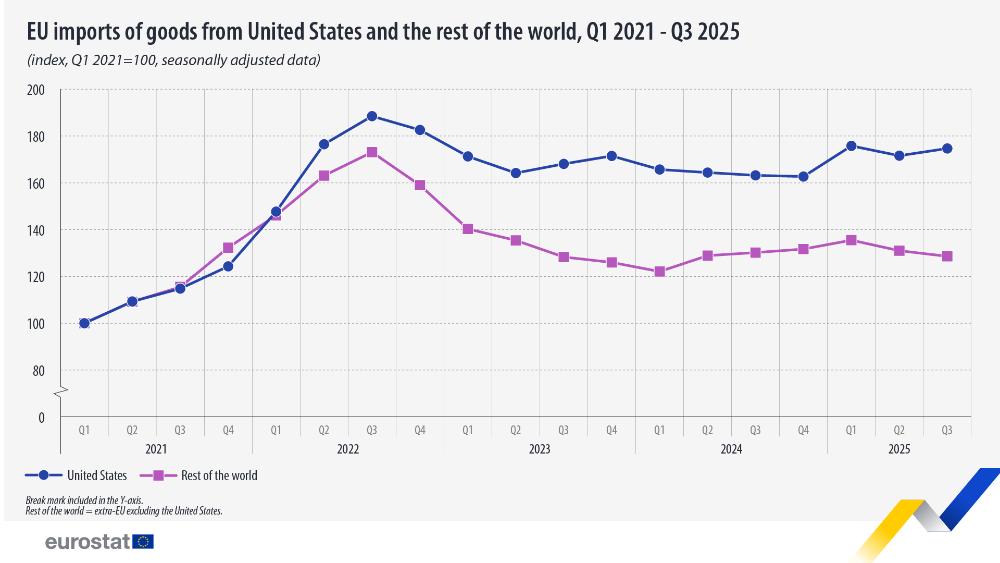
Since the first quarter of 2021, EU imports from the United States have followed a pattern similar to EU imports from the rest of the world until the second quarter of 2022. However, in the aftermath of Russia’s war of aggression against Ukraine, the EU increased the imports of energy products from the United States. As a result, imports from the United States grew more than those from the rest of the world and remained at a comparatively higher level.
Source dataset: ext_st_eu27_2020sitc


