
Data set
In this study, we modelled a data set consisting of 24 rows of information about the solubility of FBX (febuxostat) drug at different temperatures and pressures. Table 1 displays all of this information in its entirety with the values of inputs. The dataset is taken from Abourehab et al.19 that reported measurement of FBX solubility in supercritical CO2 at four temperature levels of 308, 318, 328, and 338 K. Also, the pressure of the system was set between 120 and 270 bar. The data has been also used by Hani et al.3 for building ML models and analysis of solubility behavior of FBX.
Table 1 Solubility values of FBX in ScCO219.
The overall modeling workflow of this research is shown in Fig. 1, and its building blocks are introduced in the following subsections. The first steps in handling modeling are data normalization and data division into training and testing. Normalization prevents the excessive effect of one of the two input parameters due to the higher variation range on the final output. The models that are introduced in detail are then optimized using the HHO algorithm in terms of their hyper-parameters to obtain the final models. Finally, the obtained models (both single mode and voting mode) are tested with test data that were not used in the training phase.
The implementation of machine learning regressive models and visualization were carried out using Python programming language (3.8 version) and “sklearn”, “numpy”, and “matplotlib” libraries in this study.
Fig. 1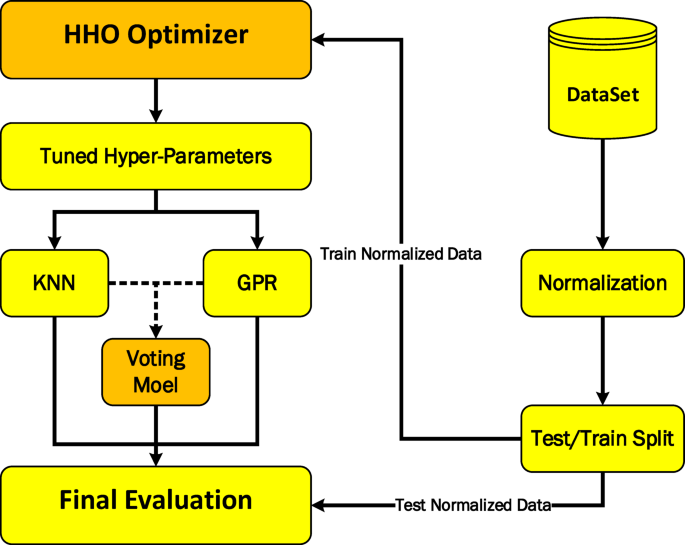
Overall workflow of this research for estimation of FBX solubility in ScCO2.
K-Nearest neighbors regression (KNN)
The foundation of this approach is a distance metric that is used to partition the dataset into manageable chunks. The parameters that affect the model’s performance were taken into account before its application could proceed. Therefore, these parameters can be optimized to boost the model’s efficiency. The model is optimized taking into account the number of neighbors, the weight of the points, the distance, and the p parameter associated with the Minkowski function. Grouping the dependent variable or response data into subsets is indicated by numbers in the vicinity. Uniform and weighted modes are established for the point weights in the model, where the latter is based on the distance between the points. The KNN model assigned equal importance to each data point, but the distance model gave more weight to points close by. Several different measures were utilized to quantify the distance in addition to the standard Euclidean distance (d0). Parameter optimization was performed using Euclidean, Manhattan, Minkowski, and Chebyshev relations in the subsequent equations20.
Gaussian process regression (GPR)
Gaussian process regression is an effective approach for modeling, exploring, and exploiting unknown functions21. As a relatively new statistical ML algorithm within the context of Bayesian formulation, Gaussian Process Regression (GPR) has recently garnered attention for its use in modeling thanks to its ability to employ probabilistic regression in the determination of hyperparameters for multidimensional, small, and nonlinear data sets22.
The term “Gaussian process” (GP) is used to describe a set of variables, some of which show Gaussian distributions and others that do not23,24. Appropriate measures of a GP’s quality include the mean, covariance, and function. In this procedure, Gaussian distributions (GDs) are widened. As part of this procedure, we use a matrix and a vector to symbolize the covariance and the mean, respectively25.
Voting regression
In addition to using standalone GPR and KNN models separately in this research, we have used the combined voting model by combining these two models as a novelty aspect of this paper. This model actually consists of Ng GPR models and Nk KNN models, which in the end will be the average output of all these Ng + Nk models. Therefore, for this model, in addition to the hyper-parameters of the models, we also need to tune the Ng and Nk values.
HHO algorithm
Optimizing hyper-parameters is one of the important activities in modeling physical systems with the help of ML models, while a wide range of optimizers have been developed so far such as Meta-heuristic methods26,27. One more original facet of this study is that the HHO method is responsible for this optimization.
The natural behavior of Harris hawks as prey and predator served as inspiration for the HHO algorithm, a bionic optimization algorithm. It’s great for figuring out tricky optimization issues28,29. This algorithm takes the scene’s dynamics and the prey’s potential to escape into account. Harris hawk behaviors such as foraging and scouting are modelled using a variety of position update strategies. The HHO algorithm, which is a hybrid of swarm and non-gradient optimization, consists of three phases: exploration, transition from exploration to exploitation, and exploitation30. HHO can easily have its initial regulating parameters determined due to its adaptable structure. Prior research28 conducted in-depth comparison studies between HHO and 12 other optimization techniques (such as GA, PSO, and DE algorithms) using the 29 benchmark functions.