
Identification of DEGs in asthma
Principal Component Analysis (PCA) revealed distinct differences in gene expression between asthma and control groups in the GSE179156 dataset (Fig. 2a). A total of 758 DEGs were identified using the Limma package, including 361 upregulated and 397 downregulated genes in asthma samples (P < 0.05, |Log2FC|≥ 0.58). A volcano plot summarizing the DEGs was generated and is shown in Fig. 2b. Hierarchical clustering analysis was performed, and the results were visualized with a heatmap (Fig. 2c).
Fig. 2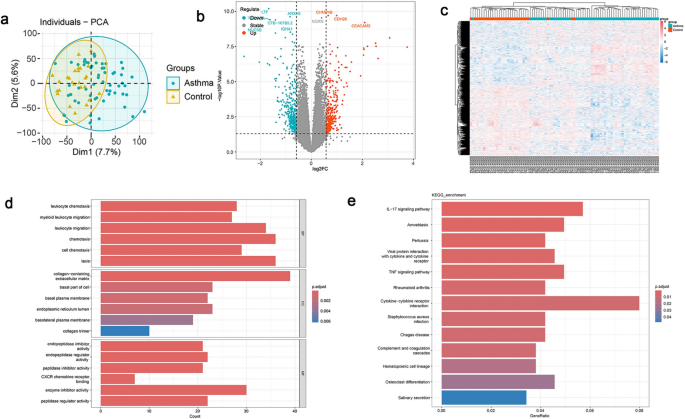
Screening differentially expressed genes (DEGs) in asthma. (a) Principal component analysis (PCA) illustrating distinct differences in gene expression between asthma and control groups in the GSE dataset. (b) Volcano plot highlighting upregulated and downregulated genes (n = 758, P < 0.05). (c) Heatmap of hierarchical clustering analysis showing the expression patterns of differentially expressed genes (DEGs) between asthma and control samples in GSE179156. (d) Gene Ontology (GO) enrichment analysis of DEGs in GSE 179,156, encompassing biological processes, cellular components, and molecular functions. (e) KEGG pathway enrichment analysis of DEGs in GSE 179,156, demonstrating the involvement of key signaling pathways.
GO and KEGG enrichment analyses were subsequently conducted. The GO analysis (Fig. 2d) indicated that DEGs were involved in biological processes (BP) such as taxis, chemotaxis, and leukocyte migration. For cellular components (CC), DEGs were enriched in the collagen-containing extracellular matrix, basal part of the cell, and basal plasma membrane. Molecular functions (MF) included enzyme inhibitor activity, peptidase regulator activity, and endopeptidase regulator activity. KEGG pathway analysis (Fig. 2e) demonstrated that DEGs were significantly enriched in pathways such as cytokine-cytokine receptor interaction, IL-17 signaling pathway, amoebiasis, pertussis, and TNF signaling pathway.
These enrichment analyses suggested that asthma pathogenesis involved intricate mechanisms, such as immune responses, inflammatory processes, and interactions between cytokines and their receptors, highlighting the complex systems underlying the disease.
Ferr-DEGs and correlation analysis
Intersecting the 758 asthma DEGs with 525 ferroptosis-related genes resulted in 21 overlapping genes, termed Ferr-DEGs (Fig. 3a). Spearman correlation analysis revealed associations among Ferr-DEGs (Fig. 3b). Chromosomal localization of these genes was mapped (Fig. 3c). GO enrichment analysis (Fig. 3d) showed that Ferr-DEGs were significantly enriched in biological processes, including ameboid-like cell migration, epithelial cell migration, smooth muscle proliferation, and cellular responses to metal ions, suggesting their potential roles in cellular motility and stress responses. KEGG analysis (Fig. 3e) indicated enrichment in pathways related to fluid shear stress and atherosclerosis, IL-17 signaling, lipid metabolism, AGE-RAGE signaling in diabetes, and Th17 differentiation. STRING database analysis demonstrated potential PPI among these genes (Fig. 3f).
Fig. 3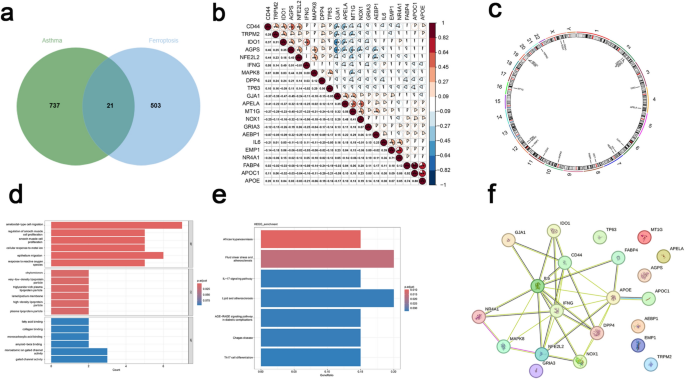
Screening ferroptosis related differentially expressed genes (Ferr-DEGs) in asthma. (a) Venn diagram illustrating the overlap between asthma-related DEGs and ferroptosis-related genes (Ferr-DEGs). (b) Heatmap showing the Spearman correlation among Ferr-DEGs. (c) Chromosomal landscape map displaying the specific locations of Ferr-DEGs. (d) GO analysis includes biological process, cellular component, and molecular function of Ferr-DEGs. (e) KEGG analysis of Ferr-DEGs. (f) Protein–protein interaction (PPI) network of Ferr-DEGs.
In asthma, ferroptosis-related pathways are closely associated with lipid peroxidation and iron ion accumulation. Elevated expression of molecules such as DMT1 and TFR1 in airway tissues promotes iron accumulation in epithelial cells, which triggers smooth muscle proliferation, enhances pro-inflammatory fibroblast activity, and stimulates excessive extracellular matrix production, ultimately driving airway remodeling27. Additionally, chronic airway inflammation further activates ferroptosis-related pathways, including the 15LO1-PEBP1 axis, exacerbating airway remodeling and sustaining inflammatory responses14. These findings highlight the critical role of ferroptosis in asthma pathogenesis, suggesting that investigating Ferr-DEGs could provide insights into the underlying molecular mechanisms and pave the way for the development of targeted therapeutic strategies.
Identification of asthma-specific genes
Lasso (Fig. 4b) identified 13 genes, including APELA, NOX1, EMP1, GRIA3, AEBP1, NR4A1, APOE, AGPS, TRPM2, CD44, NFE2L2, MAPK8, and DPP4 (λ1se = 0.06860). RF (Fig. 4d) ranked genes by importance and selected 10 genes with importance > 1.5, including APELA, MAPK8, AGPS, AEBP1, MT1G, GJA1, NOX1, IDO1, IL6, and APOC1. Boruta (Fig. 4e) identified 11 genes: APELA, MT1G, NOX1, GJA1, EMP1, AEBP1, NR4A1, AGPS, TRPM2, CD44, and MAPK8 ranked by significance. The intersection of the three methods yielded five genes: APELA, NOX1, AEBP1, AGPS, and MAPK8 (Fig. 4g). Multivariable logistic regression (Fig. 4h) confirmed that AGPS (OR 4.4099, P < 0.05) and APELA (OR 0.3359, P < 0.05) were significantly associated with asthma, establishing them as characteristic asthma genes.
Fig. 4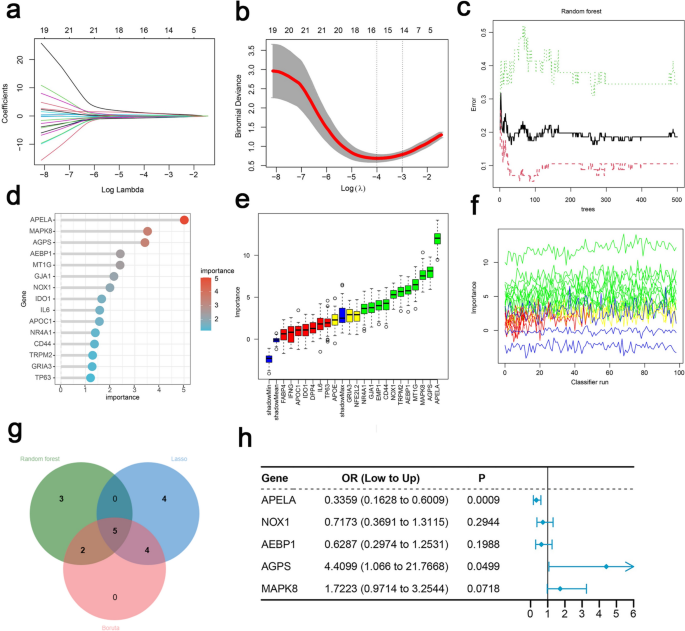
Identification of key genes in asthma using machine learning and Feature gene selection. (a) Coefficient profiles of variables in the LASSO regression model. (b) Ten cross-validation for turning parameter (λ) selection in the LASSO regression model. (c) The error rate curve of the Random Forest model as a function of the number of trees. (d) 10 genes with importance selected by Random Forest model. (e) Variable importance ranking in the Boruta algorithm. (f) The variation trend of Z-scores in the Boruta algorithm. (g) Venn diagram of RF, LASSO and BORUTA. (h) Multivariable logistic regression confirmed that AGPS and APELA were significantly associated with asthma.
GSEA analysis of characteristic genes
GSEA analysis of APELA and AGPS revealed their involvement in biological processes such as vascular and circulatory system development, immune regulation, and molecular function modulation. Pathways such as cytokine-cytokine receptor interactions and RAS signaling were also identified as significant. These findings suggested that these genes might play critical roles in cell development and the regulation of immune infiltration (Fig. 5a–c).
Fig. 5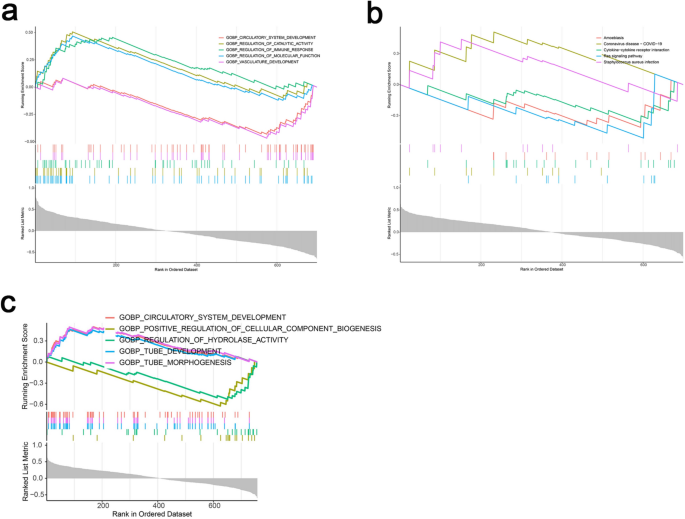
Single gene GSEA of characteristic genes. (a) GO results of GSEA enrichment analysis of AGPS. (b) KEGG results of GSEA enrichment analysis of AGPS. (c) GO results of GSEA enrichment analysis of APELA.
Notably, APELA was not included in the KEGG subset of the GSEA database. As a result, only GO enrichment analysis was performed for APELA, and KEGG enrichment analysis could not be conducted.
Diagnostic performance evaluation of characteristic genes
A nomogram constructed using the rms package evaluated the diagnostic performance of APELA and AGPS, demonstrating strong predictive capabilities (Fig. 6a). Calibration curves indicated high consistency between predicted and observed outcomes (Fig. 6b). Decision curve analysis (DCA) further highlighted the clinical applicability of the diagnostic model (Fig. 6c). AGPS expression was significantly upregulated in asthma patients, whereas APELA expression was downregulated (Fig. 6d). Receiver operating characteristic (ROC) analysis revealed robust diagnostic efficiency for AGPS (AUC = 0.805) and APELA (AUC = 0.830) (Fig. 6e,f). The combined nomogram achieved an AUC of 0.880, indicating high discriminative power (Fig. 6g).
Fig. 6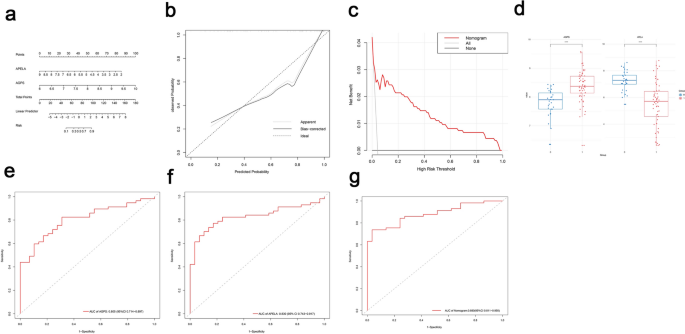
Construction of the diagnostic nomogram and diagnostic performance assessment. (a) The nomogram to predicted the diagnostic performance of APELA and AGPS. (b) The calibration curves of diagnostic performance. (c) Decision curve of diagnostic performance. (d) Expression of AGPS and APELA in GSE179156. (e) ROC curves of AGPS in GSE179156. (f) ROC curves of APELA in GSE179156. (g) ROC curves of AGPS and APELA in GSE179156.
External validation of the characteristic genes and nomogram
External validation datasets (GSE41861 and GSE104468) confirmed the findings, with AGPS and APELA demonstrating consistent expression patterns (Fig. 7d and h). The area under the curve (AUC) values further validated the diagnostic reliability of the model. In the GSE41861 dataset, AGPS achieved an AUC of 0.783, APELA reached 0.837, and the nomogram attained 0.859 (Fig. 7a–c). Similarly, in the GSE104468 dataset, AGPS showed an AUC of 0.743, APELA exhibited 0.833, and the nomogram achieved 0.882, underscoring the robustness of the diagnostic model (Fig. 7e–g).
Fig. 7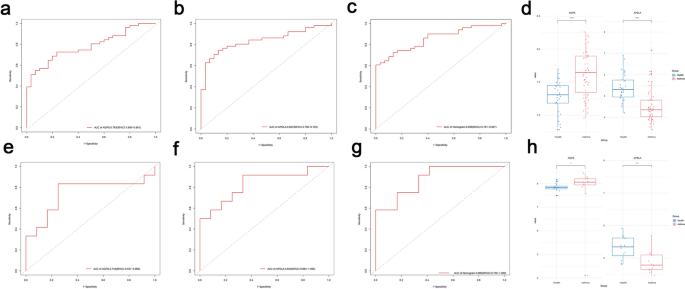
Evaluation of two characteristic genes in external datasets. (a) ROC curves of AGPS in GSE41861. (b) ROC curves of APELA in GSE41861. (c) ROC curves of AGPS and APELA in GSE41861. (d) Expression of AGPS and APELA in GSE41861. (e) ROC curves of AGPS in GSE104468. (f) ROC curves of APELA in GSE104468. (g) ROC curves of AGPS and APELA in GSE104468. (h) Expression of AGPS and APELA in GSE104468.
Immune infiltration analysis
Given the established connection between ferroptosis, immune dysregulation, and inflammation in asthma, immune cell infiltration was analyzed using the CIBERSORT algorithm. Figures 8a and b illustrated the proportional distribution of 22 immune cell subtypes across individual samples. Compared to controls, asthma samples exhibited significantly elevated proportions of naïve B cells, plasma cells, resting memory CD4 + T cells, activated dendritic cells, and resting mast cells (P < 0.05) (Supplementary Fig. 1). Spearman correlation analysis further revealed distinct associations between characteristic genes (AGPS and APELA) and immune cell subsets (Fig. 8c). Specifically, AGPS displayed positive correlations with naïve B cells and resting mast cells, whereas APELA showed negative correlations with these cell types (Fig. 8d–g). These findings underscored a potential mechanistic link between ferroptosis-mediated processes, immune cell dynamics, and asthma pathogenesis.
Fig. 8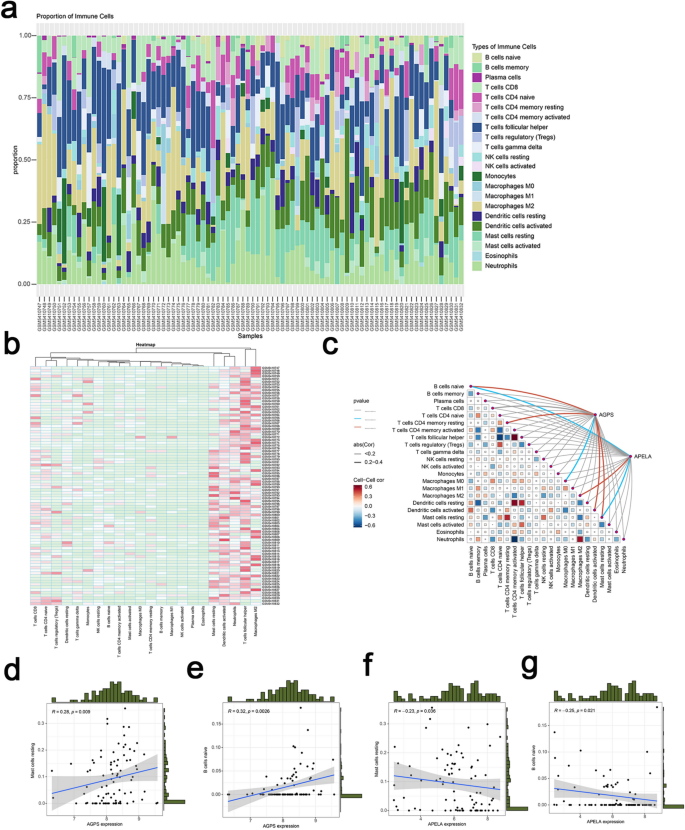
Immune cell infiltration analysis. (a,b) Immune Infiltration Analysis of GSE179156. (c) Spearman correlation between AGPS and APELA and 22 immune cells. (d) The correlation of AGPS and mast cells resting. (e) The correlation of AGPS and naive B cells. (f) The correlation of APELA and mast cells resting. (g) The correlation of APELA and naive B cells.
Identification of potential therapeutic compounds using CMAP
The data for upregulated Ferr-DEGs were uploaded to the CMap database. Since there were only nine upregulated genes among the Ferr-DEGs, the most significant upregulated DEG, CLCA1 (Log2FC = 3.75, P < 0.05) was included to the dataset for analysis. The top ten compounds negatively correlated with asthma were identified as potential therapeutic candidates: aripiprazole, BMS-927711, KU-55933, lomeguatrib, ORG-9768, oxprenolol, phenylbutyrate, riociguat, ZK-93426, and zonisamide. The 3D structures of these small molecules were retrieved from the PubChem database to facilitate further investigations (Supplementary file2).
Molecular docking and dynamics simulation of KU-55933 with AGPS
Molecular docking was performed between the ten previously identified potential compounds and the AGPS macromolecule. Six compounds showed binding energies greater than 5 kJ/mol: aripiprazole (7.61 kcal/mol), BMS-927711 (6.18 kcal/mol), KU-55933 (6.52 kcal/mol), ORG-9768 (5.67 kcal/mol), riociguat (5.33 kcal/mol), and zonisamide (5.5 kcal/mol), while the remaining four compounds exhibited binding energies below this threshold: lomeguatrib (4.82 kcal/mol), oxprenolol (3.41 kcal/mol), phenylbutyrate (4.26 kcal/mol), ZK-93426 (4.84 kcal/mol). Further analysis revealed that, except for KU-55933, none of the other compounds formed hydrogen bonds with the macromolecular protein. Consequently, only AGPS and KU-55933 were selected for subsequent analyses.
Molecular docking revealed strong binding affinity between KU-55933 and AGPS, with a binding energy of − 6.52 kcal/mol. Key interaction sites included hydrogen bonds formed with residues ARG-177 (2.11 Å), and GLU-285 (2.21 Å), highlighting the molecular stability of the complex (Fig. 9a). Molecular dynamics simulations confirmed the stability of the AGPS/KU-55933 complex, which achieved equilibrium after 90 ns with minimal structural fluctuations (RMSD ~ 13 Å) (Fig. 9b). Root mean square fluctuation (RMSF) values for AGPS residues remained mostly below 3 Å, further indicating a rigid and stable connection between KU-55933 and AGPS (Fig. 9c). Additional analyses of the radius of gyration (Rg) and solvent-accessible surface area (SASA) demonstrated a compact and stable interaction (Fig. 9d). On average, the complex maintained two hydrogen bonds (range: 0–4), reflecting strong hydrogen bonding interactions (Fig. 9e). Binding free energy calculations using the MM/PBSA method resulted in a value of -106.102 kJ/mol (− 25.359 kcal/mol), confirming the strong binding affinity and pharmacological potential of KU-55933. Key residues contributing to the interaction included PRO119, LEU506, and TYR505, underscoring the reliability of these findings and the therapeutic promise of KU-55933 in targeting ferroptosis pathways in asthma (Fig. 9f).
Fig. 9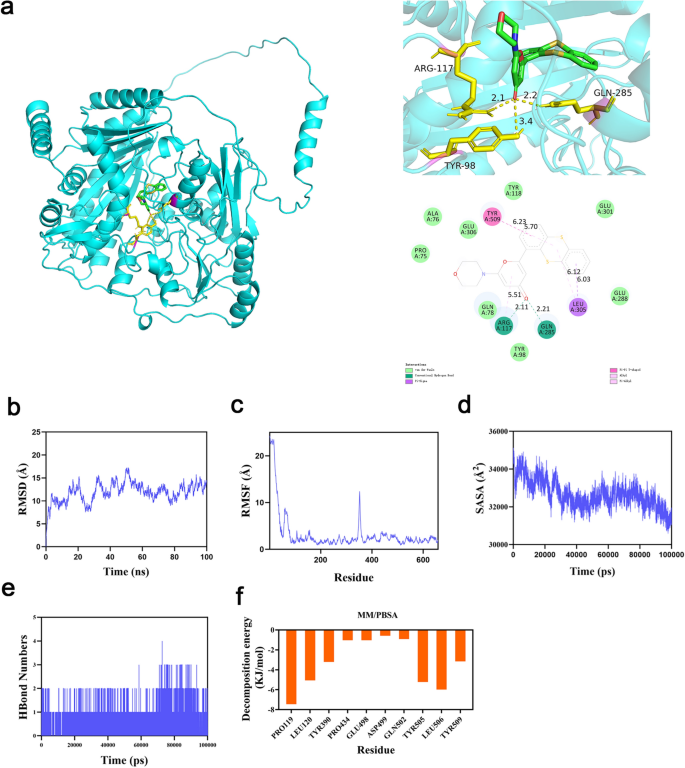
Molecular docking analysis and molecule dynamics. (a) Ligand–protein complexes formed between the AGPS and KU-55933 with hydrogen bonds forming at ARG-117 2.11 Å, and GLN-285 2.21 Å. (b) RMSD: The extent of atomic positional variation over time in protein complexes. (c) RMSF: The degree of deviation of atoms in protein complexes from their mean positions. (d) SASA: Solvent Accessible Surface Area. (e) Hydrogen Bond Formation. (f) MM/PBSA: The binding/interaction energy between ligands and receptors.
MC3805, a known AGPS inhibitor, had been reported to significantly reduce ether lipid levels in melanoma, breast cancer, and ovarian cancer cells28. However, previous studies28,29 had employed AGPS (pdb_00005adz) conformations inconsistent with those predicted by the UniProt database and AlphaFold3 (AF3). To address this discrepancy, molecular docking of MC3805 was performed with the AF3-predicted AGPS structure (AF-O00116-F1). The results demonstrated stable binding between MC3805 and AGPS, with a binding energy of − 5.65 kcal/mol (Supplementary Fig. 2–3), thereby validating the structural accuracy of the AF3-predicted AGPS conformation and supporting the reliability of molecular docking studies based on this model. Collectively, these findings underscored the therapeutic potential of AGPS-targeting inhibitors such as KU-55933 and MC3805, highlighting their potential as candidates for therapeutic development in asthma.