
When people talk about improving transit, they mention ambitious rail tunnels and shiny new trains. But they less often discuss the humble bus – which moves more people than rail in the US, the EU, and the UK – and whose ridership has bounced back more quickly after Covid than rail.1
The problem with buses is that they are slow. For example, buses in New York City and San Francisco crawl along at a paltry eight miles per hour, only about double walking speeds in the fastest countries. There are lots of ways to speed up buses, including bus lanes and busways, congestion pricing, transit-priority signals, and all-door boarding. But one of the most powerful solutions requires no new infrastructure or controversial charges and has minimal cost: optimizing where buses stop.
Get the print magazine
Subscribe for $100 to receive six beautiful issues per year.
Subscribe
Buses in some cities, particularly those in the US, stop far more frequently than those in continental Europe. Frequent stopping makes service slower, less reliable, and more expensive to operate. This makes buses less competitive with other modes, reducing ridership. This is why, despite having fewer bus stops, European buses have a higher share of total trips than American ones.
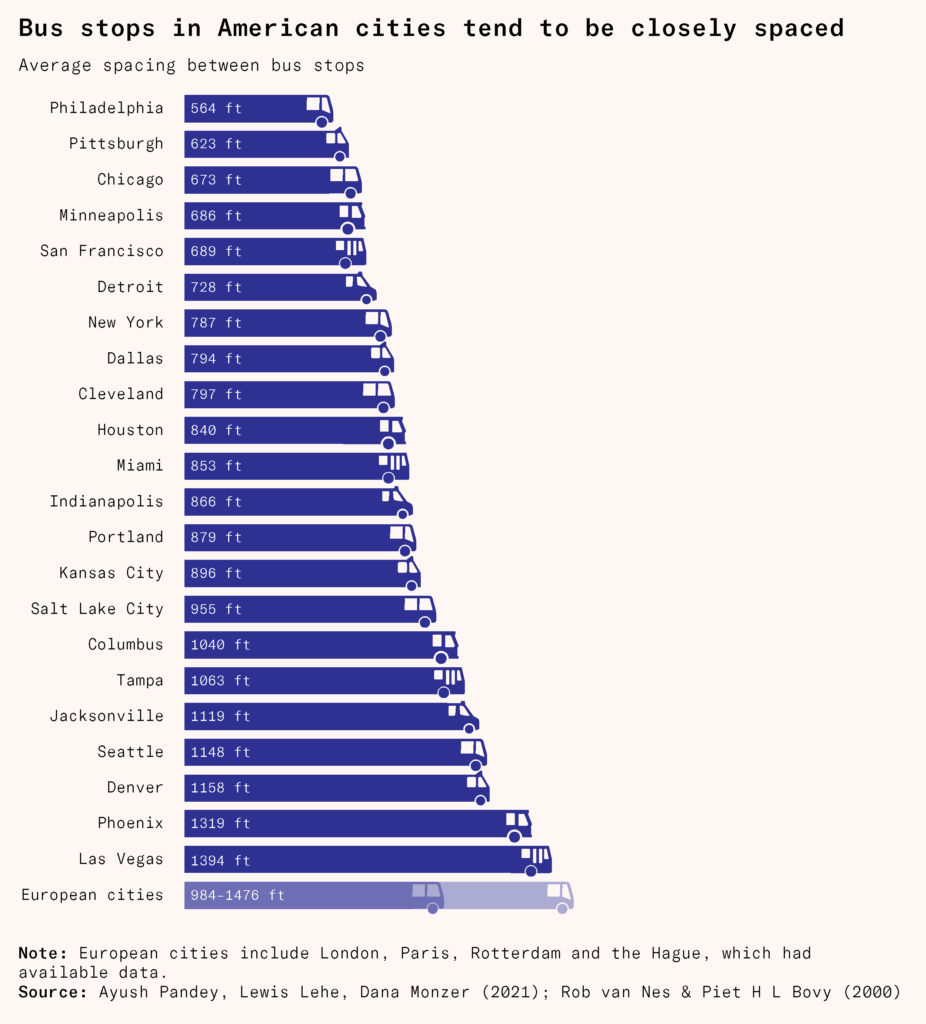
Bus stop balancing involves strategically increasing the distance between stops from 700–800 feet (roughly 210–240 meters; there are 3.2 feet in a meter), common in older American cities or in London, to 1,300 feet, closer to the typical spacing in Western Europe, such as in Hanover, Germany. Unlike many transit improvements, stop balancing can be implemented quickly, cheaply, and independently by transit agencies. By removing signs and updating schedules, transit agencies can deliver faster service, better reliability, and more service with the same resources.
American bus stops are too close together, driving low bus ridership
American bus stops are often significantly closer together than European ones. The mean stop spacing in the United States is around 313 meters, which is about five stops per mile. However, in older, larger American cities, stops are placed even closer. In Chicago, Philadelphia, and San Francisco, the average spacing drops down to 223 meters, 214 meters, and 248 meters respectively, meaning as many as eight stops per mile. By contrast, in Europe it’s more common to see spacings of 300 to 450 meters, roughly four stops per mile. An additional 500 feet takes between 1.5 and 2.5 minutes to walk at the average pace of 2.5 to 4 miles per hour.
Frequent stopping is part of a strategy that maximizes coverage – giving everyone some access to the bus – even at the expense of overall ridership, which is largely a function of how useful the bus is relative to other transport options. In England, where 28 percent of all bus passengers are on concessionary fares for age or disability, Prime Minister Margaret Thatcher is supposed to have said, ‘If a man finds himself a passenger on a bus having attained the age of 26, he can count himself a failure in life’. This pattern, of only those without good alternative options riding the bus, is especially pronounced in the US. But close stop spacing creates problems.
Close stop spacing slows buses down. When a bus stops, it loses time as passengers get on and off the bus (dwell time). The bus also needs to decelerate and accelerate; it may need to kneel (hydraulically lower itself to the floor and back up again to let strollers, wheelchairs, and mobility vehicles on); it may need to leave traffic and return into traffic; and it may miss a light cycle (non-dwell time). Buses spend about 20 percent of their time stopping then starting again.
Slow buses make transit less competitive with driving and reduce the number of places riders can get to in a given amount of time, making the network less useful.
Labor is transit agencies’ largest cost. For example, close to 70 percent of the 2026 operating budget of Washington DC’s transit system will go toward labor and associated fringe benefits and overhead. Drivers are paid by the hour. Thus, slow buses increase the cost of running services, reducing the amount of service that agencies can run.
Close stop spacing also creates lower quality bus stops. In the US, the sheer number of bus stops means that agencies can’t invest meaningfully in each one. This results in many stops being ‘little more than a pole with a sign’, lacking basic amenities like shelters, benches, or real-time arrival information. Uneven and cracked sidewalks and a lack of shelter or seating present a particular challenge for elderly and disabled riders.
By contrast, a bus stop in a French city like Marseille will have shelters and seating by default. Higher quality stops in the city also include real time arrival information, better lighting for safety, level boarding platforms, curb extensions that prevent illegal parking at bus stops, and improved pedestrian infrastructure leading to the stops. Marseille is not a particularly wealthy French city, but because it has wider stop spacing and fewer stops, it can invest more money into each one.
Stop balancing addresses these issues and more
Many of the solutions to these problems require money – running more buses, improving stop amenities, or upgrading signals – or the political will to take away street space for busways and transit lanes. But stop balancing can have a meaningful impact on these issues for a fraction of the price.
Bus stop balancing saves riders’ time. Riders save between 12 and 24 seconds per stop removed. San Francisco saw a 4.4 to 14 percent increase in travel speeds (depending on the trip) by decreasing spacing from six stops per mile to two and a half. Vancouver’s transit operator ran a stop-balancing pilot that removed a quarter of stops and saved passengers five minutes on average and ten minutes on the busiest trips. Portland saw a six percent increase in bus speeds from a project which increased average stop spacing by just 90 feet.
Limited stop services – aggressive forms of stop consolidation, effectively express buses – can see even more impressive savings. Los Angeles saw operating speeds increase by 29 percent and ridership by 33 percent on its Wilshire/Whittier Metro Rapid corridor. Washington DC pursued a limited stop service on its Georgia Avenue Line that increased speeds by 22 percent in the base and 26 percent in the peak. Colombia’s Bus Rapid Transit, based on this idea, is famous worldwide.
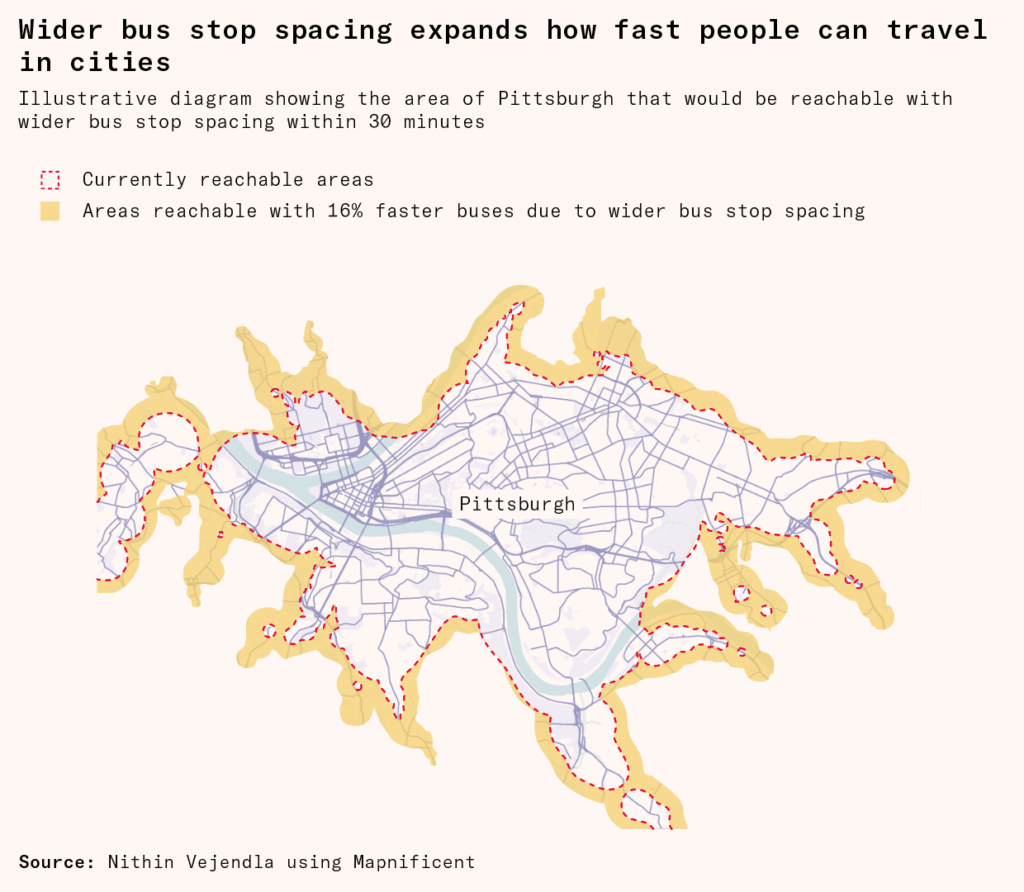
Because stop balancing speeds up buses it can actually increase the access of the transit network.
Access may be thought of in terms of the number of access points to the system, for example the number of bus stops or metro stations. But planners also think about access in terms of where the system can take you. This idea can be visualized as isochrones – shape maps that show the distance one can travel in a set time. By speeding buses up, stop balancing actually increases the number of destinations reachable within a given timeframe.
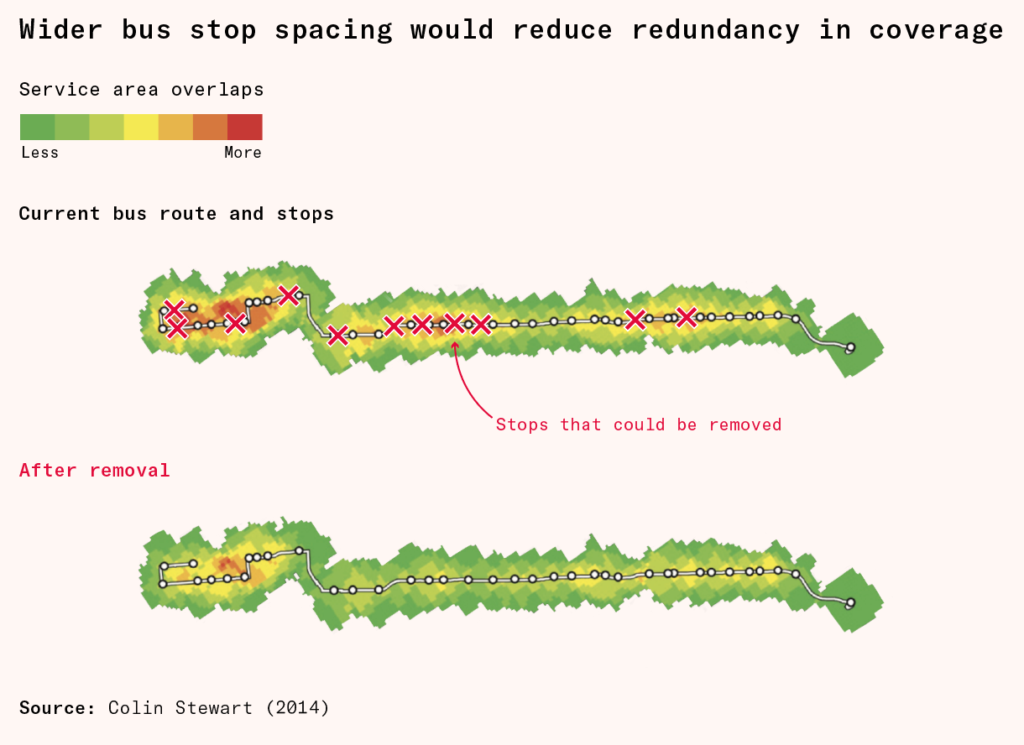
Stop balancing need not even reduce the number of access points much. Many North American bus stops have overlapping ‘walksheds’ (the areas within walkable distance of them) and are competing with each other. The combination of many stops and a street grid means that many riders have two or more stops that they can use, so that closing one only requires a marginally longer walk to the next.
A McGill study found that even substantial stop consolidation only reduced system coverage by one percent. A different study modeled a stop balancing proposal for San Luis Obispo, and found that even a 44 percent reduction in stops would have only a 13 percent reduction in coverage area. New York’s transit authority increased the distance between stops on a local route from ten to seven stops per mile (a 42 percent increase in distance between stops) but estimated that the average walking distance went up by only 12 percent.
Buses that move more quickly can traverse their routes more times per day. That means that achieving the same frequency requires fewer drivers as the speed of the journey goes up. Because labor is the largest expense of running a service, faster buses are cheaper to run.
You can determine the peak number of vehicles (and therefore the number of operators on a route) by dividing the time needed for a full round trip (including the layover) by the desired interval between every bus.
Layover varies by operating company but is usually a fifth of round trip travel time, subject to a minimum for short routes (something like ten minutes).
In Vancouver, stop balancing on one route saved the transit operator $700,000 CAD (about $500,000) in annual operating costs owing to peak vehicle savings. They estimate they will save a further $3.5 million each year by cutting stops across their 25 most frequent routes. In the study from McGill on Montreal’s operator, stop balancing had the potential to ‘save a bus’ (reduce the total buses needed each day by one) on 44 routes.
These savings can be reinvested to improve service frequency on those routes or elsewhere in the system. Or they can prevent a bus service from having to reduce frequency when facing budget cuts.
Beyond speed, stop balancing improves reliability. Each potential stopping point introduces uncertainty. When stops are closer together, this uncertainty multiplies by spreading passengers out between locations, making it difficult for agencies to provide accurate schedules.
Vancouver found that stop balancing improved the reliability of Line 2, especially on the slowest trips. This helps passengers plan their journeys and agencies maintain more accurate schedules, reducing the need for excess recovery time at the end of routes. If agencies want to maximize the benefit of stop balancing on reliability, they can incorporate passenger boarding variability into their stop consolidation program, as McGill University did in their proposal for Montreal’s Bus Network.
For passengers, improved reliability may be even more valuable than speed. Studies show that waiting time feels two to three times longer to passengers than in-vehicle time, and unpredictable waits feel longer still. By making bus arrival times more predictable, stop balancing directly addresses one of the most frustrating aspects of bus travel. Operators tend to favor these changes as well, describing stop balancing as helpful for staying on schedule.
With fewer stops per mile, European agencies can create high-quality waiting environments that are prominently displayed on transit maps similar to rail stations. This enhances the visibility and permanence of the bus network, potentially supporting development along transit corridors. With stop balancing, North American agencies could do the same.
Bus stop balancing is a rare example of a transit reform that is at once fast, cheap, and effective. Fewer, better-placed stops can improve the speed and reliability of buses, while freeing up resources to improve the stops that remain. In practice, that can mean the difference between a service people tolerate and one they’re happy to use.