

Feb 2, 2026
IndexBox has just published a new report: U.S. – Thiosulphates – Market Analysis, Forecast, Size, Trends And Insights.
This article provides a comprehensive analysis of the United States thiosulphates market. It details a significant drop in domestic consumption in 2024 to 3.2K tons, contrasted with stable high production of 88K tons, leading to massive net exports of 93K tons. The market is forecast to grow modestly through 2035 with a volume CAGR of +1.5% and a value CAGR of +3.0%. Key trade dynamics show Vietnam as the dominant import supplier by value, while Mexico is the largest export destination by volume, with Turkey being a high-value export market. The analysis covers price trends, major trading partners, and historical performance from 2013.
Key Findings
US thiosulphates consumption collapsed in 2024, falling -87.8% to 3.2K tons, while production remained high at 88K tonsThe market is forecast for slow growth, with a +1.5% volume CAGR and +3.0% value CAGR projected from 2024 to 2035The US is a massive net exporter, with 2024 exports surging 33% to 93K tons, primarily to Mexico, Canada, and HondurasVietnam is the leading import source by value ($6.4M), while import prices from China are the lowest at $360 per tonExport prices vary extremely, from $124 per ton to Honduras to $6,385 per ton to Turkey, indicating product or grade differencesMarket Forecast
Driven by rising demand for thiosulphates in the United States, the market is expected to start an upward consumption trend over the next decade. The performance of the market is forecast to increase slightly, with an anticipated CAGR of +1.5% for the period from 2024 to 2035, which is projected to bring the market volume to 3.7K tons by the end of 2035.
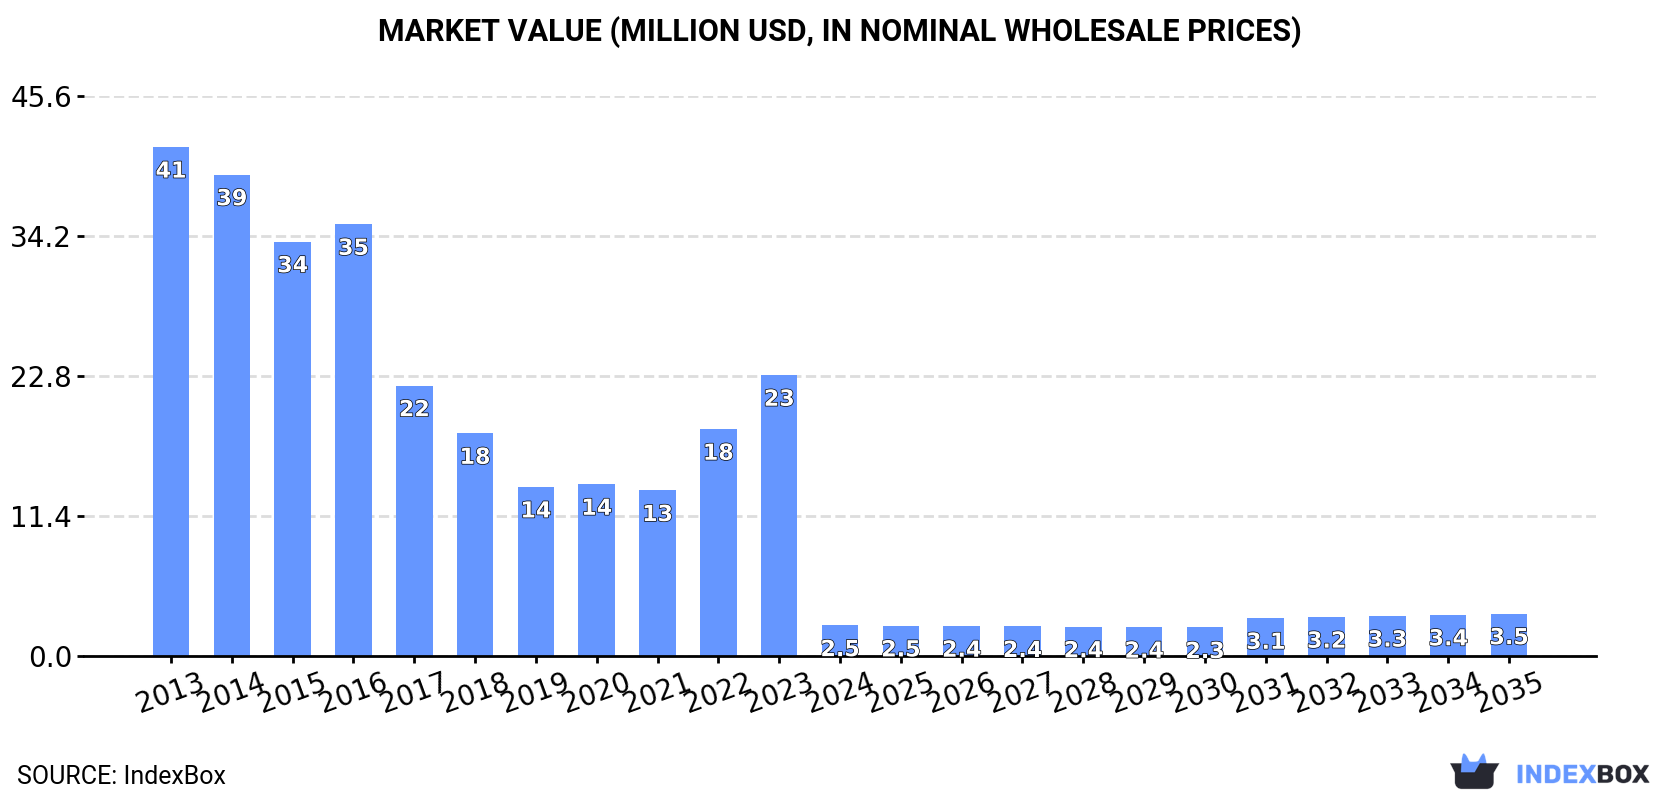
In value terms, the market is forecast to increase with an anticipated CAGR of +3.0% for the period from 2024 to 2035, which is projected to bring the market value to $3.5M (in nominal wholesale prices) by the end of 2035.
 ConsumptionUnited States’s Consumption of Thiosulphates
In 2024, thiosulphates consumption in the United States reduced remarkably to 3.2K tons, waning by -87.8% on the year before. Over the period under review, consumption recorded a sharp curtailment. Thiosulphates consumption peaked at 71K tons in 2013; however, from 2014 to 2024, consumption failed to regain momentum.
The revenue of the thiosulphates market in the United States shrank significantly to $2.5M in 2024, with a decrease of -89.1% against the previous year. This figure reflects the total revenues of producers and importers (excluding logistics costs, retail marketing costs, and retailers’ margins, which will be included in the final consumer price). Overall, consumption saw a significant decline. Thiosulphates consumption peaked at $41M in 2013; however, from 2014 to 2024, consumption failed to regain momentum.
ProductionUnited States’s Production of Thiosulphates
In 2024, production of thiosulphates in the United States reached 88K tons, remaining constant against the year before. Over the period under review, production saw a relatively flat trend pattern. The pace of growth appeared the most rapid in 2020 when the production volume increased by 1%. Thiosulphates production peaked at 88K tons in 2022; however, from 2023 to 2024, production failed to regain momentum.
In value terms, thiosulphates production shrank slightly to $41M in 2024. Overall, the total production indicated mild growth from 2013 to 2024: its value increased at an average annual rate of +1.2% over the last eleven years. The trend pattern, however, indicated some noticeable fluctuations being recorded throughout the analyzed period. Based on 2024 figures, production increased by +65.4% against 2020 indices. The pace of growth was the most pronounced in 2022 when the production volume increased by 25% against the previous year. Thiosulphates production peaked at $41M in 2023, and then reduced in the following year.
ImportsUnited States’s Imports of Thiosulphates
Thiosulphates imports into the United States stood at 8K tons in 2024, with an increase of 5.5% against the previous year. Overall, imports, however, recorded a slight descent. The most prominent rate of growth was recorded in 2016 with an increase of 35%. Imports peaked at 15K tons in 2022; however, from 2023 to 2024, imports failed to regain momentum.
In value terms, thiosulphates imports fell to $8.3M in 2024. In general, total imports indicated temperate growth from 2013 to 2024: its value increased at an average annual rate of +3.0% over the last eleven-year period. The trend pattern, however, indicated some noticeable fluctuations being recorded throughout the analyzed period. Based on 2024 figures, imports increased by +72.6% against 2021 indices. The most prominent rate of growth was recorded in 2022 when imports increased by 72%. Imports peaked at $9.3M in 2023, and then declined in the following year.
Imports By Country
Vietnam (4.2K tons), China (3K tons) and India (447 tons) were the main suppliers of thiosulphates imports to the United States, with a combined 95% share of total imports. These countries were followed by Germany, which accounted for a further 1.1%.
From 2013 to 2024, the most notable rate of growth in terms of purchases, amongst the main suppliers, was attained by Germany (with a CAGR of +33.9%), while imports for the other leaders experienced more modest paces of growth.
In value terms, Vietnam ($6.4M) constituted the largest supplier of thiosulphates to the United States, comprising 77% of total imports. The second position in the ranking was taken by China ($1.1M), with a 13% share of total imports. It was followed by India, with a 3.7% share.
From 2013 to 2024, the average annual growth rate of value from Vietnam totaled -5.3%. The remaining supplying countries recorded the following average annual rates of imports growth: China (-13.5% per year) and India (+5.2% per year).
Import Prices By Country
The average thiosulphates import price stood at $1,029 per ton in 2024, with a decrease of -15.8% against the previous year. Overall, the import price, however, posted a prominent expansion. The pace of growth appeared the most rapid in 2023 when the average import price increased by 117% against the previous year. As a result, import price reached the peak level of $1,222 per ton, and then fell significantly in the following year.
There were significant differences in the average prices amongst the major supplying countries. In 2024, amid the top importers, the country with the highest price was Germany ($1,893 per ton), while the price for China ($360 per ton) was amongst the lowest.
From 2013 to 2024, the most notable rate of growth in terms of prices was attained by India (+0.9%), while the prices for the other major suppliers experienced a decline.
ExportsUnited States’s Exports of Thiosulphates
After two years of decline, shipments abroad of thiosulphates increased by 33% to 93K tons in 2024. In general, exports continue to indicate buoyant growth. The pace of growth was the most pronounced in 2017 when exports increased by 81% against the previous year. The exports peaked in 2024 and are expected to retain growth in years to come.
In value terms, thiosulphates exports skyrocketed to $49M in 2024. Over the period under review, exports continue to indicate resilient growth. The most prominent rate of growth was recorded in 2017 when exports increased by 41%. The exports peaked in 2024 and are expected to retain growth in the near future.
Exports By Country
Mexico (57K tons) was the main destination for thiosulphates exports from the United States, accounting for a 61% share of total exports. Moreover, thiosulphates exports to Mexico exceeded the volume sent to the second major destination, Canada (14K tons), fourfold. The third position in this ranking was held by Honduras (7.1K tons), with a 7.7% share.
From 2013 to 2024, the average annual rate of growth in terms of volume to Mexico amounted to +18.1%. Exports to the other major destinations recorded the following average annual rates of exports growth: Canada (+3.4% per year) and Honduras (+83.9% per year).
In value terms, Mexico ($15M), Turkey ($15M) and Canada ($6.7M) were the largest markets for thiosulphates exported from the United States worldwide, with a combined 76% share of total exports. Uruguay, Honduras, Argentina and France lagged somewhat behind, together comprising a further 6.6%.
Among the main countries of destination, Uruguay, with a CAGR of +86.2%, saw the highest rates of growth with regard to the value of exports, over the period under review, while shipments for the other leaders experienced more modest paces of growth.
Export Prices By Country
In 2024, the average thiosulphates export price amounted to $522 per ton, waning by -1.8% against the previous year. Over the period under review, the export price, however, showed a mild increase. The pace of growth was the most pronounced in 2022 when the average export price increased by 44% against the previous year. Over the period under review, the average export prices reached the maximum at $532 per ton in 2023, and then contracted in the following year.
Prices varied noticeably by country of destination: amid the top suppliers, the country with the highest price was Turkey ($6,385 per ton), while the average price for exports to Honduras ($124 per ton) was amongst the lowest.
From 2013 to 2024, the most notable rate of growth in terms of prices was recorded for supplies to Turkey (+38.3%), while the prices for the other major destinations experienced mixed trend patterns.
Source: IndexBox Market Intelligence Platform
This report provides a comprehensive view of the thiosulphates industry in the United States, tracking demand, supply, and trade flows across the national value chain. It explains how demand across key channels and end-use segments shapes consumption patterns, while also mapping the role of input availability, production efficiency, and regulatory standards on supply.
Beyond headline metrics, the study benchmarks prices, margins, and trade routes so you can see where value is created and how it moves between domestic suppliers and international partners. The analysis is designed to support strategic planning, market entry, portfolio prioritization, and risk management in the thiosulphates landscape in the United States.
Quick navigation
Key findings
Domestic demand is shaped by both household and industrial usage, with trade flows linking local supply to imports and exports.
Pricing dynamics reflect unit values, freight costs, exchange rates, and regulatory shifts that affect sourcing decisions.
Supply depends on input availability and production efficiency, creating a distinct national cost curve.
Market concentration varies by segment, creating different competitive landscapes and entry barriers.
The 2035 outlook highlights where capacity investment and demand growth are most aligned within the country.
Report scope
The report combines market sizing with trade intelligence and price analytics for the United States. It covers both historical performance and the forward outlook to 2035, allowing you to compare cycles, structural shifts, and policy impacts.
Market size and growth in value and volume terms
Consumption structure by end-use segments
Production capacity, output, and cost dynamics
Trade flows, exporters, importers, and balances
Price benchmarks, unit values, and margin signals
Competitive context and market entry conditions
Product coverageProdcom 20134135 – ThiosulphatesCountry coverageCountry profile and benchmarks
This report provides a consistent view of market size, trade balance, prices, and per-capita indicators for the United States. The profile highlights demand structure and trade position, enabling benchmarking against regional and global peers.
Methodology
The analysis is built on a multi-source framework that combines official statistics, trade records, company disclosures, and expert validation. Data are standardized, reconciled, and cross-checked to ensure consistency across time series.
International trade data (exports, imports, and mirror statistics)
National production and consumption statistics
Company-level information from financial filings and public releases
Price series and unit value benchmarks
Analyst review, outlier checks, and time-series validation
All data are normalized to a common product definition and mapped to a consistent set of codes. This ensures that comparisons across time are aligned and actionable.
Forecasts to 2035
The forecast horizon extends to 2035 and is based on a structured model that links thiosulphates demand and supply to macroeconomic indicators, trade patterns, and sector-specific drivers. The model captures both cyclical and structural factors and reflects known policy and technology shifts in the United States.
Historical baseline: 2012-2025
Forecast horizon: 2026-2035
Scenario-based sensitivity to income growth, substitution, and regulation
Capacity and investment outlook for major producing companies
Each projection is built from national historical patterns and the broader regional context, allowing the report to show where growth is concentrated and where risks are elevated.
Price analysis and trade dynamics
Prices are analyzed in detail, including export and import unit values, regional spreads, and changes in trade costs. The report highlights how seasonality, freight rates, exchange rates, and supply disruptions influence pricing and margins.
Price benchmarks by country and sub-region
Export and import unit value trends
Seasonality and calendar effects in trade flows
Price outlook to 2035 under baseline assumptions
Profiles of market participants
Key producers, exporters, and distributors are profiled with a focus on their operational scale, geographic footprint, product mix, and market positioning. This helps identify competitive pressure points, partnership opportunities, and routes to differentiation.
Business focus and production capabilities
Geographic reach and distribution networks
Cost structure and pricing strategy indicators
Compliance, certification, and sustainability context
How to use this report
Quantify domestic demand and identify the most attractive segments
Evaluate export opportunities and prioritize target destinations
Track price dynamics and protect margins
Benchmark performance against leading competitors
Build evidence-based forecasts for investment decisions
This report is designed for manufacturers, distributors, importers, wholesalers, investors, and advisors who need a clear, data-driven picture of thiosulphates dynamics in the United States.
FAQ
What is included in the thiosulphates market in the United States?
The market size aggregates consumption and trade data, presented in both value and volume terms.
How are the forecasts to 2035 built?
The projections combine historical trends with macroeconomic indicators, trade dynamics, and sector-specific drivers.
Does the report cover prices and margins?
Yes, it includes export and import unit values, regional spreads, and a pricing outlook to 2035.
Which benchmarks are included?
The report benchmarks market size, trade balance, prices, and per-capita indicators for the United States.
Can this report support market entry decisions?
Yes, it highlights demand hotspots, trade routes, pricing trends, and competitive context.