

Feb 15, 2026
IndexBox has just published a new report: U.S. – Non-Window or Wall Air Conditioning Machines – Market Analysis, Forecast, Size, Trends And Insights.
The article provides a comprehensive analysis of the United States market for non-window or wall air conditioning machines. It forecasts market growth to 6.5M units ($4.5B) by 2035, driven by rising demand. In 2024, consumption rose to 6.3M units ($4.2B), while domestic production declined to 3M units. The US is a net importer, with 3.9M units imported primarily from Mexico, China, and Thailand, and 516K units exported, mainly to Canada. The report details trade flows, product types, and price trends, highlighting a significant gap between higher-value imports from Mexico/Canada and lower-cost units from China.
Key Findings
US market forecast to grow to 6.5 million units valued at $4.5 billion by 2035Domestic consumption increased to 6.3 million units in 2024 while production fell to 3 million unitsImports surged to 3.9 million units, with Mexico being the largest supplier by value at $1.8 billionExports declined to 516,000 units, with Canada as the primary destination receiving 60% of export valueSignificant price disparity exists, with average import price at $949 per unit and export price at $2,400 per unitMarket Forecast
Driven by increasing demand for non-window or wall air conditioning machines in the United States, the market is expected to continue an upward consumption trend over the next decade. Market performance is forecast to retain its current trend pattern, expanding with an anticipated CAGR of +0.2% for the period from 2024 to 2035, which is projected to bring the market volume to 6.5M units by the end of 2035.
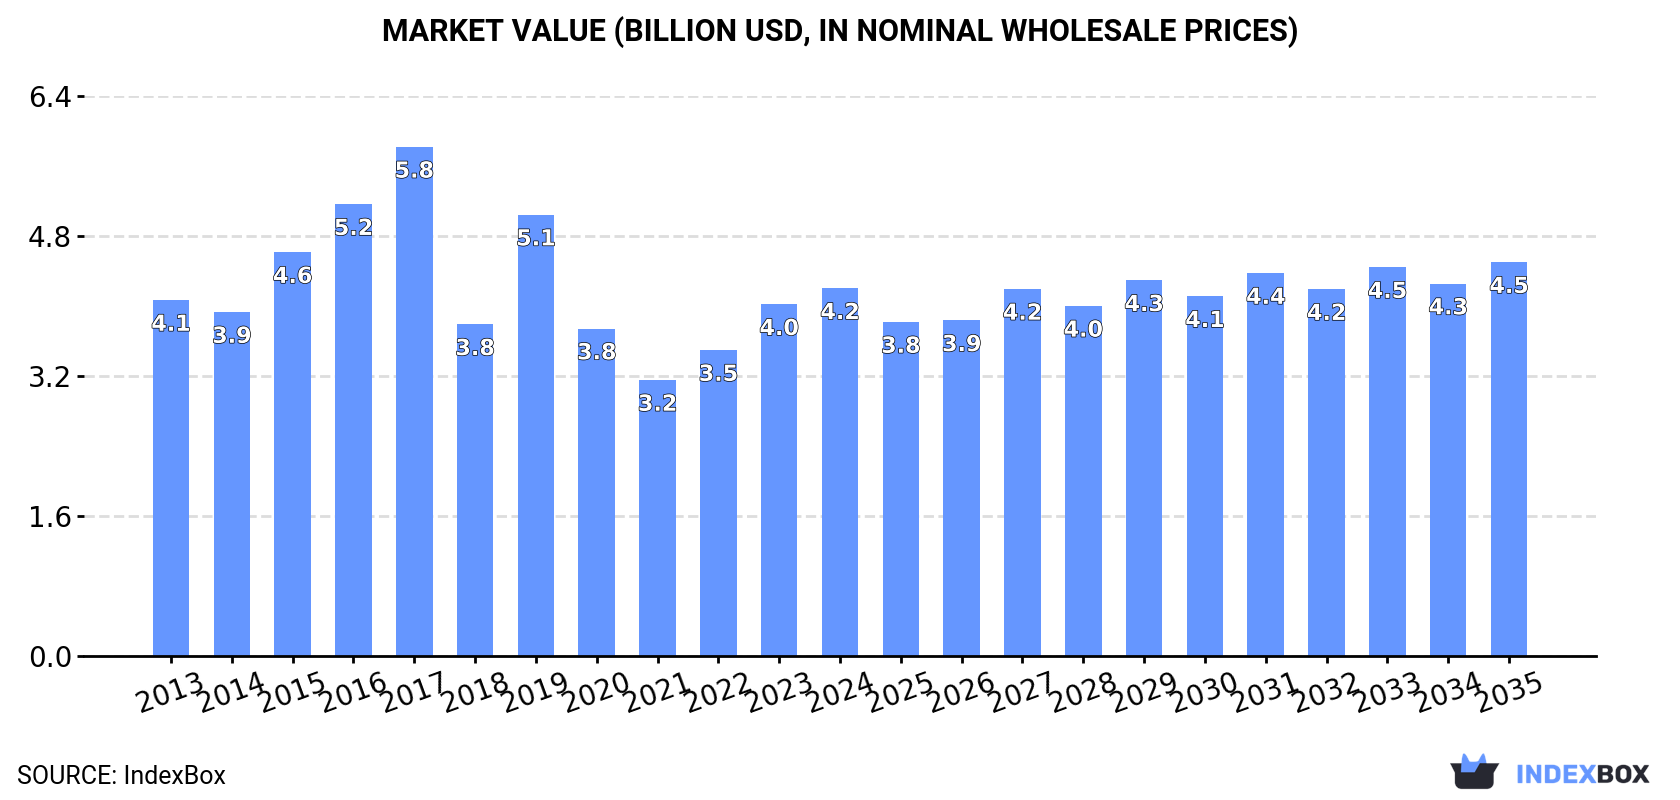
In value terms, the market is forecast to increase with an anticipated CAGR of +0.6% for the period from 2024 to 2035, which is projected to bring the market value to $4.5B (in nominal wholesale prices) by the end of 2035.
 ConsumptionUnited States’s Consumption of Non-Window or Wall Air Conditioning Machines
In 2024, consumption of non-window or wall air conditioning machines increased by 10% to 6.3M units, rising for the second year in a row after three years of decline. Over the period under review, consumption recorded a relatively flat trend pattern. As a result, consumption attained the peak volume and is likely to continue growth in the immediate term.
The value of the market for non-window or wall air conditioning machines in the United States rose slightly to $4.2B in 2024, growing by 4.5% against the previous year. This figure reflects the total revenues of producers and importers (excluding logistics costs, retail marketing costs, and retailers’ margins, which will be included in the final consumer price). In general, consumption saw a relatively flat trend pattern. Over the period under review, the market attained the maximum level at $5.8B in 2017; however, from 2018 to 2024, consumption stood at a somewhat lower figure.
ProductionUnited States’s Production of Non-Window or Wall Air Conditioning Machines
In 2024, the amount of non-window or wall air conditioning machines produced in the United States dropped modestly to 3M units, waning by -4.2% on 2023. In general, production saw a perceptible decline. The most prominent rate of growth was recorded in 2019 when the production volume increased by 61% against the previous year. Over the period under review, production of hit record highs at 4.4M units in 2013; however, from 2014 to 2024, production failed to regain momentum.
In value terms, production of non-window or wall air conditioning machines skyrocketed to $7B in 2024. Over the period under review, production showed a relatively flat trend pattern. The most prominent rate of growth was recorded in 2019 when the production volume increased by 64% against the previous year. Production of peaked at $7.2B in 2013; however, from 2014 to 2024, production stood at a somewhat lower figure.
ImportsUnited States’s Imports of Non-Window or Wall Air Conditioning Machines
In 2024, the amount of non-window or wall air conditioning machines imported into the United States surged to 3.9M units, picking up by 20% compared with 2023. Overall, total imports indicated a perceptible increase from 2013 to 2024: its volume increased at an average annual rate of +4.5% over the last eleven years. The trend pattern, however, indicated some noticeable fluctuations being recorded throughout the analyzed period. The most prominent rate of growth was recorded in 2016 with an increase of 36% against the previous year. Imports peaked at 4.1M units in 2018; however, from 2019 to 2024, imports stood at a somewhat lower figure.
In value terms, imports of non-window or wall air conditioning machines reached $3.7B in 2024. In general, imports continue to indicate a strong increase. The pace of growth appeared the most rapid in 2021 with an increase of 21%. Over the period under review, imports of hit record highs in 2024 and are expected to retain growth in the near future.
Imports By Country
China (1.4M units), Mexico (1.4M units) and Thailand (408K units) were the main suppliers of imports of non-window or wall air conditioning machines to the United States, with a combined 83% share of total imports. Canada, South Korea and the United Arab Emirates lagged somewhat behind, together comprising a further 9%.
From 2013 to 2024, the most notable rate of growth in terms of purchases, amongst the main suppliers, was attained by the United Arab Emirates (with a CAGR of +99.3%), while imports for the other leaders experienced more modest paces of growth.
In value terms, Mexico ($1.8B) constituted the largest supplier of non-window or wall air conditioning machines to the United States, comprising 49% of total imports. The second position in the ranking was held by Canada ($835M), with a 23% share of total imports. It was followed by China, with a 6.6% share.
From 2013 to 2024, the average annual growth rate of value from Mexico stood at +9.6%. The remaining supplying countries recorded the following average annual rates of imports growth: Canada (+14.6% per year) and China (-2.4% per year).
Imports By Type
In 2024, air conditioning machines; incorporating a refrigerating unit but not a valve for reversal of the cooling or heat cycle, other than window or wall type (3M units) constituted the largest type of non-window or wall air conditioning machines supplied to the United States, accounting for a 77% share of total imports. Moreover, air conditioning machines; incorporating a refrigerating unit but not a valve for reversal of the cooling or heat cycle, other than window or wall type exceeded the figures recorded for the second-largest type, air conditioning machines without refrigeration unit (507K units), sixfold.
From 2013 to 2024, the average annual growth rate of the volume of air conditioning machines; incorporating a refrigerating unit but not a valve for reversal of the cooling or heat cycle, other than window or wall type imports stood at +4.7%. With regard to the other supplied products, the following average annual rates of growth were recorded: air conditioning machines without refrigeration unit (+1.1% per year) and air conditioning machines incorporating a refrigerating unit and a valve for reversal of the cooling or heat cycle (+9.6% per year).
In value terms, air conditioning machines; incorporating a refrigerating unit but not a valve for reversal of the cooling or heat cycle, other than window or wall type ($2.5B) constituted the largest type of non-window or wall air conditioning machines supplied to the United States, comprising 67% of total imports. The second position in the ranking was taken by air conditioning machines without refrigeration unit ($772M), with a 21% share of total imports.
From 2013 to 2024, the average annual growth rate of the value of air conditioning machines; incorporating a refrigerating unit but not a valve for reversal of the cooling or heat cycle, other than window or wall type imports amounted to +9.5%. With regard to the other supplied products, the following average annual rates of growth were recorded: air conditioning machines without refrigeration unit (+11.3% per year) and air conditioning machines incorporating a refrigerating unit and a valve for reversal of the cooling or heat cycle (+11.6% per year).
Import Prices By Type
The average import price for non-window or wall air conditioning machines stood at $949 per unit in 2024, dropping by -8.4% against the previous year. Over the period under review, the import price, however, enjoyed strong growth. The most prominent rate of growth was recorded in 2023 when the average import price increased by 29%. As a result, import price attained the peak level of $1 thousand per unit, and then contracted in the following year.
There were significant differences in the average prices amongst the major supplied products. In 2024, the product with the highest price was air conditioning machines without refrigeration unit ($1.5 thousand per unit), while the price for air conditioning machines; incorporating a refrigerating unit but not a valve for reversal of the cooling or heat cycle, other than window or wall type ($830 per unit) was amongst the lowest.
From 2013 to 2024, the most notable rate of growth in terms of prices was attained by air conditioning machins without refrigeration unit (+10.1%), while the prices for the other products experienced more modest paces of growth.
Import Prices By Country
The average import price for non-window or wall air conditioning machines stood at $949 per unit in 2024, dropping by -8.4% against the previous year. In general, the import price, however, enjoyed a buoyant expansion. The growth pace was the most rapid in 2023 when the average import price increased by 29% against the previous year. As a result, import price attained the peak level of $1 thousand per unit, and then contracted in the following year.
There were significant differences in the average prices amongst the major supplying countries. In 2024, amid the top importers, the country with the highest price was Canada ($4.9 thousand per unit), while the price for China ($169 per unit) was amongst the lowest.
From 2013 to 2024, the most notable rate of growth in terms of prices was attained by the United Arab Emirates (+9.0%), while the prices for the other major suppliers experienced more modest paces of growth.
ExportsUnited States’s Exports of Non-Window or Wall Air Conditioning Machines
Exports of non-window or wall air conditioning machines from the United States dropped to 516K units in 2024, which is down by -12.3% on the previous year’s figure. In general, exports showed a perceptible reduction. The most prominent rate of growth was recorded in 2021 with an increase of 15% against the previous year. The exports peaked at 671K units in 2013; however, from 2014 to 2024, the exports failed to regain momentum.
In value terms, exports of non-window or wall air conditioning machines expanded remarkably to $1.2B in 2024. Over the period under review, exports, however, recorded a relatively flat trend pattern. The pace of growth appeared the most rapid in 2022 when exports increased by 16% against the previous year. Over the period under review, the exports of reached the maximum in 2024 and are expected to retain growth in years to come.
Exports By Country
Canada (289K units) was the main destination for exports of non-window or wall air conditioning machines from the United States, with a 56% share of total exports. Moreover, exports of non-window or wall air conditioning machines to Canada exceeded the volume sent to the second major destination, Mexico (105K units), threefold. The third position in this ranking was held by Japan (13K units), with a 2.4% share.
From 2013 to 2024, the average annual growth rate of volume to Canada was relatively modest. Exports to the other major destinations recorded the following average annual rates of exports growth: Mexico (-1.7% per year) and Japan (+13.2% per year).
In value terms, Canada ($733M) remains the key foreign market for non-window or wall air conditioning machines exports from the United States, comprising 60% of total exports. The second position in the ranking was held by Mexico ($193M), with a 16% share of total exports. It was followed by Japan, with a 2.8% share.
From 2013 to 2024, the average annual growth rate of value to Canada stood at +4.4%. Exports to the other major destinations recorded the following average annual rates of exports growth: Mexico (+2.5% per year) and Japan (+17.8% per year).
Exports By Type
Air conditioning machines; incorporating a refrigerating unit but not a valve for reversal of the cooling or heat cycle, other than window or wall type (344K units) was the largest type of non-window or wall air conditioning machines exported from the United States, with a 67% share of total exports. Moreover, air conditioning machines; incorporating a refrigerating unit but not a valve for reversal of the cooling or heat cycle, other than window or wall type exceeded the volume of the second product type, air conditioning machines without refrigeration unit (99K units), threefold.
From 2013 to 2024, the average annual growth rate of the volume of air conditioning machines; incorporating a refrigerating unit but not a valve for reversal of the cooling or heat cycle, other than window or wall type exports stood at -2.5%. With regard to the other exported products, the following average annual rates of growth were recorded: air conditioning machines without refrigeration unit (-1.0% per year) and air conditioning machines incorporating a refrigerating unit and a valve for reversal of the cooling or heat cycle (-3.4% per year).
In value terms, air conditioning machines; incorporating a refrigerating unit but not a valve for reversal of the cooling or heat cycle, other than window or wall type ($805M) remains the largest type of non-window or wall air conditioning machines exported from the United States, comprising 66% of total exports. The second position in the ranking was held by air conditioning machines without refrigeration unit ($245M), with a 20% share of total exports.
From 2013 to 2024, the average annual growth rate of the value of air conditioning machines; incorporating a refrigerating unit but not a valve for reversal of the cooling or heat cycle, other than window or wall type exports was relatively modest. With regard to the other exported products, the following average annual rates of growth were recorded: air conditioning machines without refrigeration unit (+1.8% per year) and air conditioning machines incorporating a refrigerating unit and a valve for reversal of the cooling or heat cycle (+0.9% per year).
Export Prices By Type
In 2024, the average export price for non-window or wall air conditioning machines amounted to $2.4 thousand per unit, jumping by 20% against the previous year. Over the last eleven-year period, it increased at an average annual rate of +3.3%. As a result, the export price reached the peak level and is likely to continue growth in the immediate term.
Average prices varied noticeably for the major types of exported product. In 2024, the product with the highest price was air conditioning machines without refrigeration unit ($2.5 thousand per unit), while the average price for exports of air conditioning machines incorporating a refrigerating unit and a valve for reversal of the cooling or heat cycle ($2.3 thousand per unit) was amongst the lowest.
From 2013 to 2024, the most notable rate of growth in terms of prices was recorded for the following types: air conditioning machines incorporating a refrigerating unit and a valve for reversal of the cooling or heat cycle (+4.5%), while the prices for the other products experienced more modest paces of growth.
Export Prices By Country
In 2024, the average export price for non-window or wall air conditioning machines amounted to $2.4 thousand per unit, with an increase of 20% against the previous year. Over the period from 2013 to 2024, it increased at an average annual rate of +3.3%. As a result, the export price reached the peak level and is likely to continue growth in the immediate term.
There were significant differences in the average prices for the major foreign markets. In 2024, amid the top suppliers, the country with the highest price was Saudi Arabia ($3.2 thousand per unit), while the average price for exports to France ($1.8 thousand per unit) was amongst the lowest.
From 2013 to 2024, the most notable rate of growth in terms of prices was recorded for supplies to the United Arab Emirates (+7.1%), while the prices for the other major destinations experienced more modest paces of growth.
Source: IndexBox Market Intelligence Platform
This report provides a comprehensive view of the non-window or wall air conditioning machines industry in the United States, tracking demand, supply, and trade flows across the national value chain. It explains how demand across key channels and end-use segments shapes consumption patterns, while also mapping the role of input availability, production efficiency, and regulatory standards on supply.
Beyond headline metrics, the study benchmarks prices, margins, and trade routes so you can see where value is created and how it moves between domestic suppliers and international partners. The analysis is designed to support strategic planning, market entry, portfolio prioritization, and risk management in the non-window or wall air conditioning machines landscape in the United States.
Quick navigation
Key findings
Domestic demand is shaped by both household and industrial usage, with trade flows linking local supply to imports and exports.
Pricing dynamics reflect unit values, freight costs, exchange rates, and regulatory shifts that affect sourcing decisions.
Supply depends on input availability and production efficiency, creating a distinct national cost curve.
Market concentration varies by segment, creating different competitive landscapes and entry barriers.
The 2035 outlook highlights where capacity investment and demand growth are most aligned within the country.
Report scope
The report combines market sizing with trade intelligence and price analytics for the United States. It covers both historical performance and the forward outlook to 2035, allowing you to compare cycles, structural shifts, and policy impacts.
Market size and growth in value and volume terms
Consumption structure by end-use segments
Production capacity, output, and cost dynamics
Trade flows, exporters, importers, and balances
Price benchmarks, unit values, and margin signals
Competitive context and market entry conditions
Product coverageProdcom 28251250 – Air conditioning machines with refrigeration unit (excluding those used in motor vehicles, self-contained or split-systems machines)Prodcom 28251270 – Air conditioning machines not containing a refrigeration unit, c entral station air handling units, vav boxes and terminals, c onstant volume units and fan coil unitsCountry coverageCountry profile and benchmarks
This report provides a consistent view of market size, trade balance, prices, and per-capita indicators for the United States. The profile highlights demand structure and trade position, enabling benchmarking against regional and global peers.
Methodology
The analysis is built on a multi-source framework that combines official statistics, trade records, company disclosures, and expert validation. Data are standardized, reconciled, and cross-checked to ensure consistency across time series.
International trade data (exports, imports, and mirror statistics)
National production and consumption statistics
Company-level information from financial filings and public releases
Price series and unit value benchmarks
Analyst review, outlier checks, and time-series validation
All data are normalized to a common product definition and mapped to a consistent set of codes. This ensures that comparisons across time are aligned and actionable.
Forecasts to 2035
The forecast horizon extends to 2035 and is based on a structured model that links non-window or wall air conditioning machines demand and supply to macroeconomic indicators, trade patterns, and sector-specific drivers. The model captures both cyclical and structural factors and reflects known policy and technology shifts in the United States.
Historical baseline: 2012-2025
Forecast horizon: 2026-2035
Scenario-based sensitivity to income growth, substitution, and regulation
Capacity and investment outlook for major producing companies
Each projection is built from national historical patterns and the broader regional context, allowing the report to show where growth is concentrated and where risks are elevated.
Price analysis and trade dynamics
Prices are analyzed in detail, including export and import unit values, regional spreads, and changes in trade costs. The report highlights how seasonality, freight rates, exchange rates, and supply disruptions influence pricing and margins.
Price benchmarks by country and sub-region
Export and import unit value trends
Seasonality and calendar effects in trade flows
Price outlook to 2035 under baseline assumptions
Profiles of market participants
Key producers, exporters, and distributors are profiled with a focus on their operational scale, geographic footprint, product mix, and market positioning. This helps identify competitive pressure points, partnership opportunities, and routes to differentiation.
Business focus and production capabilities
Geographic reach and distribution networks
Cost structure and pricing strategy indicators
Compliance, certification, and sustainability context
How to use this report
Quantify domestic demand and identify the most attractive segments
Evaluate export opportunities and prioritize target destinations
Track price dynamics and protect margins
Benchmark performance against leading competitors
Build evidence-based forecasts for investment decisions
This report is designed for manufacturers, distributors, importers, wholesalers, investors, and advisors who need a clear, data-driven picture of non-window or wall air conditioning machines dynamics in the United States.
FAQ
What is included in the non-window or wall air conditioning machines market in the United States?
The market size aggregates consumption and trade data, presented in both value and volume terms.
How are the forecasts to 2035 built?
The projections combine historical trends with macroeconomic indicators, trade dynamics, and sector-specific drivers.
Does the report cover prices and margins?
Yes, it includes export and import unit values, regional spreads, and a pricing outlook to 2035.
Which benchmarks are included?
The report benchmarks market size, trade balance, prices, and per-capita indicators for the United States.
Can this report support market entry decisions?
Yes, it highlights demand hotspots, trade routes, pricing trends, and competitive context.