

Feb 16, 2026
IndexBox has just published a new report: U.S. – Copper Stranded Wire, Cables And Plaited Bands – Market Analysis, Forecast, Size, Trends And Insights.
The article provides a comprehensive analysis of the United States market for copper stranded wire, cables, and plaited bands. It details that consumption reached 135K tons ($1.5B) in 2024, with a forecasted CAGR of +0.5% in volume and +2.0% in value through 2035, reaching 142K tons and $1.9B. Domestic production was 164K tons ($1.9B) in 2024. Imports fell sharply to 4.3K tons ($63M), primarily sourced from Turkey, India, and Mexico, while exports declined to 33K tons ($410M), mainly to Mexico and Canada. The report covers price trends and supplier dynamics.
Key Findings
Market forecast to grow to 142K tons and $1.9B by 2035, with a +0.5% volume and +2.0% value CAGRUS consumption and production in 2024 were 135K tons and 164K tons, respectively, indicating net export positionImports dropped significantly by -40.3% to 4.3K tons, with Turkey, India, and Mexico as top suppliersExports declined to 33K tons, primarily destined for Mexico and CanadaImport prices rose to $14,720/ton, with Germany being the highest-priced sourceMarket Forecast
Driven by increasing demand for copper stranded wire, cables and plaited bands in the United States, the market is expected to continue an upward consumption trend over the next decade. Market performance is forecast to retain its current trend pattern, expanding with an anticipated CAGR of +0.5% for the period from 2024 to 2035, which is projected to bring the market volume to 142K tons by the end of 2035.
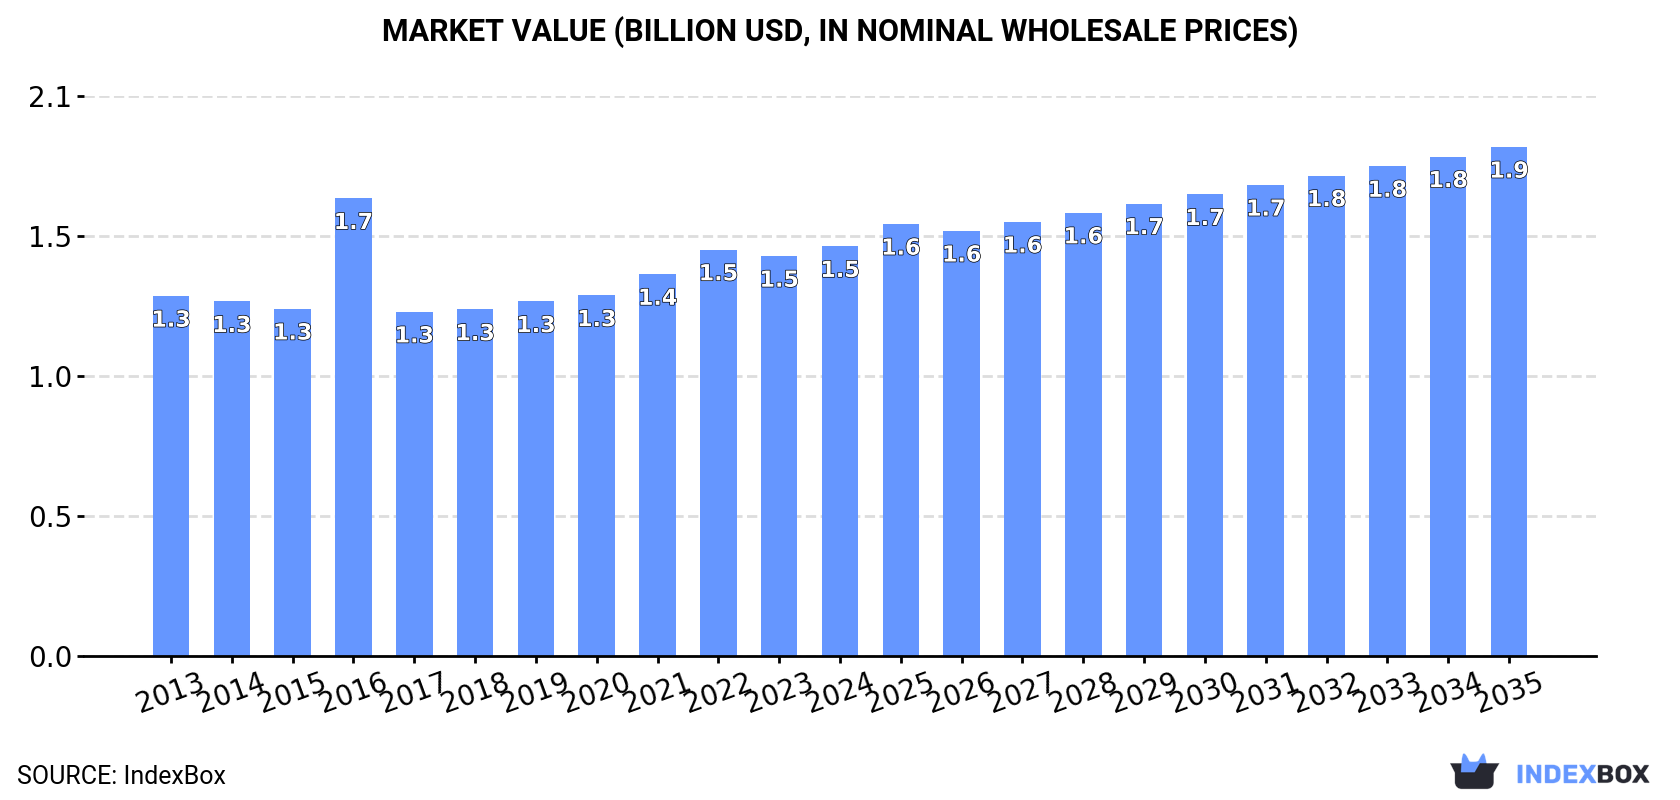
In value terms, the market is forecast to increase with an anticipated CAGR of +2.0% for the period from 2024 to 2035, which is projected to bring the market value to $1.9B (in nominal wholesale prices) by the end of 2035.
 ConsumptionUnited States’s Consumption of Copper Stranded Wire, Cables And Plaited Bands
Copper stranded wire consumption in the United States rose modestly to 135K tons in 2024, surging by 2.4% on 2023 figures. In general, consumption recorded a relatively flat trend pattern. As a result, consumption attained the peak volume and is likely to continue growth in the immediate term.
The revenue of the copper stranded wire market in the United States rose to $1.5B in 2024, growing by 2.4% against the previous year. This figure reflects the total revenues of producers and importers (excluding logistics costs, retail marketing costs, and retailers’ margins, which will be included in the final consumer price). The market value increased at an average annual rate of +1.2% from 2013 to 2024; the trend pattern remained consistent, with only minor fluctuations being recorded in certain years. As a result, consumption attained the peak level of $1.7B. From 2017 to 2024, the growth of the market remained at a somewhat lower figure.
ProductionUnited States’s Production of Copper Stranded Wire, Cables And Plaited Bands
In 2024, approx. 164K tons of copper stranded wire, cables and plaited bands were produced in the United States; surging by 2.4% against 2023. In general, production recorded a relatively flat trend pattern. The growth pace was the most rapid in 2017 when the production volume increased by 26% against the previous year. Copper stranded wire production peaked at 171K tons in 2018; however, from 2019 to 2024, production stood at a somewhat lower figure.
In value terms, copper stranded wire production rose slightly to $1.9B in 2024. The total output value increased at an average annual rate of +1.2% over the period from 2013 to 2024; the trend pattern remained consistent, with somewhat noticeable fluctuations throughout the analyzed period. The most prominent rate of growth was recorded in 2016 with an increase of 22% against the previous year. As a result, production attained the peak level of $2B. From 2017 to 2024, production growth remained at a somewhat lower figure.
ImportsUnited States’s Imports of Copper Stranded Wire, Cables And Plaited Bands
In 2024, purchases abroad of copper stranded wire, cables and plaited bands decreased by -40.3% to 4.3K tons for the first time since 2020, thus ending a three-year rising trend. Over the period under review, imports saw a abrupt descent. The pace of growth was the most pronounced in 2022 when imports increased by 31% against the previous year. Imports peaked at 16K tons in 2013; however, from 2014 to 2024, imports remained at a lower figure.
In value terms, copper stranded wire imports declined significantly to $63M in 2024. In general, imports recorded a abrupt curtailment. The pace of growth appeared the most rapid in 2021 with an increase of 74%. Over the period under review, imports hit record highs at $139M in 2013; however, from 2014 to 2024, imports failed to regain momentum.
Imports By Country
Turkey (1.5K tons), India (956 tons) and Mexico (615 tons) were the main suppliers of copper stranded wire imports to the United States, with a combined 72% share of total imports.
From 2013 to 2024, the most notable rate of growth in terms of purchases, amongst the main suppliers, was attained by India (with a CAGR of +26.5%), while imports for the other leaders experienced more modest paces of growth.
In value terms, Turkey ($19M), India ($13M) and Mexico ($9.9M) were the largest copper stranded wire suppliers to the United States, with a combined 67% share of total imports.
India, with a CAGR of +18.3%, saw the highest rates of growth with regard to the value of imports, in terms of the main suppliers over the period under review, while purchases for the other leaders experienced more modest paces of growth.
Import Prices By Country
The average copper stranded wire import price stood at $14,720 per ton in 2024, surging by 6% against the previous year. In general, import price indicated a pronounced expansion from 2013 to 2024: its price increased at an average annual rate of +4.7% over the last eleven-year period. The trend pattern, however, indicated some noticeable fluctuations being recorded throughout the analyzed period. Based on 2024 figures, copper stranded wire import price increased by +63.0% against 2020 indices. The pace of growth appeared the most rapid in 2021 an increase of 41% against the previous year. The import price peaked in 2024 and is expected to retain growth in the immediate term.
Prices varied noticeably by country of origin: amid the top importers, the country with the highest price was Germany ($30,169 per ton), while the price for China ($8,851 per ton) was amongst the lowest.
From 2013 to 2024, the most notable rate of growth in terms of prices was attained by Canada (+10.7%), while the prices for the other major suppliers experienced more modest paces of growth.
ExportsUnited States’s Exports of Copper Stranded Wire, Cables And Plaited Bands
In 2024, the amount of copper stranded wire, cables and plaited bands exported from the United States shrank to 33K tons, waning by -6.1% on the previous year’s figure. In general, exports recorded a perceptible descent. The most prominent rate of growth was recorded in 2017 with an increase of 184% against the previous year. Over the period under review, the exports hit record highs at 49K tons in 2018; however, from 2019 to 2024, the exports failed to regain momentum.
In value terms, copper stranded wire exports declined to $410M in 2024. Overall, exports recorded a slight shrinkage. The pace of growth was the most pronounced in 2021 with an increase of 42% against the previous year. The exports peaked at $481M in 2014; however, from 2015 to 2024, the exports stood at a somewhat lower figure.
Exports By Country
Mexico (19K tons) and Canada (12K tons) were the main destinations of copper stranded wire exports from the United States.
From 2013 to 2024, the biggest increases were recorded for Canada (with a CAGR of -1.5%).
In value terms, the largest markets for copper stranded wire exported from the United States were Mexico ($215M) and Canada ($150M).
Canada, with a CAGR of +1.8%, recorded the highest rates of growth with regard to the value of exports, among the main countries of destination over the period under review.
Export Prices By Country
The average copper stranded wire export price stood at $12,305 per ton in 2024, stabilizing at the previous year. In general, the export price continues to indicate a temperate increase. The growth pace was the most rapid in 2016 an increase of 127%. As a result, the export price reached the peak level of $21,093 per ton. From 2017 to 2024, the average export prices failed to regain momentum.
Average prices varied noticeably for the major export markets. In 2024, amid the top suppliers, the country with the highest price was Canada ($12,017 per ton), while the average price for exports to Mexico stood at $11,548 per ton.
From 2013 to 2024, the most notable rate of growth in terms of prices was recorded for supplies to Canada (+3.3%).
Source: IndexBox Market Intelligence Platform
This report provides a comprehensive view of the copper stranded wire industry in the United States, tracking demand, supply, and trade flows across the national value chain. It explains how demand across key channels and end-use segments shapes consumption patterns, while also mapping the role of input availability, production efficiency, and regulatory standards on supply.
Beyond headline metrics, the study benchmarks prices, margins, and trade routes so you can see where value is created and how it moves between domestic suppliers and international partners. The analysis is designed to support strategic planning, market entry, portfolio prioritization, and risk management in the copper stranded wire landscape in the United States.
Quick navigation
Key findings
Domestic demand is shaped by both household and industrial usage, with trade flows linking local supply to imports and exports.
Pricing dynamics reflect unit values, freight costs, exchange rates, and regulatory shifts that affect sourcing decisions.
Supply depends on input availability and production efficiency, creating a distinct national cost curve.
Market concentration varies by segment, creating different competitive landscapes and entry barriers.
The 2035 outlook highlights where capacity investment and demand growth are most aligned within the country.
Report scope
The report combines market sizing with trade intelligence and price analytics for the United States. It covers both historical performance and the forward outlook to 2035, allowing you to compare cycles, structural shifts, and policy impacts.
Market size and growth in value and volume terms
Consumption structure by end-use segments
Production capacity, output, and cost dynamics
Trade flows, exporters, importers, and balances
Price benchmarks, unit values, and margin signals
Competitive context and market entry conditions
Product coverageProdcom 25931250 – Copper stranded wire, cables, plaited bands and the like excluding electrically insulated, barbed wire and loosely twisted non-barbed double fencing wire, insulated electric wire and cablesCountry coverageCountry profile and benchmarks
This report provides a consistent view of market size, trade balance, prices, and per-capita indicators for the United States. The profile highlights demand structure and trade position, enabling benchmarking against regional and global peers.
Methodology
The analysis is built on a multi-source framework that combines official statistics, trade records, company disclosures, and expert validation. Data are standardized, reconciled, and cross-checked to ensure consistency across time series.
International trade data (exports, imports, and mirror statistics)
National production and consumption statistics
Company-level information from financial filings and public releases
Price series and unit value benchmarks
Analyst review, outlier checks, and time-series validation
All data are normalized to a common product definition and mapped to a consistent set of codes. This ensures that comparisons across time are aligned and actionable.
Forecasts to 2035
The forecast horizon extends to 2035 and is based on a structured model that links copper stranded wire demand and supply to macroeconomic indicators, trade patterns, and sector-specific drivers. The model captures both cyclical and structural factors and reflects known policy and technology shifts in the United States.
Historical baseline: 2012-2025
Forecast horizon: 2026-2035
Scenario-based sensitivity to income growth, substitution, and regulation
Capacity and investment outlook for major producing companies
Each projection is built from national historical patterns and the broader regional context, allowing the report to show where growth is concentrated and where risks are elevated.
Price analysis and trade dynamics
Prices are analyzed in detail, including export and import unit values, regional spreads, and changes in trade costs. The report highlights how seasonality, freight rates, exchange rates, and supply disruptions influence pricing and margins.
Price benchmarks by country and sub-region
Export and import unit value trends
Seasonality and calendar effects in trade flows
Price outlook to 2035 under baseline assumptions
Profiles of market participants
Key producers, exporters, and distributors are profiled with a focus on their operational scale, geographic footprint, product mix, and market positioning. This helps identify competitive pressure points, partnership opportunities, and routes to differentiation.
Business focus and production capabilities
Geographic reach and distribution networks
Cost structure and pricing strategy indicators
Compliance, certification, and sustainability context
How to use this report
Quantify domestic demand and identify the most attractive segments
Evaluate export opportunities and prioritize target destinations
Track price dynamics and protect margins
Benchmark performance against leading competitors
Build evidence-based forecasts for investment decisions
This report is designed for manufacturers, distributors, importers, wholesalers, investors, and advisors who need a clear, data-driven picture of copper stranded wire dynamics in the United States.
FAQ
What is included in the copper stranded wire market in the United States?
The market size aggregates consumption and trade data, presented in both value and volume terms.
How are the forecasts to 2035 built?
The projections combine historical trends with macroeconomic indicators, trade dynamics, and sector-specific drivers.
Does the report cover prices and margins?
Yes, it includes export and import unit values, regional spreads, and a pricing outlook to 2035.
Which benchmarks are included?
The report benchmarks market size, trade balance, prices, and per-capita indicators for the United States.
Can this report support market entry decisions?
Yes, it highlights demand hotspots, trade routes, pricing trends, and competitive context.