

Feb 18, 2026
IndexBox has just published a new report: U.S. – Medicaments Containing Corticosteroid Hormones – Market Analysis, Forecast, Size, Trends And Insights.
The US market for medicaments containing corticosteroid hormones is forecast to grow at a CAGR of +2.8% in volume to 31K tons and +5.5% in value to $18.3B by 2035. In 2024, consumption dipped slightly to 23K tons, while market value dropped sharply to $10.2B. Domestic production saw a significant 19% rebound to 8.9K tons. The US remains heavily import-dependent, sourcing 22K tons primarily from Canada, India, and Ireland, though import value fell to $8.7B. Exports grew to 7.5K tons valued at $3.9B, with Japan, France, and Saudi Arabia as top destinations. Notable price disparities exist, with average import prices at ~$400K/ton and export prices at ~$515K/ton.
Key Findings
Market forecast to reach 31K tons and $18.3B by 2035, growing at CAGRs of +2.8% and +5.5% respectivelyUS consumption was 23K tons in 2024, heavily reliant on imports of 22K tons, primarily from Canada, India, and IrelandDomestic production rebounded by 19% to 8.9K tons in 2024 after years of declineExport value surged to $3.9B, with Japan, France, and Saudi Arabia as top high-value destinationsSignificant price gap exists with average import price at $399,704 per ton versus export price at $514,944 per tonMarket Forecast
Driven by increasing demand for medicaments containing corticosteroid hormones in the United States, the market is expected to continue an upward consumption trend over the next decade. Market performance is forecast to accelerate, expanding with an anticipated CAGR of +2.8% for the period from 2024 to 2035, which is projected to bring the market volume to 31K tons by the end of 2035.
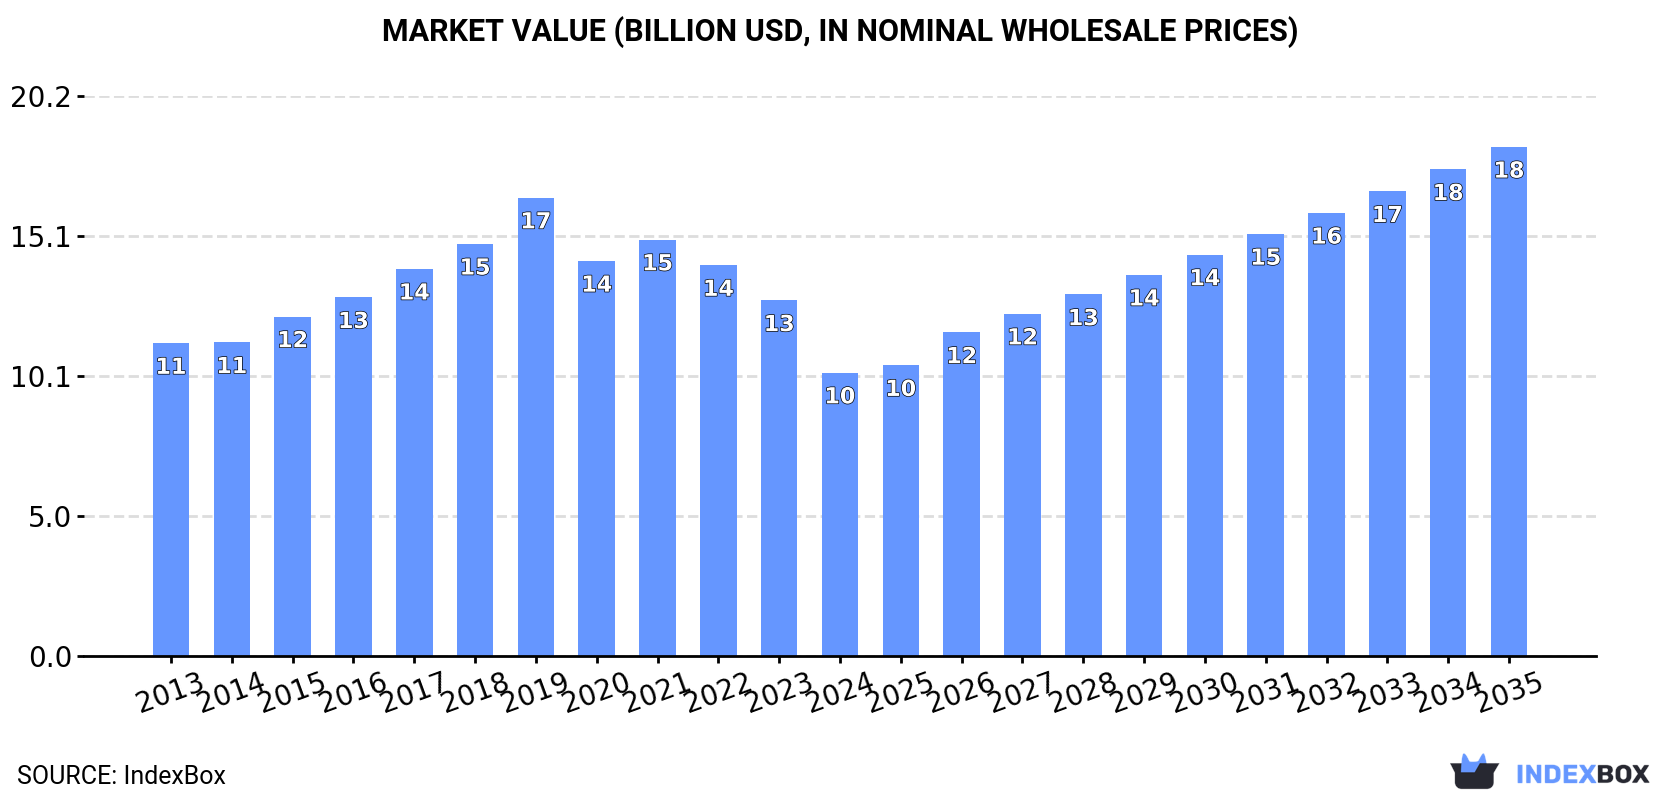
In value terms, the market is forecast to increase with an anticipated CAGR of +5.5% for the period from 2024 to 2035, which is projected to bring the market value to $18.3B (in nominal wholesale prices) by the end of 2035.
 ConsumptionUnited States’s Consumption of Medicaments Containing Corticosteroid Hormones
In 2024, after three years of growth, there was decline in consumption of medicaments containing corticosteroid hormones, when its volume decreased by -0.3% to 23K tons. The total consumption volume increased at an average annual rate of +1.2% from 2013 to 2024; the trend pattern remained relatively stable, with somewhat noticeable fluctuations being observed in certain years. The most prominent rate of growth was recorded in 2016 with an increase of 3.6%. Medicaments containing corticosteroid hormones consumption peaked at 23K tons in 2023, and then dropped slightly in the following year.
The size of the medicaments containing corticosteroid hormones market in the United States dropped sharply to $10.2B in 2024, reducing by -20.3% against the previous year. This figure reflects the total revenues of producers and importers (excluding logistics costs, retail marketing costs, and retailers’ margins, which will be included in the final consumer price). Over the period under review, consumption recorded a relatively flat trend pattern. As a result, consumption reached the peak level of $16.5B. From 2020 to 2024, the growth of the market failed to regain momentum.
ProductionUnited States’s Production of Medicaments Containing Corticosteroid Hormones
In 2024, after four years of decline, there was significant growth in production of medicaments containing corticosteroid hormones, when its volume increased by 19% to 8.9K tons. In general, production, however, saw a perceptible decline. Over the period under review, production reached the maximum volume at 14K tons in 2013; however, from 2014 to 2024, production stood at a somewhat lower figure.
In value terms, medicaments containing corticosteroid hormones production skyrocketed to $3.7B in 2024. Overall, production saw a relatively flat trend pattern. Over the period under review, production reached the maximum level at $4.1B in 2019; however, from 2020 to 2024, production failed to regain momentum.
ImportsUnited States’s Imports of Medicaments Containing Corticosteroid Hormones
In 2024, overseas purchases of medicaments containing corticosteroid hormones decreased by -2.5% to 22K tons for the first time since 2017, thus ending a six-year rising trend. Overall, imports, however, saw a buoyant increase. The growth pace was the most rapid in 2020 when imports increased by 28%. Over the period under review, imports attained the maximum at 22K tons in 2023, and then fell slightly in the following year.
In value terms, medicaments containing corticosteroid hormones imports contracted notably to $8.7B in 2024. In general, total imports indicated a measured expansion from 2013 to 2024: its value increased at an average annual rate of +3.3% over the last eleven-year period. The trend pattern, however, indicated some noticeable fluctuations being recorded throughout the analyzed period. Based on 2024 figures, imports decreased by -31.2% against 2022 indices. The pace of growth was the most pronounced in 2019 with an increase of 21% against the previous year. Over the period under review, imports reached the maximum at $12.6B in 2022; however, from 2023 to 2024, imports stood at a somewhat lower figure.
Imports By Country
Canada (6.5K tons), India (3.8K tons) and Ireland (3.3K tons) were the main suppliers of medicaments containing corticosteroid hormones imports to the United States, together accounting for 63% of total imports. France, Switzerland, Italy, the UK, Israel, China, the Netherlands, Denmark and Spain lagged somewhat behind, together comprising a further 30%.
From 2013 to 2024, the most notable rate of growth in terms of purchases, amongst the main suppliers, was attained by China (with a CAGR of +38.2%), while imports for the other leaders experienced more modest paces of growth.
In value terms, the largest medicaments containing corticosteroid hormones suppliers to the United States were Ireland ($2.2B), France ($1.1B) and Italy ($793M), with a combined 47% share of total imports. Canada, Denmark, India, the UK, Switzerland, the Netherlands, Spain, China and Israel lagged somewhat behind, together accounting for a further 27%.
China, with a CAGR of +44.5%, recorded the highest growth rate of the value of imports, among the main suppliers over the period under review, while purchases for the other leaders experienced more modest paces of growth.
Import Prices By Country
In 2024, the average medicaments containing corticosteroid hormones import price amounted to $399,704 per ton, declining by -26.5% against the previous year. Overall, the import price continues to indicate a pronounced decline. The pace of growth appeared the most rapid in 2015 an increase of 11%. Over the period under review, average import prices reached the maximum at $784,029 per ton in 2019; however, from 2020 to 2024, import prices failed to regain momentum.
There were significant differences in the average prices amongst the major supplying countries. In 2024, amid the top importers, the country with the highest price was Denmark ($2,133,957 per ton), while the price for Israel ($69,498 per ton) was amongst the lowest.
From 2013 to 2024, the most notable rate of growth in terms of prices was attained by Spain (+12.9%), while the prices for the other major suppliers experienced more modest paces of growth.
ExportsUnited States’s Exports of Medicaments Containing Corticosteroid Hormones
In 2024, overseas shipments of medicaments containing corticosteroid hormones increased by 14% to 7.5K tons, rising for the seventh year in a row after two years of decline. Over the period under review, exports saw temperate growth. The most prominent rate of growth was recorded in 2019 with an increase of 38% against the previous year. Over the period under review, the exports reached the maximum in 2024 and are likely to see steady growth in the near future.
In value terms, medicaments containing corticosteroid hormones exports soared to $3.9B in 2024. In general, exports saw a prominent increase. As a result, the exports attained the peak and are likely to continue growth in the immediate term.
Exports By Country
Japan (1.2K tons), Canada (961 tons) and France (818 tons) were the main destinations of medicaments containing corticosteroid hormones exports from the United States, together comprising 40% of total exports. Mexico, Brazil, Australia, the Netherlands, Germany, Saudi Arabia, Thailand, Belgium and Sweden lagged somewhat behind, together comprising a further 32%.
From 2013 to 2024, the biggest increases were recorded for Sweden (with a CAGR of +66.1%), while shipments for the other leaders experienced more modest paces of growth.
In value terms, the largest markets for medicaments containing corticosteroid hormones exported from the United States were Japan ($707M), France ($391M) and Saudi Arabia ($313M), together accounting for 36% of total exports. Canada, Mexico, Australia, the Netherlands, Brazil, Germany, Belgium, Thailand and Sweden lagged somewhat behind, together accounting for a further 30%.
Thailand, with a CAGR of +51.3%, recorded the highest rates of growth with regard to the value of exports, in terms of the main countries of destination over the period under review, while shipments for the other leaders experienced more modest paces of growth.
Export Prices By Country
In 2024, the average medicaments containing corticosteroid hormones export price amounted to $514,944 per ton, growing by 61% against the previous year. Overall, export price indicated a strong increase from 2013 to 2024: its price increased at an average annual rate of +8.4% over the last eleven-year period. The trend pattern, however, indicated some noticeable fluctuations being recorded throughout the analyzed period. The pace of growth was the most pronounced in 2014 when the average export price increased by 81% against the previous year. Over the period under review, the average export prices attained the peak figure in 2024 and is expected to retain growth in years to come.
There were significant differences in the average prices for the major foreign markets. In 2024, amid the top suppliers, the country with the highest price was Saudi Arabia ($1,420,486 per ton), while the average price for exports to Thailand ($178,160 per ton) was amongst the lowest.
From 2013 to 2024, the most notable rate of growth in terms of prices was recorded for supplies to Mexico (+30.8%), while the prices for the other major destinations experienced more modest paces of growth.
Source: IndexBox Market Intelligence Platform
This report provides a comprehensive view of the medicaments containing corticosteroid hormones industry in the United States, tracking demand, supply, and trade flows across the national value chain. It explains how demand across key channels and end-use segments shapes consumption patterns, while also mapping the role of input availability, production efficiency, and regulatory standards on supply.
Beyond headline metrics, the study benchmarks prices, margins, and trade routes so you can see where value is created and how it moves between domestic suppliers and international partners. The analysis is designed to support strategic planning, market entry, portfolio prioritization, and risk management in the medicaments containing corticosteroid hormones landscape in the United States.
Quick navigation
Key findings
Domestic demand is shaped by both household and industrial usage, with trade flows linking local supply to imports and exports.
Pricing dynamics reflect unit values, freight costs, exchange rates, and regulatory shifts that affect sourcing decisions.
Supply depends on input availability and production efficiency, creating a distinct national cost curve.
Market concentration varies by segment, creating different competitive landscapes and entry barriers.
The 2035 outlook highlights where capacity investment and demand growth are most aligned within the country.
Report scope
The report combines market sizing with trade intelligence and price analytics for the United States. It covers both historical performance and the forward outlook to 2035, allowing you to compare cycles, structural shifts, and policy impacts.
Market size and growth in value and volume terms
Consumption structure by end-use segments
Production capacity, output, and cost dynamics
Trade flows, exporters, importers, and balances
Price benchmarks, unit values, and margin signals
Competitive context and market entry conditions
Product coverageProdcom 21201270 – Medicaments containing corticosteroid hormones, their derivatives and structural analogues, put up in measured doses or for retail saleCountry coverageCountry profile and benchmarks
This report provides a consistent view of market size, trade balance, prices, and per-capita indicators for the United States. The profile highlights demand structure and trade position, enabling benchmarking against regional and global peers.
Methodology
The analysis is built on a multi-source framework that combines official statistics, trade records, company disclosures, and expert validation. Data are standardized, reconciled, and cross-checked to ensure consistency across time series.
International trade data (exports, imports, and mirror statistics)
National production and consumption statistics
Company-level information from financial filings and public releases
Price series and unit value benchmarks
Analyst review, outlier checks, and time-series validation
All data are normalized to a common product definition and mapped to a consistent set of codes. This ensures that comparisons across time are aligned and actionable.
Forecasts to 2035
The forecast horizon extends to 2035 and is based on a structured model that links medicaments containing corticosteroid hormones demand and supply to macroeconomic indicators, trade patterns, and sector-specific drivers. The model captures both cyclical and structural factors and reflects known policy and technology shifts in the United States.
Historical baseline: 2012-2025
Forecast horizon: 2026-2035
Scenario-based sensitivity to income growth, substitution, and regulation
Capacity and investment outlook for major producing companies
Each projection is built from national historical patterns and the broader regional context, allowing the report to show where growth is concentrated and where risks are elevated.
Price analysis and trade dynamics
Prices are analyzed in detail, including export and import unit values, regional spreads, and changes in trade costs. The report highlights how seasonality, freight rates, exchange rates, and supply disruptions influence pricing and margins.
Price benchmarks by country and sub-region
Export and import unit value trends
Seasonality and calendar effects in trade flows
Price outlook to 2035 under baseline assumptions
Profiles of market participants
Key producers, exporters, and distributors are profiled with a focus on their operational scale, geographic footprint, product mix, and market positioning. This helps identify competitive pressure points, partnership opportunities, and routes to differentiation.
Business focus and production capabilities
Geographic reach and distribution networks
Cost structure and pricing strategy indicators
Compliance, certification, and sustainability context
How to use this report
Quantify domestic demand and identify the most attractive segments
Evaluate export opportunities and prioritize target destinations
Track price dynamics and protect margins
Benchmark performance against leading competitors
Build evidence-based forecasts for investment decisions
This report is designed for manufacturers, distributors, importers, wholesalers, investors, and advisors who need a clear, data-driven picture of medicaments containing corticosteroid hormones dynamics in the United States.
FAQ
What is included in the medicaments containing corticosteroid hormones market in the United States?
The market size aggregates consumption and trade data, presented in both value and volume terms.
How are the forecasts to 2035 built?
The projections combine historical trends with macroeconomic indicators, trade dynamics, and sector-specific drivers.
Does the report cover prices and margins?
Yes, it includes export and import unit values, regional spreads, and a pricing outlook to 2035.
Which benchmarks are included?
The report benchmarks market size, trade balance, prices, and per-capita indicators for the United States.
Can this report support market entry decisions?
Yes, it highlights demand hotspots, trade routes, pricing trends, and competitive context.