

Feb 27, 2026
IndexBox has just published a new report: U.S. – Heterocyclic Compounds – Market Analysis, Forecast, Size, Trends and Insights.
The article provides a comprehensive analysis of the United States heterocyclic compounds market. It reports that in 2024, consumption was 351K tons (valued at $12.2B) and production was 314K tons (valued at $37.6B). The market is forecast to grow to 355K tons (volume) and $14.1B (value) by 2035. The US is a net importer, with 37K tons of imports (primarily from China, India, and Germany) valued at $1.4B, while exports plummeted to 211 tons valued at $25M. The analysis details trade dynamics, price trends by product type and country, and the market’s historical and projected performance.
Key Findings
US market forecast to grow modestly to 355K tons and $14.1B by 2035Domestic production ($37.6B) significantly exceeds apparent consumption value ($12.2B), indicating high-value specialized outputImports are vital, supplying 37K tons mainly from China and India, but import prices have fallen sharplyExports collapsed dramatically in 2024 to just 211 tons, a drop of over 98%A single import category (unfused pyridine rings, excluding pyridine salts) dominates, comprising 92% of import volume and 98% of import valueMarket Forecast
Driven by increasing demand for heterocyclic compounds in the United States, the market is expected to continue an upward consumption trend over the next decade. Market performance is forecast to retain its current trend pattern, expanding with an anticipated CAGR of +0.1% for the period from 2024 to 2035, which is projected to bring the market volume to 355K tons by the end of 2035.
In value terms, the market is forecast to increase with an anticipated CAGR of +1.3% for the period from 2024 to 2035, which is projected to bring the market value to $14.1B (in nominal wholesale prices) by the end of 2035.
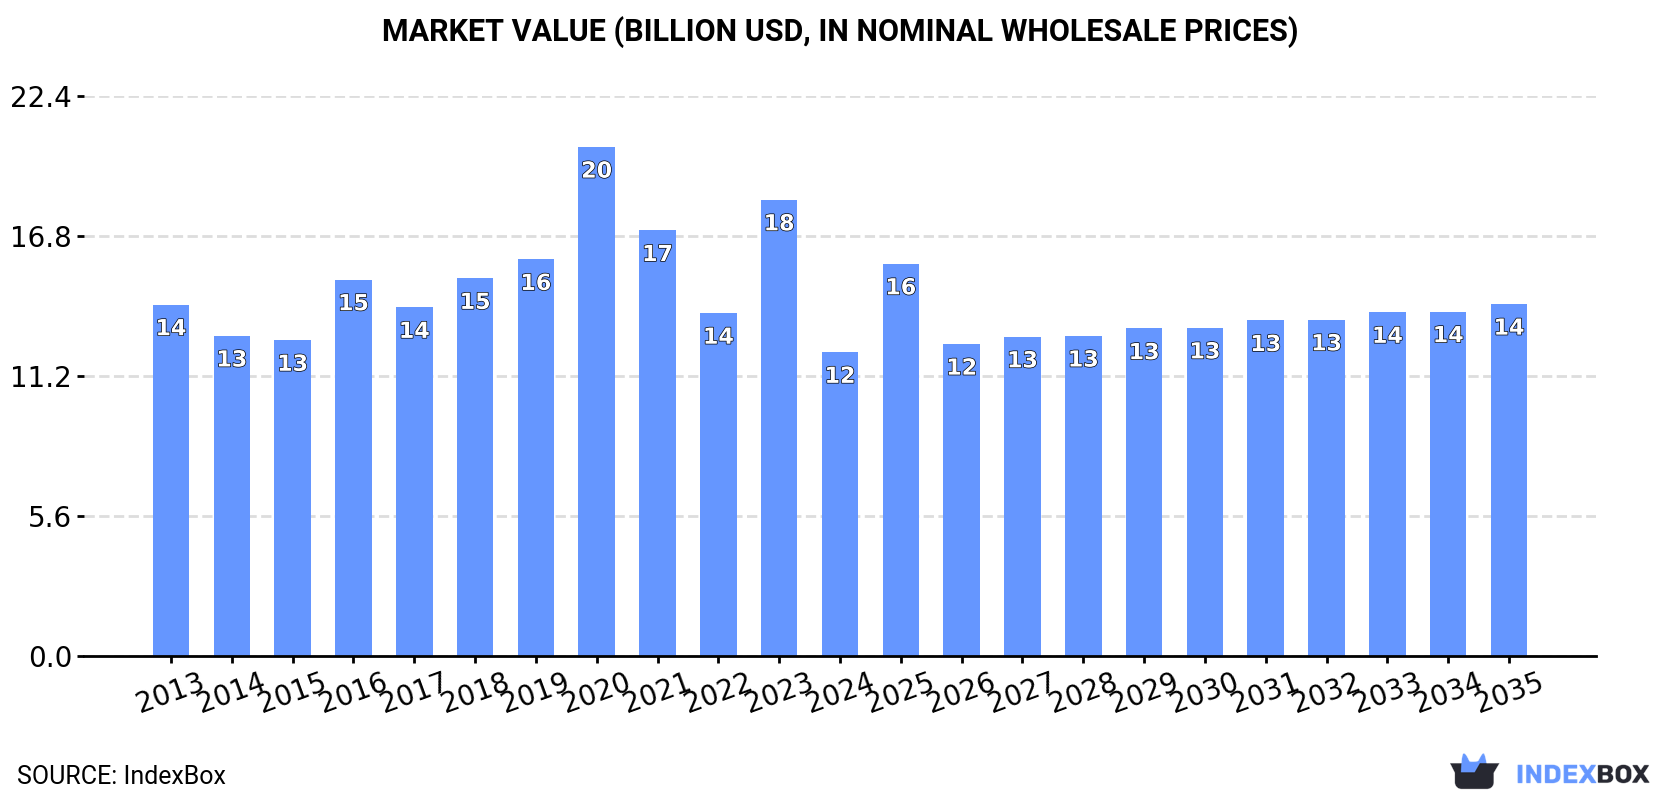 ConsumptionUnited States’s Consumption of Heterocyclic Compounds
Heterocyclic compound consumption in the United States dropped to 351K tons in 2024, falling by -2.3% on the previous year. Over the period under review, consumption, however, saw a relatively flat trend pattern. The pace of growth appeared the most rapid in 2019 with an increase of 4% against the previous year. Over the period under review, consumption hit record highs at 364K tons in 2021; however, from 2022 to 2024, consumption failed to regain momentum.
The revenue of the heterocyclic compound market in the United States declined rapidly to $12.2B in 2024, with a decrease of -33.4% against the previous year. This figure reflects the total revenues of producers and importers (excluding logistics costs, retail marketing costs, and retailers’ margins, which will be included in the final consumer price). In general, consumption recorded a mild curtailment. Over the period under review, the market attained the maximum level at $20.4B in 2020; however, from 2021 to 2024, consumption failed to regain momentum.
ProductionUnited States’s Production of Heterocyclic Compounds
Heterocyclic compound production in the United States fell to 314K tons in 2024, shrinking by -7.8% on 2023 figures. In general, production continues to indicate a relatively flat trend pattern. The most prominent rate of growth was recorded in 2019 with an increase of 4.4%. Heterocyclic compound production peaked at 360K tons in 2020; however, from 2021 to 2024, production stood at a somewhat lower figure.
In value terms, heterocyclic compound production soared to $37.6B in 2024. Over the period under review, production, however, saw strong growth. As a result, production reached the peak level and is likely to continue growth in the immediate term.
ImportsUnited States’s Imports of Heterocyclic Compounds
Heterocyclic compound imports into the United States expanded slightly to 37K tons in 2024, growing by 2.2% on the previous year’s figure. In general, imports continue to indicate a slight expansion. The growth pace was the most rapid in 2022 with an increase of 27% against the previous year. As a result, imports attained the peak of 48K tons. From 2023 to 2024, the growth of imports failed to regain momentum.
In value terms, heterocyclic compound imports contracted to $1.4B in 2024. Overall, imports, however, recorded a pronounced downturn. The pace of growth was the most pronounced in 2019 with an increase of 19%. Imports peaked at $2.3B in 2013; however, from 2014 to 2024, imports failed to regain momentum.
Imports By Country
India (12K tons), China (11K tons) and Germany (7.1K tons) were the main suppliers of heterocyclic compound imports to the United States, with a combined 83% share of total imports. Japan, the UK, Switzerland, Italy and France lagged somewhat behind, together accounting for a further 14%.
From 2013 to 2024, the biggest increases were recorded for the UK (with a CAGR of +18.6%), while purchases for the other leaders experienced more modest paces of growth.
In value terms, China ($429M) constituted the largest supplier of heterocyclic compounds to the United States, comprising 32% of total imports. The second position in the ranking was held by India ($203M), with a 15% share of total imports. It was followed by Germany, with a 9.3% share.
From 2013 to 2024, the average annual growth rate of value from China totaled +2.2%. The remaining supplying countries recorded the following average annual rates of imports growth: India (+5.9% per year) and Germany (-1.1% per year).
Imports By Type
In 2024, heterocyclic compounds; containing an unfused pyridine ring (whether or not hydrogenated) in the structure, other than pyridine and its salts (34K tons) was the main type of heterocyclic compounds supplied to the United States, accounting for a 92% share of total imports. Moreover, heterocyclic compounds; containing an unfused pyridine ring (whether or not hydrogenated) in the structure, other than pyridine and its salts exceeded the figures recorded for the second-largest type, heterocyclic compounds; containing an unfused pyridine ring (whether or not hydrogenated) in the structure, pyridine and its salts (2.9K tons), more than tenfold. Heterocyclic compounds; containing an unfused pyridine ring (whether or not hydrogenated) in the structure, piperidine and its salts (157 tons) ranked third in terms of total imports with a 0.4% share.
From 2013 to 2024, the average annual growth rate of the volume of heterocyclic compounds; containing an unfused pyridine ring (whether or not hydrogenated) in the structure, other than pyridine and its salts imports amounted to +1.1%. With regard to the other supplied products, the following average annual rates of growth were recorded: heterocyclic compounds; containing an unfused pyridine ring (whether or not hydrogenated) in the structure, pyridine and its salts (-0.5% per year) and heterocyclic compounds; containing an unfused pyridine ring (whether or not hydrogenated) in the structure, piperidine and its salts (+7.0% per year).
In value terms, heterocyclic compounds; containing an unfused pyridine ring (whether or not hydrogenated) in the structure, other than pyridine and its salts ($1.3B) constituted the largest type of heterocyclic compounds supplied to the United States, comprising 98% of total imports. The second position in the ranking was held by heterocyclic compounds; containing an unfused pyridine ring (whether or not hydrogenated) in the structure, pyridine and its salts ($16M), with a 1.2% share of total imports. It was followed by heterocyclic compounds; containing an unfused pyridine ring (whether or not hydrogenated) in the structure, piperidine and its salts, with a 0.3% share.
From 2013 to 2024, the average annual rate of growth in terms of the value of heterocyclic compounds; containing an unfused pyridine ring (whether or not hydrogenated) in the structure, other than pyridine and its salts imports stood at -4.7%. With regard to the other supplied products, the following average annual rates of growth were recorded: heterocyclic compounds; containing an unfused pyridine ring (whether or not hydrogenated) in the structure, pyridine and its salts (+1.5% per year) and heterocyclic compounds; containing an unfused pyridine ring (whether or not hydrogenated) in the structure, piperidine and its salts (+8.4% per year).
Import Prices By Type
The average heterocyclic compound import price stood at $36,644 per ton in 2024, with a decrease of -15.8% against the previous year. In general, the import price saw a abrupt decrease. The pace of growth appeared the most rapid in 2019 an increase of 14%. The import price peaked at $68,554 per ton in 2013; however, from 2014 to 2024, import prices failed to regain momentum.
Prices varied noticeably by the product type; the product with the highest price was heterocyclic compounds; containing an unfused pyridine ring (whether or not hydrogenated) in the structure, other than pyridine and its salts, other than piperidine and its salts ($550,209 per ton), while the price for heterocyclic compounds; containing an unfused pyridine ring (whether or not hydrogenated) in the structure, pyridine and its salts ($5,641 per ton) was amongst the lowest.
From 2013 to 2024, the most notable rate of growth in terms of prices was attained by heterocyclic compounds; containing an unfused pyridine ring (whether or not hydrogenated) in the structure, pyridine and its salts (+2.0%), while the prices for the other products experienced mixed trend patterns.
Import Prices By Country
In 2024, the average heterocyclic compound import price amounted to $36,644 per ton, which is down by -15.8% against the previous year. Overall, the import price showed a abrupt curtailment. The pace of growth appeared the most rapid in 2019 an increase of 14%. Over the period under review, average import prices reached the peak figure at $68,554 per ton in 2013; however, from 2014 to 2024, import prices remained at a lower figure.
Prices varied noticeably by country of origin: amid the top importers, the country with the highest price was Switzerland ($140,882 per ton), while the price for India ($16,821 per ton) was amongst the lowest.
From 2013 to 2024, the most notable rate of growth in terms of prices was attained by Switzerland (+9.3%), while the prices for the other major suppliers experienced more modest paces of growth.
ExportsUnited States’s Exports of Heterocyclic Compounds
In 2024, approx. 211 tons of heterocyclic compounds were exported from the United States; waning by -98.8% against 2023 figures. Over the period under review, exports showed a precipitous decrease. The pace of growth was the most pronounced in 2017 when exports increased by 26% against the previous year. The exports peaked at 36K tons in 2019; however, from 2020 to 2024, the exports stood at a somewhat lower figure.
In value terms, heterocyclic compound exports reduced remarkably to $25M in 2024. Overall, exports saw a dramatic decrease. The most prominent rate of growth was recorded in 2015 with an increase of 27%. As a result, the exports reached the peak of $1.9B. From 2016 to 2024, the growth of the exports failed to regain momentum.
Exports By Country
Mexico (78 tons), Canada (56 tons) and India (38 tons) were the main destinations of heterocyclic compound exports from the United States, with a combined 81% share of total exports.
From 2013 to 2024, the most notable rate of growth in terms of shipments, amongst the main countries of destination, was attained by Canada (with a CAGR of -20.4%), while the other leaders experienced a decline.
In value terms, Canada ($10M) emerged as the key foreign market for heterocyclic compounds exports from the United States, comprising 40% of total exports. The second position in the ranking was taken by Mexico ($1.9M), with a 7.4% share of total exports. It was followed by South Korea, with a 6.5% share.
From 2013 to 2024, the average annual rate of growth in terms of value to Canada amounted to -4.1%. Exports to the other major destinations recorded the following average annual rates of exports growth: Mexico (-20.6% per year) and South Korea (-18.1% per year).
Export Prices By Type
In 2024, the average heterocyclic compound export price amounted to $119,747 per ton, picking up by 86% against the previous year. Over the period under review, the export price showed a buoyant expansion. As a result, the export price attained the peak level and is likely to continue growth in the immediate term.
There were significant differences in the average prices for the major types of exported product. In 2024, the product with the highest price was heterocyclic compounds; containing an unfused pyridine ring (whether or not hydrogenated) in the structure, other than pyridine and its salts, other than piperidine and its salts ($244,396 per ton), while the average price for exports of heterocyclic compounds; containing an unfused pyridine ring (whether or not hydrogenated) in the structure, other than pyridine and its salts ($31,612 per ton) was amongst the lowest.
From 2013 to 2024, the most notable rate of growth in terms of prices was recorded for the following types: heterocyclic compounds; containing an unfused pyridine ring (whether or not hydrogenated) in the structure, other than pyridine and its salts, other than piperidine and its salts (+20.5%), while the prices for the other products experienced mixed trend patterns.
Export Prices By Country
In 2024, the average heterocyclic compound export price amounted to $119,747 per ton, growing by 86% against the previous year. Over the period under review, the export price enjoyed a buoyant increase. As a result, the export price reached the peak level and is likely to continue growth in the immediate term.
Prices varied noticeably by country of destination: amid the top suppliers, the country with the highest price was Germany ($2,773,473 per ton), while the average price for exports to France ($12,599 per ton) was amongst the lowest.
From 2013 to 2024, the most notable rate of growth in terms of prices was recorded for supplies to Germany (+42.5%), while the prices for the other major destinations experienced more modest paces of growth.
Source: IndexBox Market Intelligence Platform
This report provides a comprehensive view of the heterocyclic compound industry in the United States, tracking demand, supply, and trade flows across the national value chain. It explains how demand across key channels and end-use segments shapes consumption patterns, while also mapping the role of input availability, production efficiency, and regulatory standards on supply.
Beyond headline metrics, the study benchmarks prices, margins, and trade routes so you can see where value is created and how it moves between domestic suppliers and international partners. The analysis is designed to support strategic planning, market entry, portfolio prioritization, and risk management in the heterocyclic compound landscape in the United States.
Quick navigation
Key findings
Domestic demand is shaped by both household and industrial usage, with trade flows linking local supply to imports and exports.
Pricing dynamics reflect unit values, freight costs, exchange rates, and regulatory shifts that affect sourcing decisions.
Supply depends on input availability and production efficiency, creating a distinct national cost curve.
Market concentration varies by segment, creating different competitive landscapes and entry barriers.
The 2035 outlook highlights where capacity investment and demand growth are most aligned within the country.
Report scope
The report combines market sizing with trade intelligence and price analytics for the United States. It covers both historical performance and the forward outlook to 2035, allowing you to compare cycles, structural shifts, and policy impacts.
Market size and growth in value and volume terms
Consumption structure by end-use segments
Production capacity, output, and cost dynamics
Trade flows, exporters, importers, and balances
Price benchmarks, unit values, and margin signals
Competitive context and market entry conditions
Product coverageCountry coverageCountry profile and benchmarks
This report provides a consistent view of market size, trade balance, prices, and per-capita indicators for the United States. The profile highlights demand structure and trade position, enabling benchmarking against regional and global peers.
Methodology
The analysis is built on a multi-source framework that combines official statistics, trade records, company disclosures, and expert validation. Data are standardized, reconciled, and cross-checked to ensure consistency across time series.
International trade data (exports, imports, and mirror statistics)
National production and consumption statistics
Company-level information from financial filings and public releases
Price series and unit value benchmarks
Analyst review, outlier checks, and time-series validation
All data are normalized to a common product definition and mapped to a consistent set of codes. This ensures that comparisons across time are aligned and actionable.
Forecasts to 2035
The forecast horizon extends to 2035 and is based on a structured model that links heterocyclic compound demand and supply to macroeconomic indicators, trade patterns, and sector-specific drivers. The model captures both cyclical and structural factors and reflects known policy and technology shifts in the United States.
Historical baseline: 2012-2025
Forecast horizon: 2026-2035
Scenario-based sensitivity to income growth, substitution, and regulation
Capacity and investment outlook for major producing companies
Each projection is built from national historical patterns and the broader regional context, allowing the report to show where growth is concentrated and where risks are elevated.
Price analysis and trade dynamics
Prices are analyzed in detail, including export and import unit values, regional spreads, and changes in trade costs. The report highlights how seasonality, freight rates, exchange rates, and supply disruptions influence pricing and margins.
Price benchmarks by country and sub-region
Export and import unit value trends
Seasonality and calendar effects in trade flows
Price outlook to 2035 under baseline assumptions
Profiles of market participants
Key producers, exporters, and distributors are profiled with a focus on their operational scale, geographic footprint, product mix, and market positioning. This helps identify competitive pressure points, partnership opportunities, and routes to differentiation.
Business focus and production capabilities
Geographic reach and distribution networks
Cost structure and pricing strategy indicators
Compliance, certification, and sustainability context
How to use this report
Quantify domestic demand and identify the most attractive segments
Evaluate export opportunities and prioritize target destinations
Track price dynamics and protect margins
Benchmark performance against leading competitors
Build evidence-based forecasts for investment decisions
This report is designed for manufacturers, distributors, importers, wholesalers, investors, and advisors who need a clear, data-driven picture of heterocyclic compound dynamics in the United States.
FAQ
What is included in the heterocyclic compound market in the United States?
The market size aggregates consumption and trade data, presented in both value and volume terms.
How are the forecasts to 2035 built?
The projections combine historical trends with macroeconomic indicators, trade dynamics, and sector-specific drivers.
Does the report cover prices and margins?
Yes, it includes export and import unit values, regional spreads, and a pricing outlook to 2035.
Which benchmarks are included?
The report benchmarks market size, trade balance, prices, and per-capita indicators for the United States.
Can this report support market entry decisions?
Yes, it highlights demand hotspots, trade routes, pricing trends, and competitive context.