

While January 2026 was a big month for incoming retirement claims at OPM, February turned out to be even bigger. The total OPM retirement backlog grew by 21% last month and now stands at 65,237 total retirement claims.
The Office of Personnel Management received 31,240 total new retirement claims during February. Of those, 15,494 were digital and 15,746 were paper.
Moreover, since October 2025, when the total inventory was 34,587, it has grown by a whopping 88.6%. However, the number of claims getting processed each month has also grown substantially as well.
MetricOctober 2025February 2026Change (%)Monthly Claims Received20,34431,240+53.6%Monthly Claims Processed8,75118,149+107.4%Total Inventory34,58765,237+88.6%Digital Adoption Rate (%)30.4%49.6%+63.2%Total Average Processing Time79 days71 days-10.1%
Paper vs. Digital
A big part of the reason for the faster processing times is the adoption of digital retirement claims being processed through OPM’s Online Retirement Application (ORA) which launched last year.
In October 2025 (the first month of available data on digital retirement claims), about 3 in 10 claims were digital; now, however, they make up roughly half of all incoming claims.
As more and more are handled electronically, the processing times have been cut sharply, as indicated by the average processing times. In February, digital claims were processed nearly 3 times faster than paper.
MonthClaims ReceivedClaims ProcessedAvg. Processing Time (Days)DigitalPaperDigitalPaperDigitalPaperOct-256,17614,1681,6867,0654587Nov-257,83315,5604,3634,3443894Dec-256,0557,1193,5065,9224083Jan-269,3949,5296,4659,1064898Feb-2615,49415,7467,05411,0953495TOTAL (FYTD)44,95262,12223,07437,53241 (Avg)91 (Avg)
Based on these figures, OPM has processed approximately 51% of the digital claims it has received this fiscal year and approximately 60% of the paper claims.
February: Then and Now
While February is normally one of the busiest months of the year in terms of incoming retirement claims at OPM, 2026 has been an outlier, to say the least.
This table shows how February 2026 compares to the same time period over the last few years. Note also that OPM also processed more claims this year by far in this 6-year period.
Year (February)Claims ReceivedClaims ProcessedTotal InventoryAvg. Processing Time (Days)20209,2739,62723,6295420217,4958,00326,46077202212,2418,12435,4248920239,56210,92023,5006520248,79410,02519,5914720259,63712,36420,55044202631,24018,14965,23771
The latest monthly retirement claims processing data from OPM are included at the end of the article.
A Shrinking Federal Workforce
So far in fiscal year 2026, OPM received 107,074 new retirement claims and processed 60,606, roughly 57% of its incoming volume. This is an unusually high number of retirement claims in a five-month period.
The primary reason behind this surge in retirement claims has been the significant reductions made to the overall size of the federal workforce in the past year. According to OPM, there are now 2,035,344 federal employees, but that figure represents a sharp decline from two years ago. At its peak in 2024, there were 2,313,216 federal employees.
Fiscal YearTotal Employee CountAnnual Change% Change20242,313,216+52,200+2.31%20252,190,219-122,997-5.32%20262,035,344-154,875-7.07%
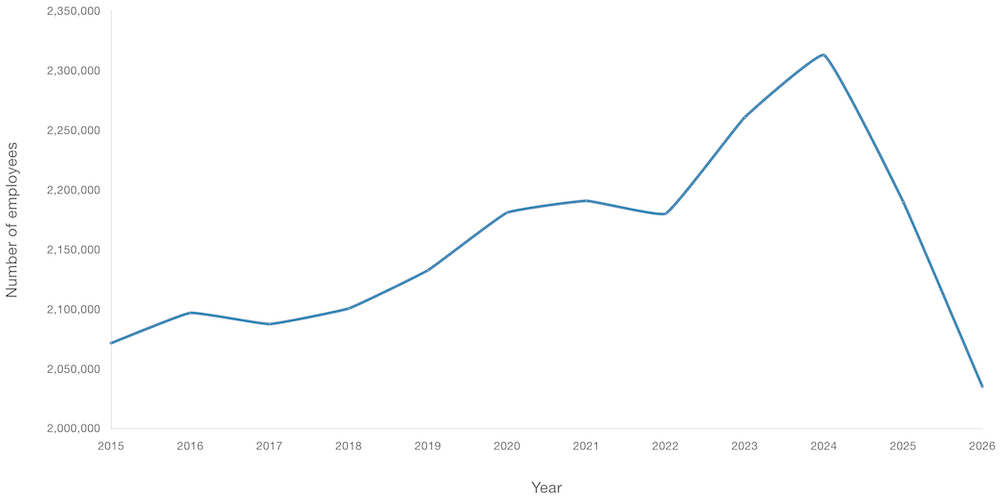 Federal workforce over time | Source: OPM
Since January 20, 2025, 264,228 federal employees have left the federal workforce. 52% of those employees (136,823 total) took the deferred resignation program buyout offer that was made in January 2025.
The decline in the number of federal employees in 2025 represents a sharp deviation in the trend of growth over the last decade.
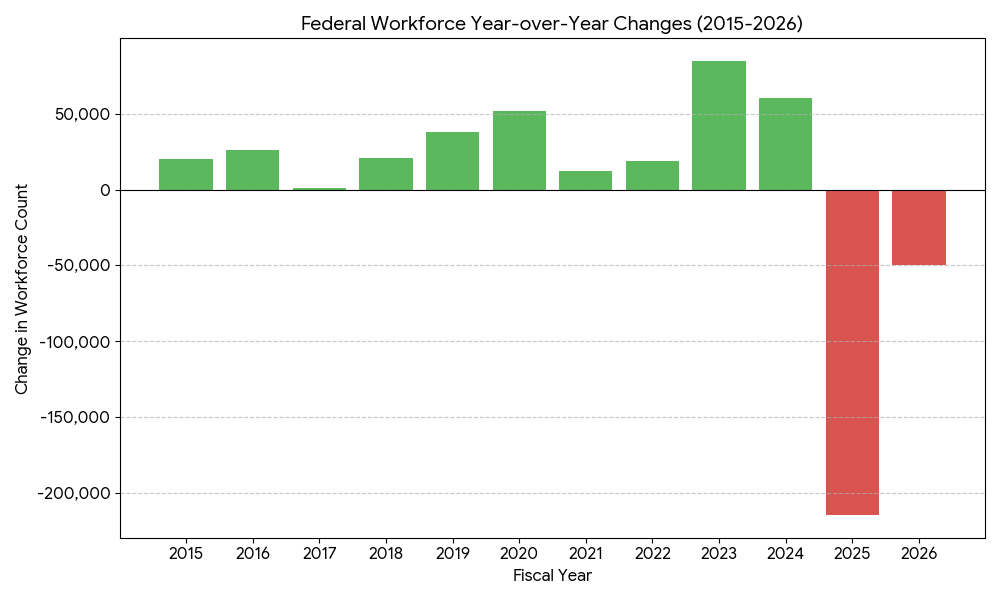 Source: OPM
Also of note, according to OPM, the average federal employee salary is now $111,862. The vast majority (60%) of federal employees are under the General Schedule (GS) pay system. Among GS employees, most are in the GS-11 through GS-14 levels.
GS GradeEmployee Count% of GS WorkforceGS-140.00%GS-2890.01%GS-31,2410.10%GS-46,0500.50%GS-542,7143.50%GS-681,1276.64%GS-778,2596.41%GS-844,1303.61%GS-9103,0748.44%GS-1013,7241.12%GS-11177,45914.53%GS-12 (Largest Group)268,13221.95%GS-13234,89119.23%GS-14120,6519.88%GS-1549,9044.09%Total GS Workforce1,221,449100.00%
OPM Retirement Processing Statistics as of February 2026
MonthDigital Claims ReceivedTotal Claims ReceivedDigital Claims ProcessedTotal Claims ProcessedDigital Processing Time in DaysTotal Average Processing Time in DaysFYTD Digital Processing Time in DaysFYTD Average Processing Time in DaysDigital InventoryTotal InventoryOct-256,17620,3441,6868,7514579457910,25234,587Nov-257,83323,3934,3638,7073866407313,83548,396Dec-256,05513,1743,5069,4284067407115,29550,566Jan-269,39418,9236,46515,5714877437319,61854,018Feb-2615,49431,2407,05418,1493471417227,58265,237
Retirement Services (RS) is working towards a fully digital retirement application process; RS is working with agencies and payroll offices to update legacy processes. During this period of transition, RS is still receiving many new retirement claims on paper.
In February RS Received 31,240 new retirement claims; of these 15,494 were digital and 15,746 were paper
The processing of digital cases is faster. With systematic checks of data, annuitants experience less delays due to missing information or incomplete packages.
In February RS processed 18,149 new retirement claims; of these 7,054 were digital and 11,095 were paper.
In February digital cases were processed in 34 days, and paper claims were processed in 95 days.
© 2026 Ian Smith. All rights reserved. This article
may not be reproduced without express written consent from Ian Smith.