

One of my earliest disaster-related memories is a tornado in 1990 that destroyed Petersburg, Indiana. Petersburg is a small place, just a couple thousand people, in a region made up entirely of small places. The EF-4 tornado ripped through the town in just a few minutes, destroying a nursing home, apartment complex, elementary school, two dozen businesses and nearly 200 homes. Four people lost their lives.
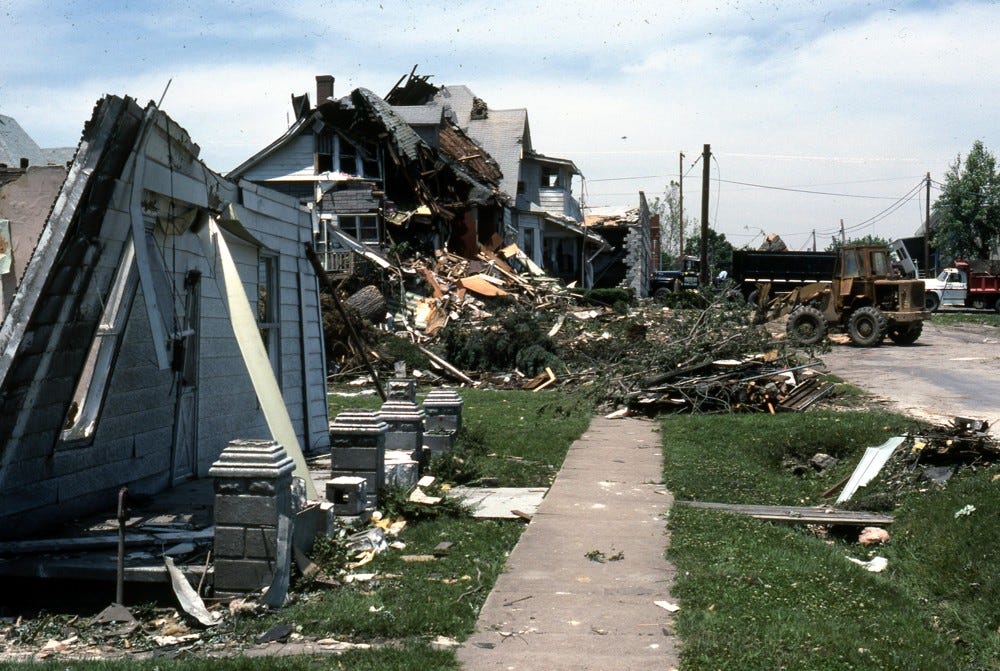 Petersburg, Indiana after an EF4 tornado struck on June 2, 1990. Source: USI
I doubt that anyone reading this remembers the disaster (except for my Jasper readers, big shoutout to the Hoosier state), but it permanently changed the town. It is one of countless forgotten disasters that have shaped rural lives and rural communities.
The United States is a big country. The headline disaster events are often centered in large cities (think the Los Angeles wildfires or Hurricane Katrina) where the concentration of people and economic activity means eye-popping costs and impacts. The density of universities, non-profit organizations and media in those places also means they receive ongoing attention and coverage. But policymakers and disaster professionals also need to be thinking about rural places like Petersburg, and not simply as smaller versions of cities. Small towns and rural communities have their own unique hazard exposures, vulnerabilities, needs and capabilities, i.e. their own risk dynamics. Understanding them is an essential step towards building national and rural resilience.
What are the disaster threats in rural communities, what are their unique vulnerabilities, and how well suited is our disaster policy for meeting their needs? Risk and Rurality is a new multi-part series where I will explore these questions and what evidence we have to help answer them. In this first installment I will look at the scope of the challenge nationwide.
I’ve spent more hours than I care to admit thinking about the question “what does it mean to be rural?” and I’ve written about it in the context of South Asian urbanization and the 2013 Colorado floods. I’m sure many of you also have strong opinions. I don’t want to rehash that debate here, but do hope that we all agree that population size is not the distinguishing feature of a rural place, or at least in isolation. There are many other factors that are also important: population density, economic activity, infrastructure, and proximity to metropolitan areas, to name a few. Culture.
It is also clear is that the binary of “rural/urban” is wholly insufficient for capturing the idea of rurality. Just as cities and urbanity are complex and varied – we don’t mistake Los Angeles for Omaha – so are small towns and rural places.
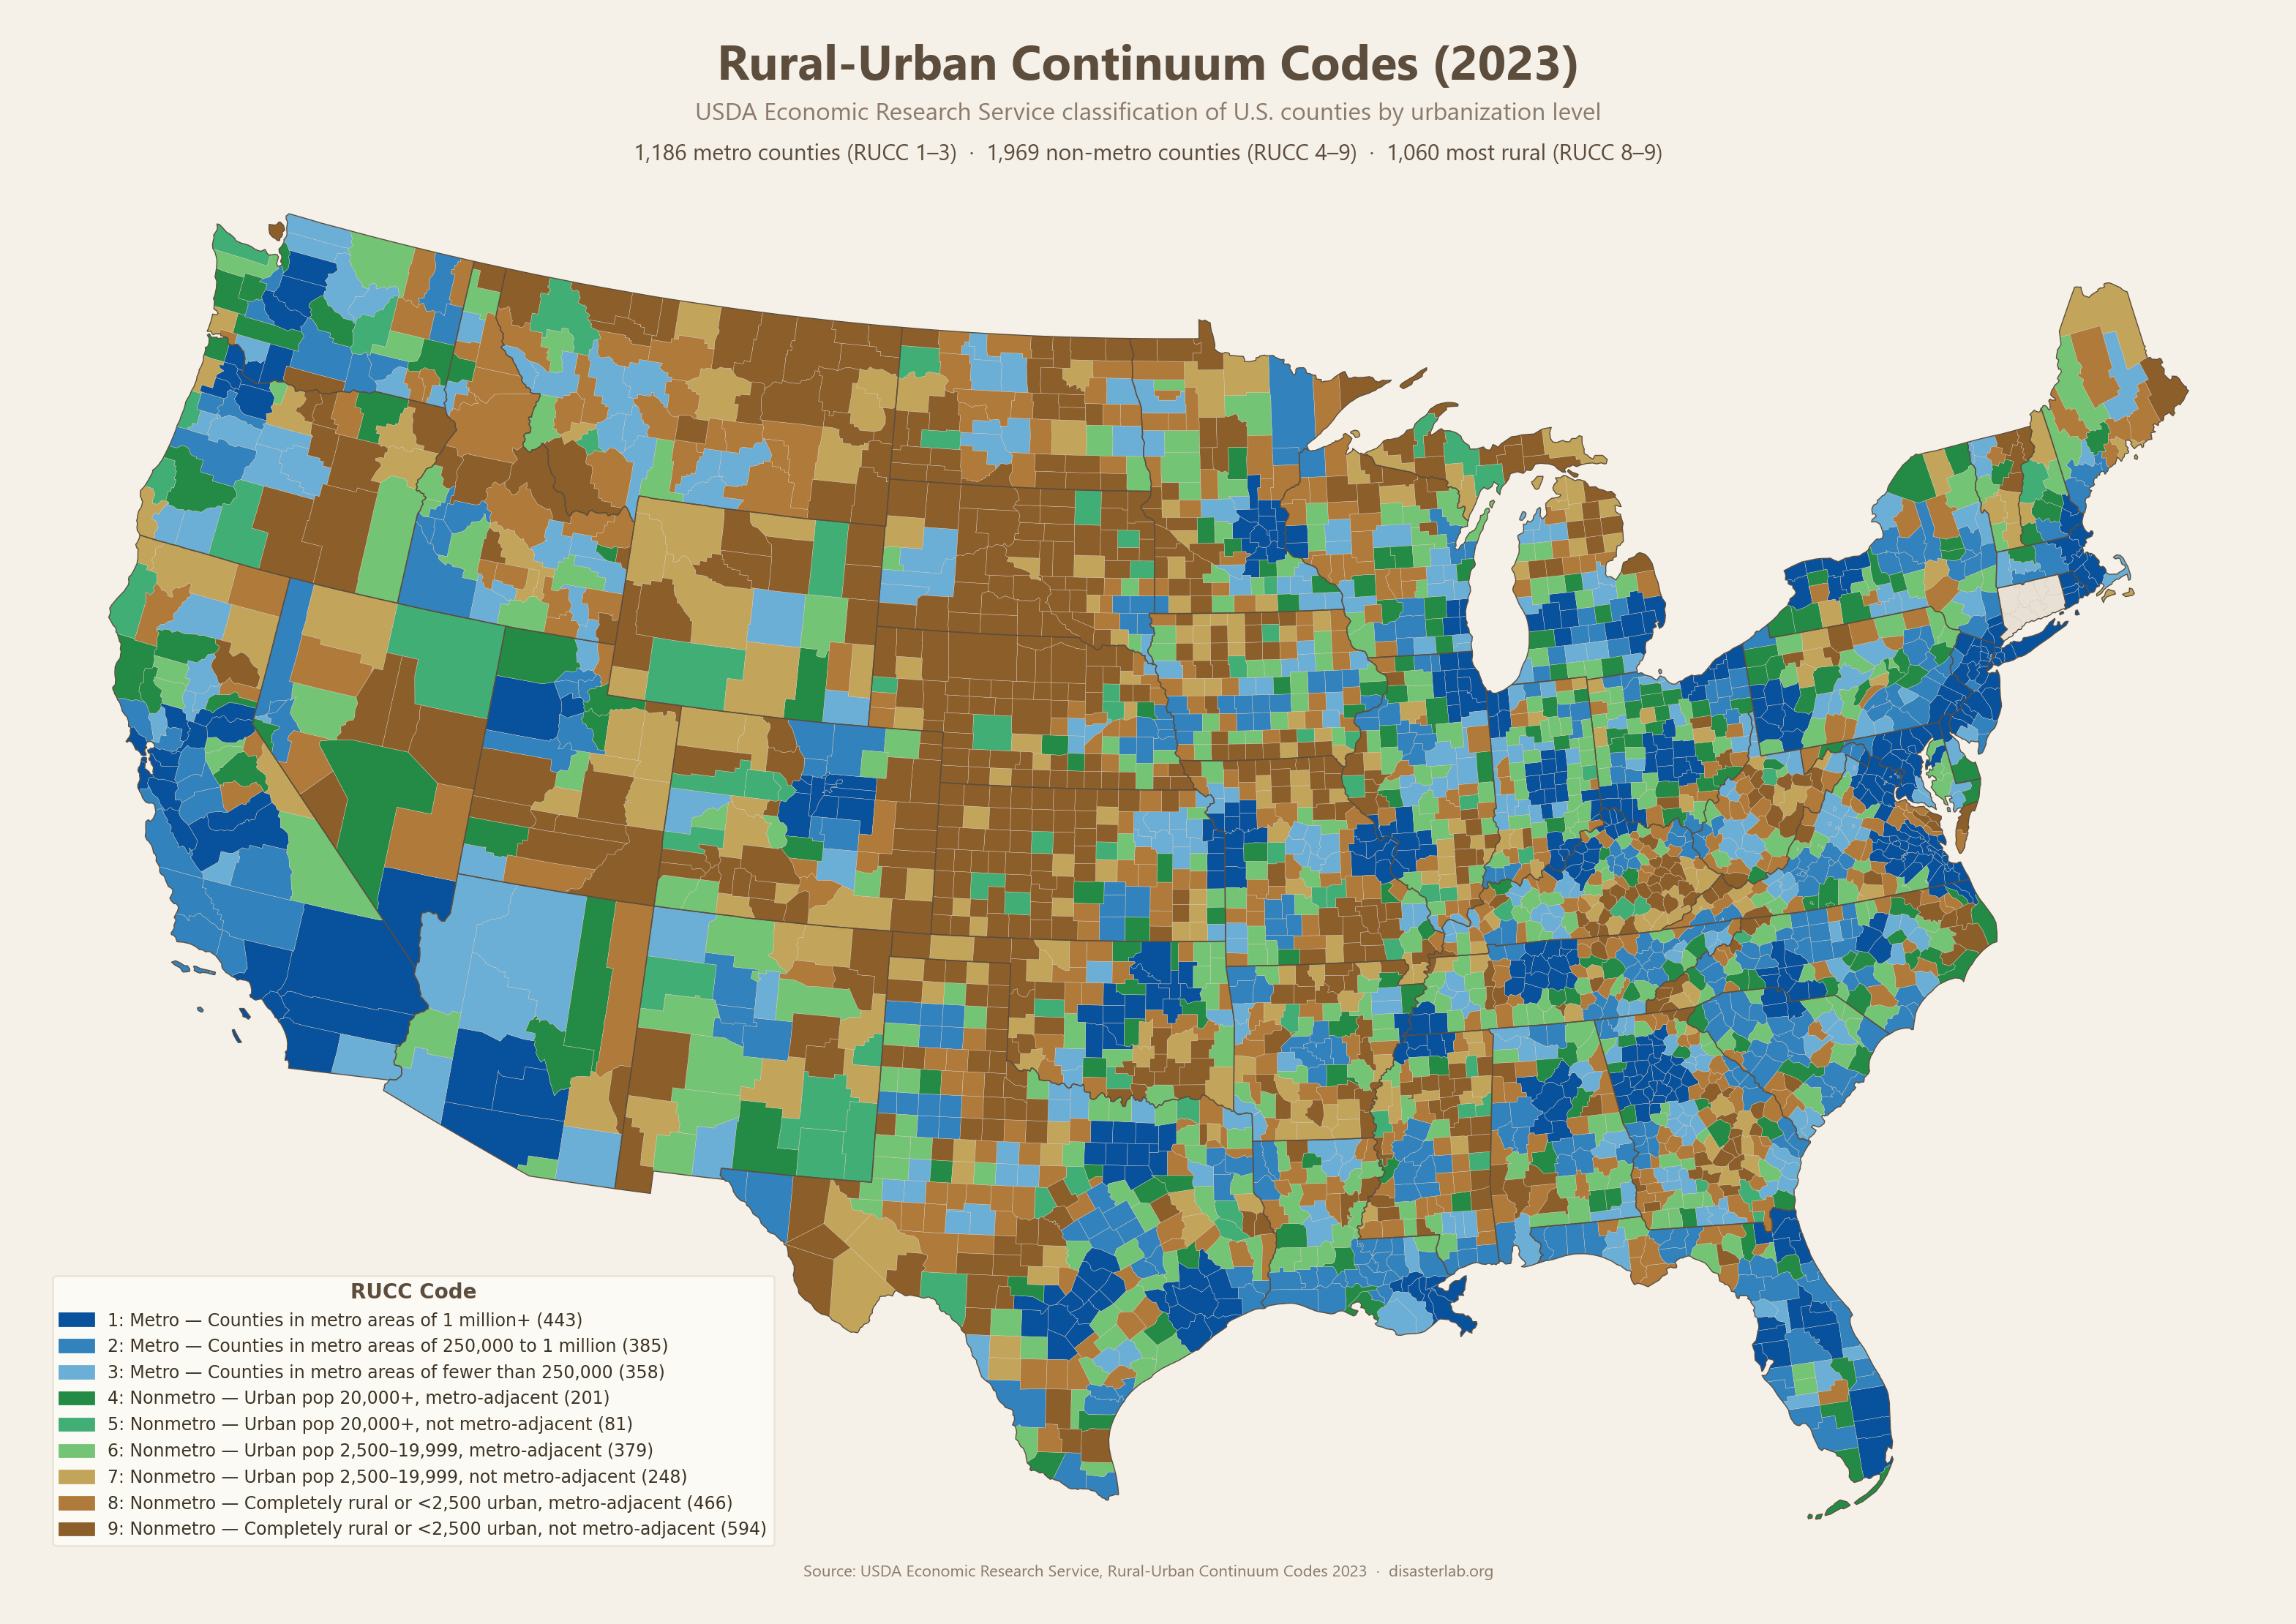
For this series we are going to leverage the Rural-Urban Continuum Codes from the US Department of Agriculture as a way of analyzing rurality and disaster risk. The RUCC classifies every county in the U.S. on a scale of 1-9, based on the population size and adjacency to metropolitan areas. In broad terms counties that are coded 1-3 are considered metropolitan, while those that are 4-9 are non-metropolitan, and the individual categories allow us to further differentiate places:
To examine the distribution of disaster risk according to each county’s RUCC code, I used data from the National Risk Index, which characterizes the expected annual losses (EAL) for each county in the U.S. from 18 different natural hazards. The EAL for each county is an estimate of three types of economic impacts – property loss, population impacts (converted into dollars), and agricultural losses. The NRI is a terrific tool for doing this type of top-level, generalized analysis about disaster risk, with some very obvious shortcomings. The most obvious is that the estimated losses are based on historic disaster events and do not account for climate change (and more on this in a future post).
With the help of AI, I brought the NRI data and RUCC codes together in a data dashboard where you can explore the intersection between the classification of counties and their EAL across all hazards and from of the most costly individual hazards (floods, wildfires, etc.). What are a few of the top level findings?
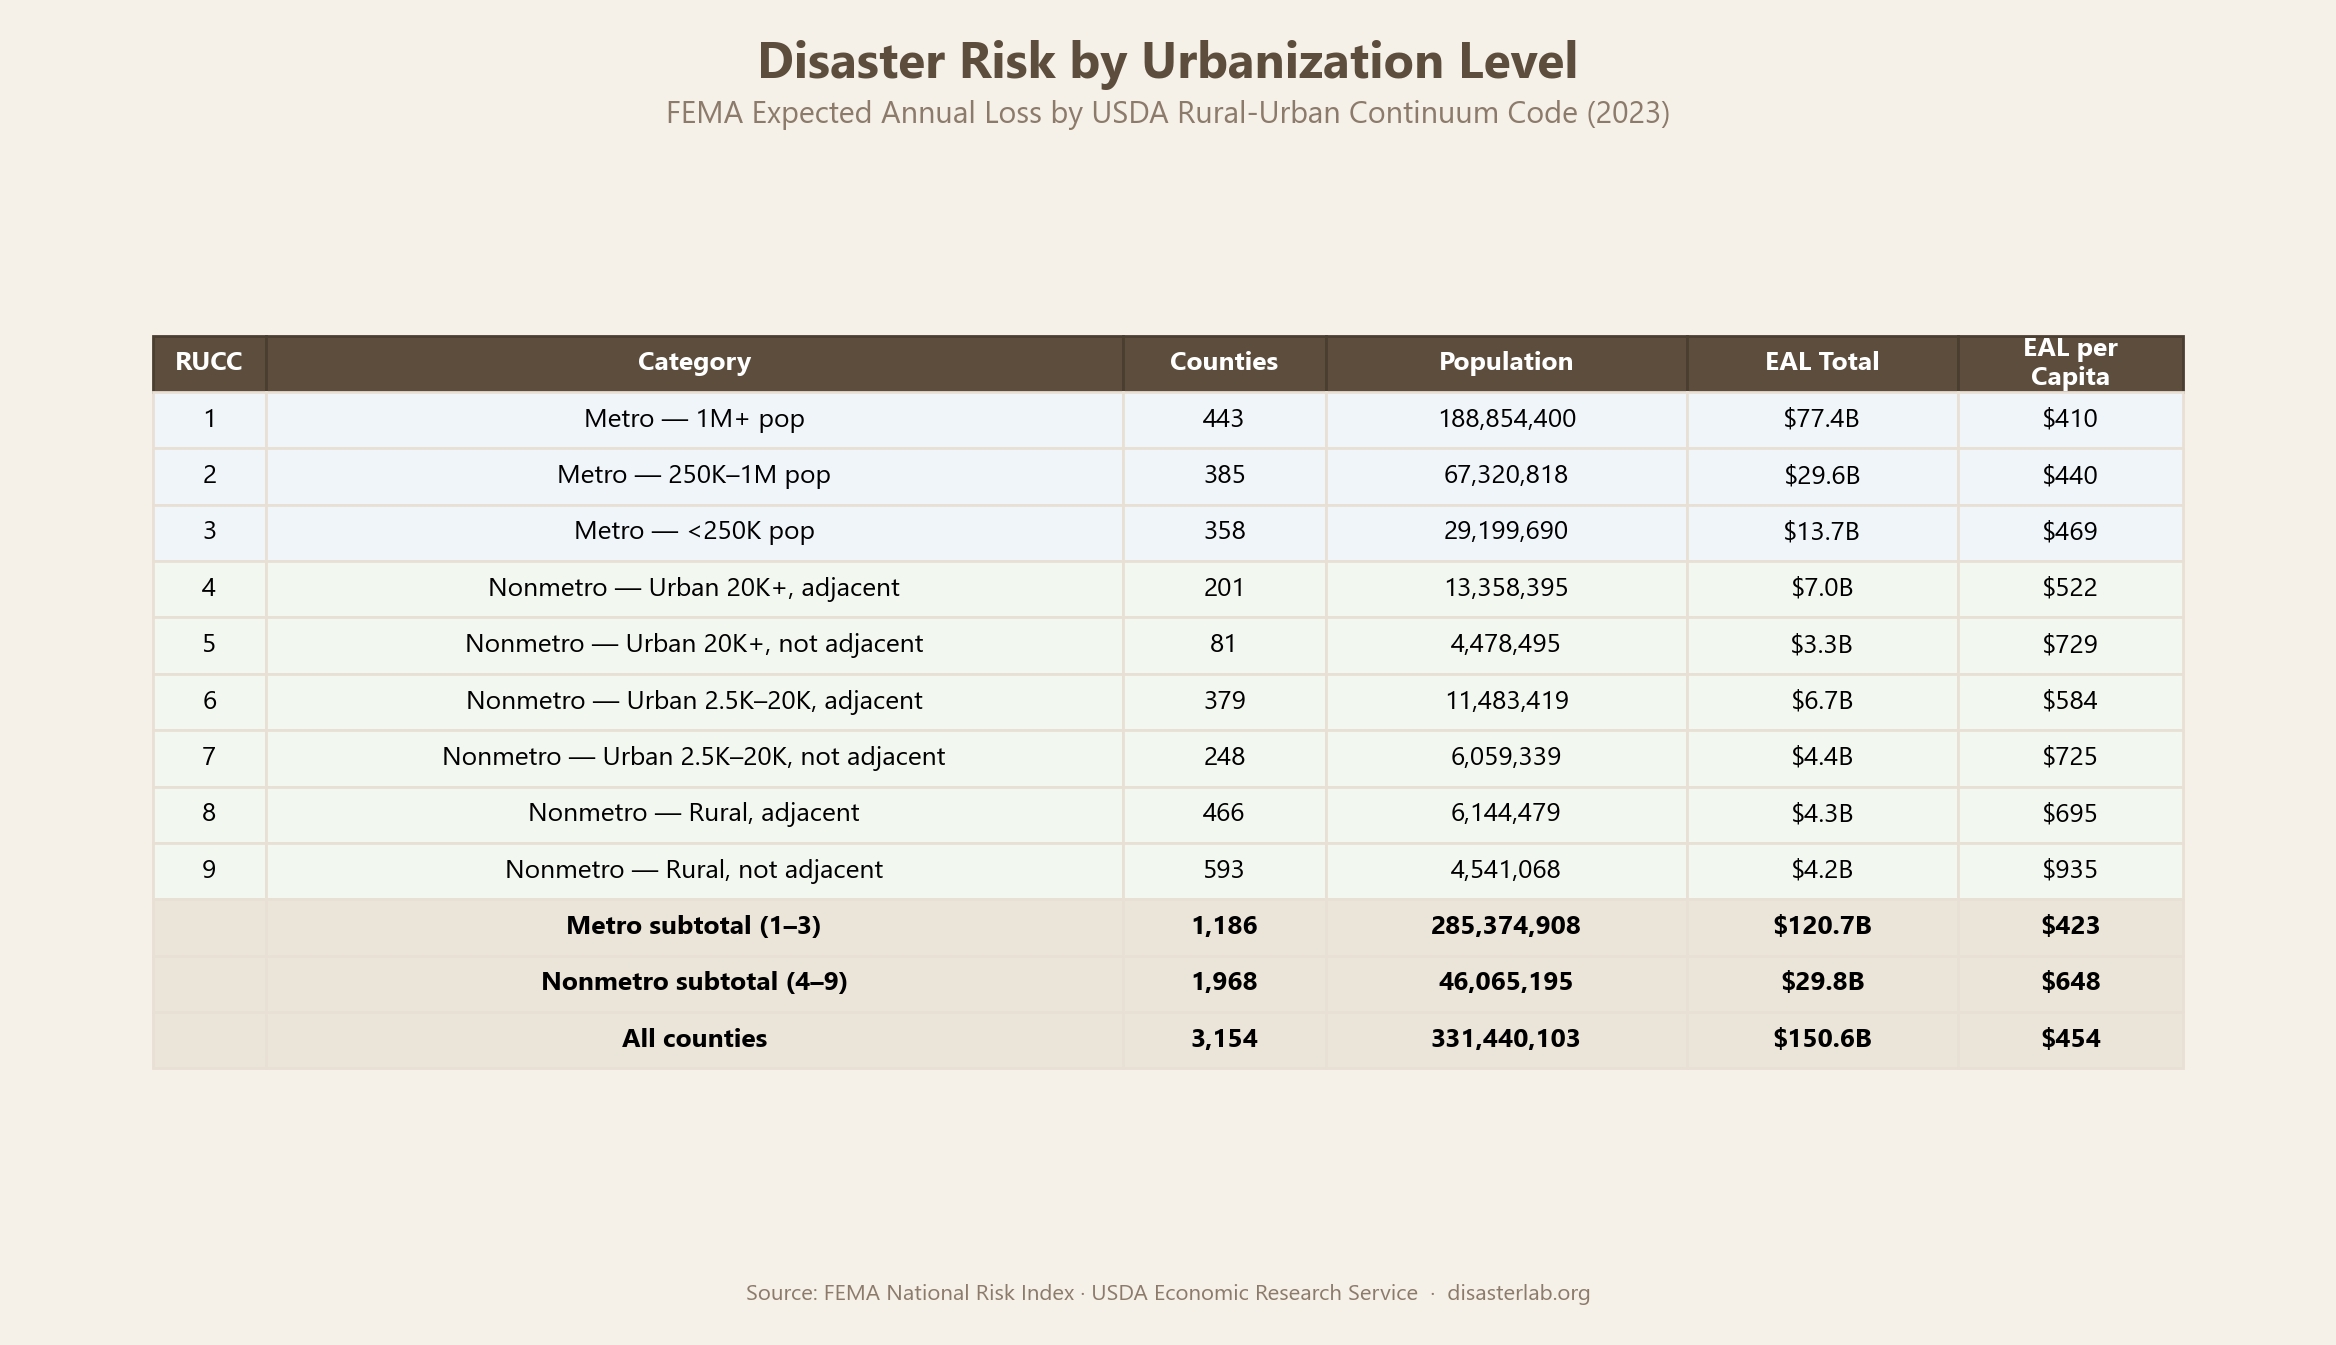
Expected losses from disasters are highest in metropolitan counties. Not surprisingly, the expected annual losses from disasters are concentrated in metropolitan counties, where 86.1% of the population lives. According to the NRI, 80.1% of the total EAL from natural hazards is in counties that are classified as metropolitan by the RUCC, i.e. codes 1-3.
Non-metropolitan areas are disproportionately at-risk. That means that the remaining 19.9% of disaster risk (EAL) is in non-metropolitan counties, which is proportionately higher. When we look at the EAL on a per-capita basis, we see that risk is relatively higher in rural areas and that there is a fairly linear progression of risk as we move from larger non-metropolitan counties to smaller ones. In fact, the per-capita EAL in communities categorized as RUCC code 9 are more than double that of all metropolitan counties:
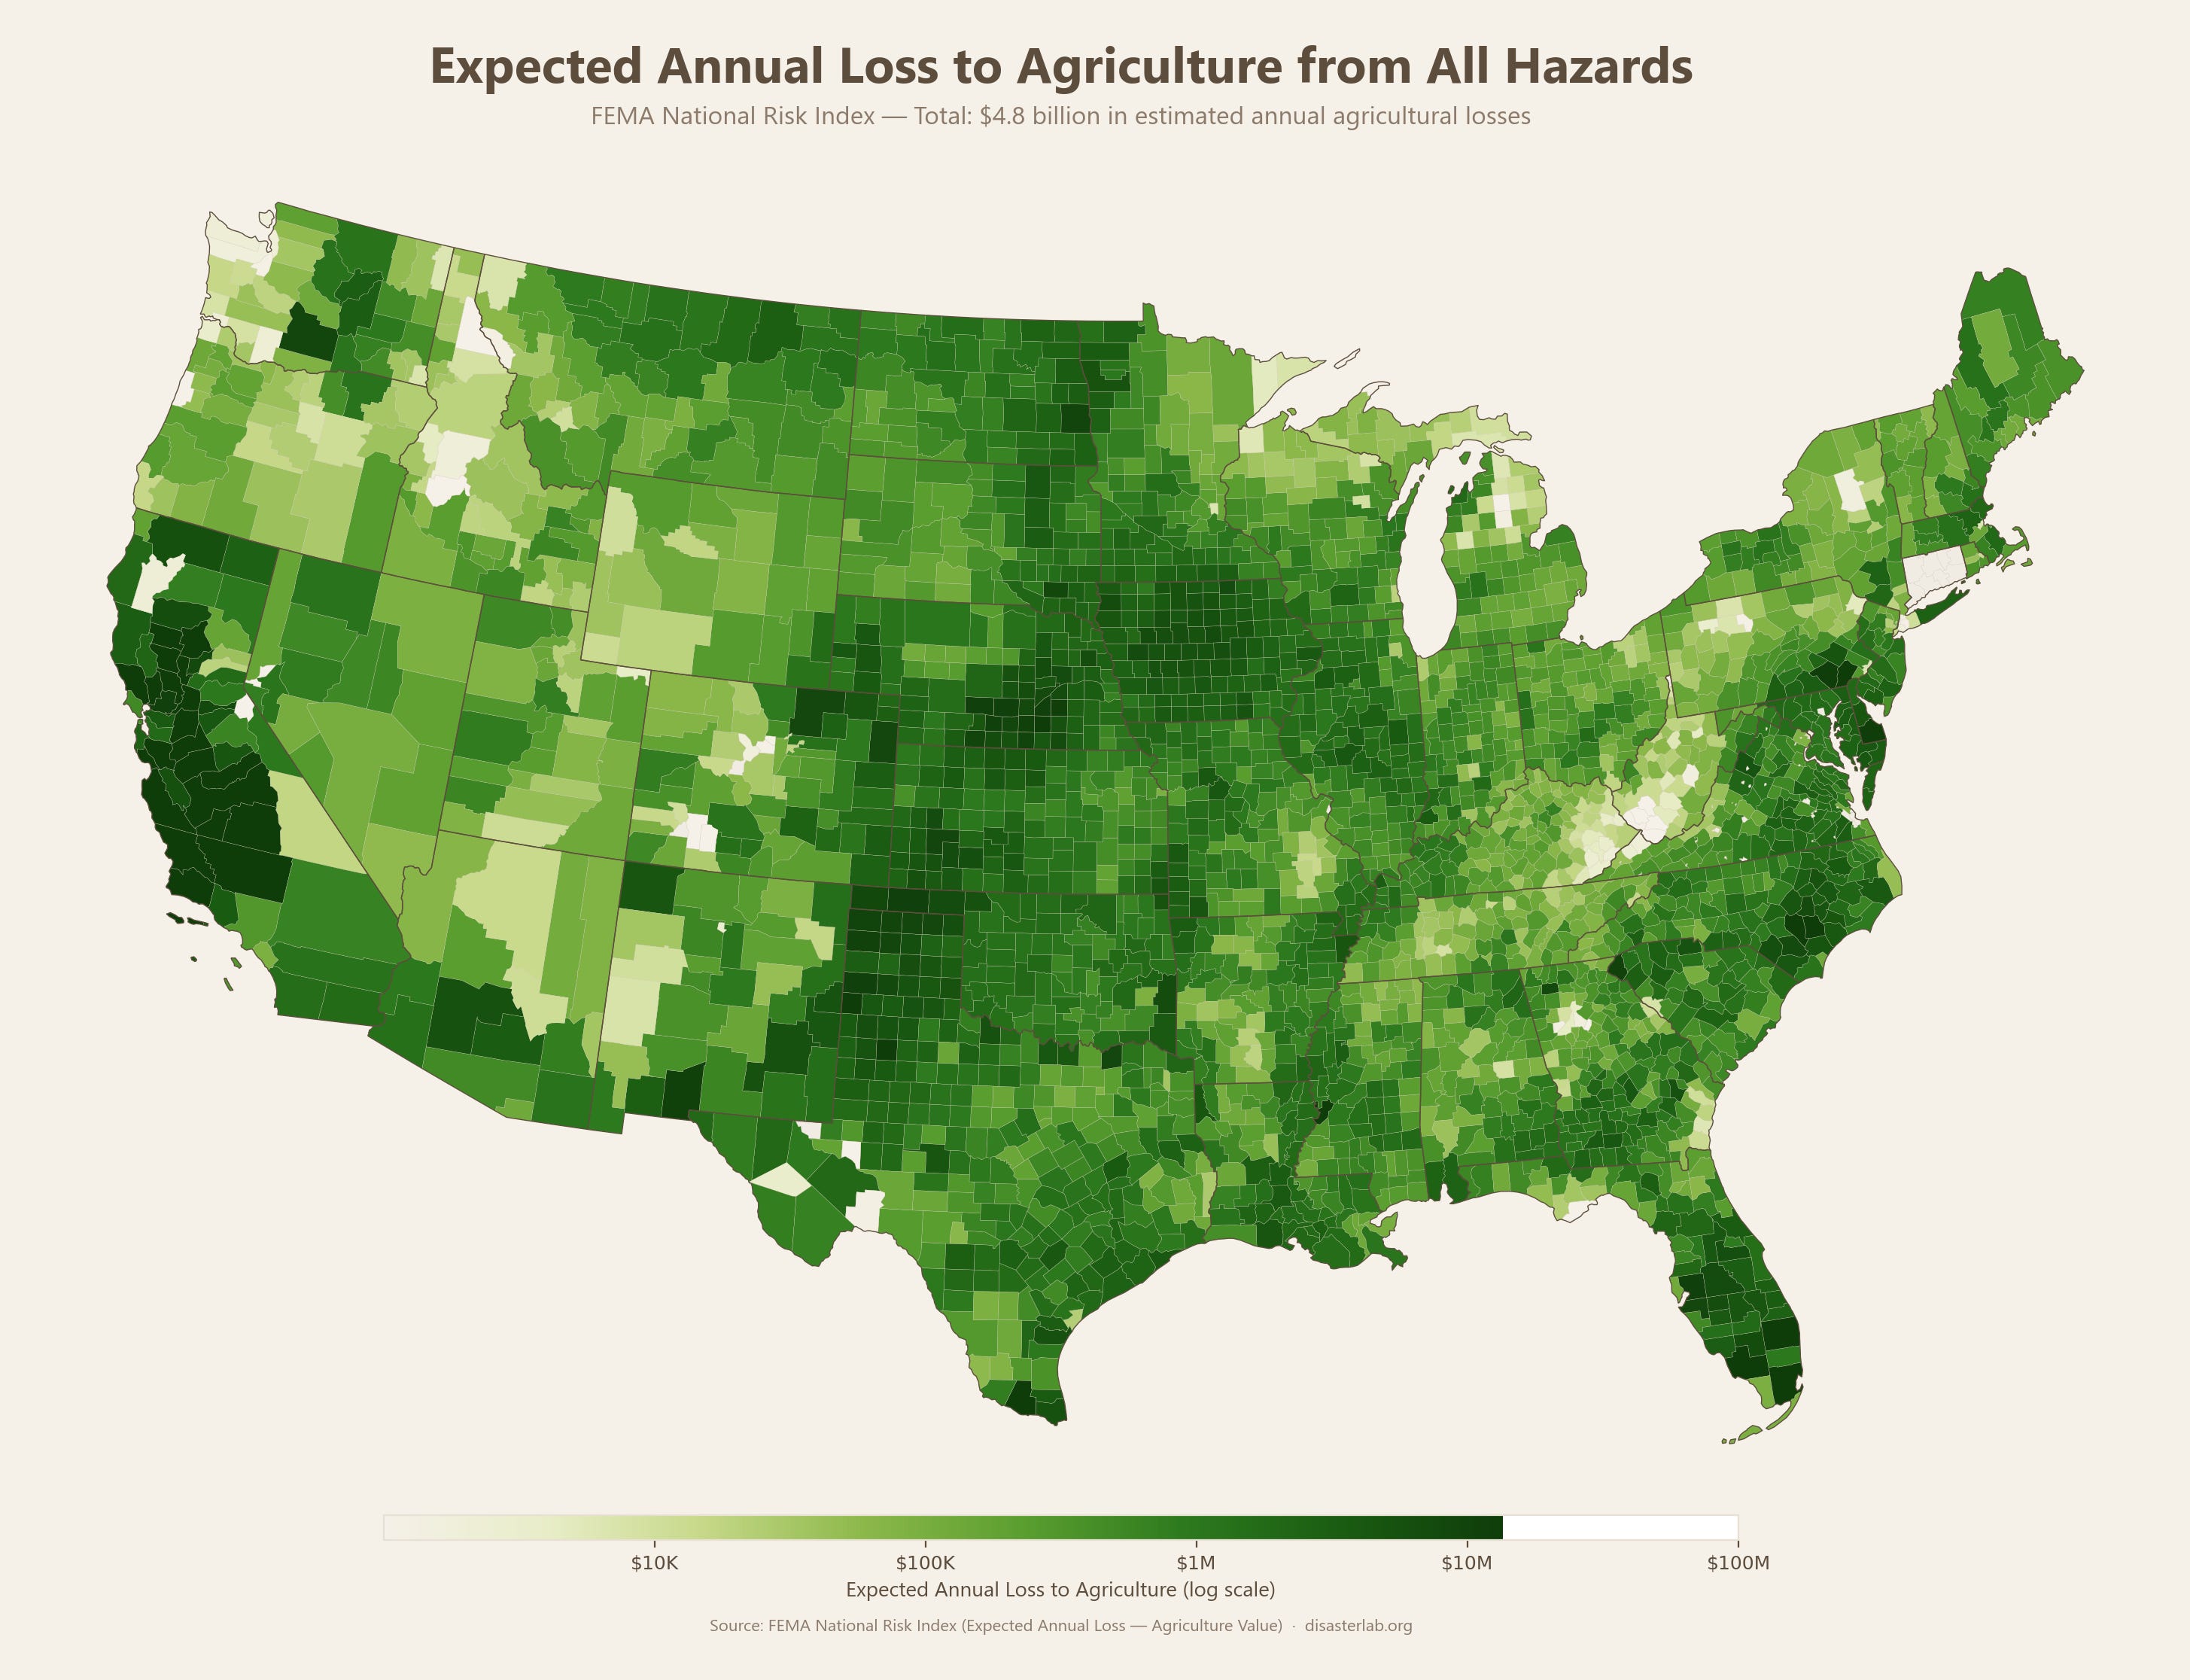
Agricultural risk is concentrated in non-metro counties. As expected, we see that the large majority of risk to property and people are in metropolitan areas, where those things are concentrated. Agricultural activities are concentrated in rural counties, however, and we see how agricultural exposure to losses from natural hazards is concentrated in rural regions like California’s Central Valley, the Texas panhandle, the Mississippi Delta, and the Midwest “corn belt”:
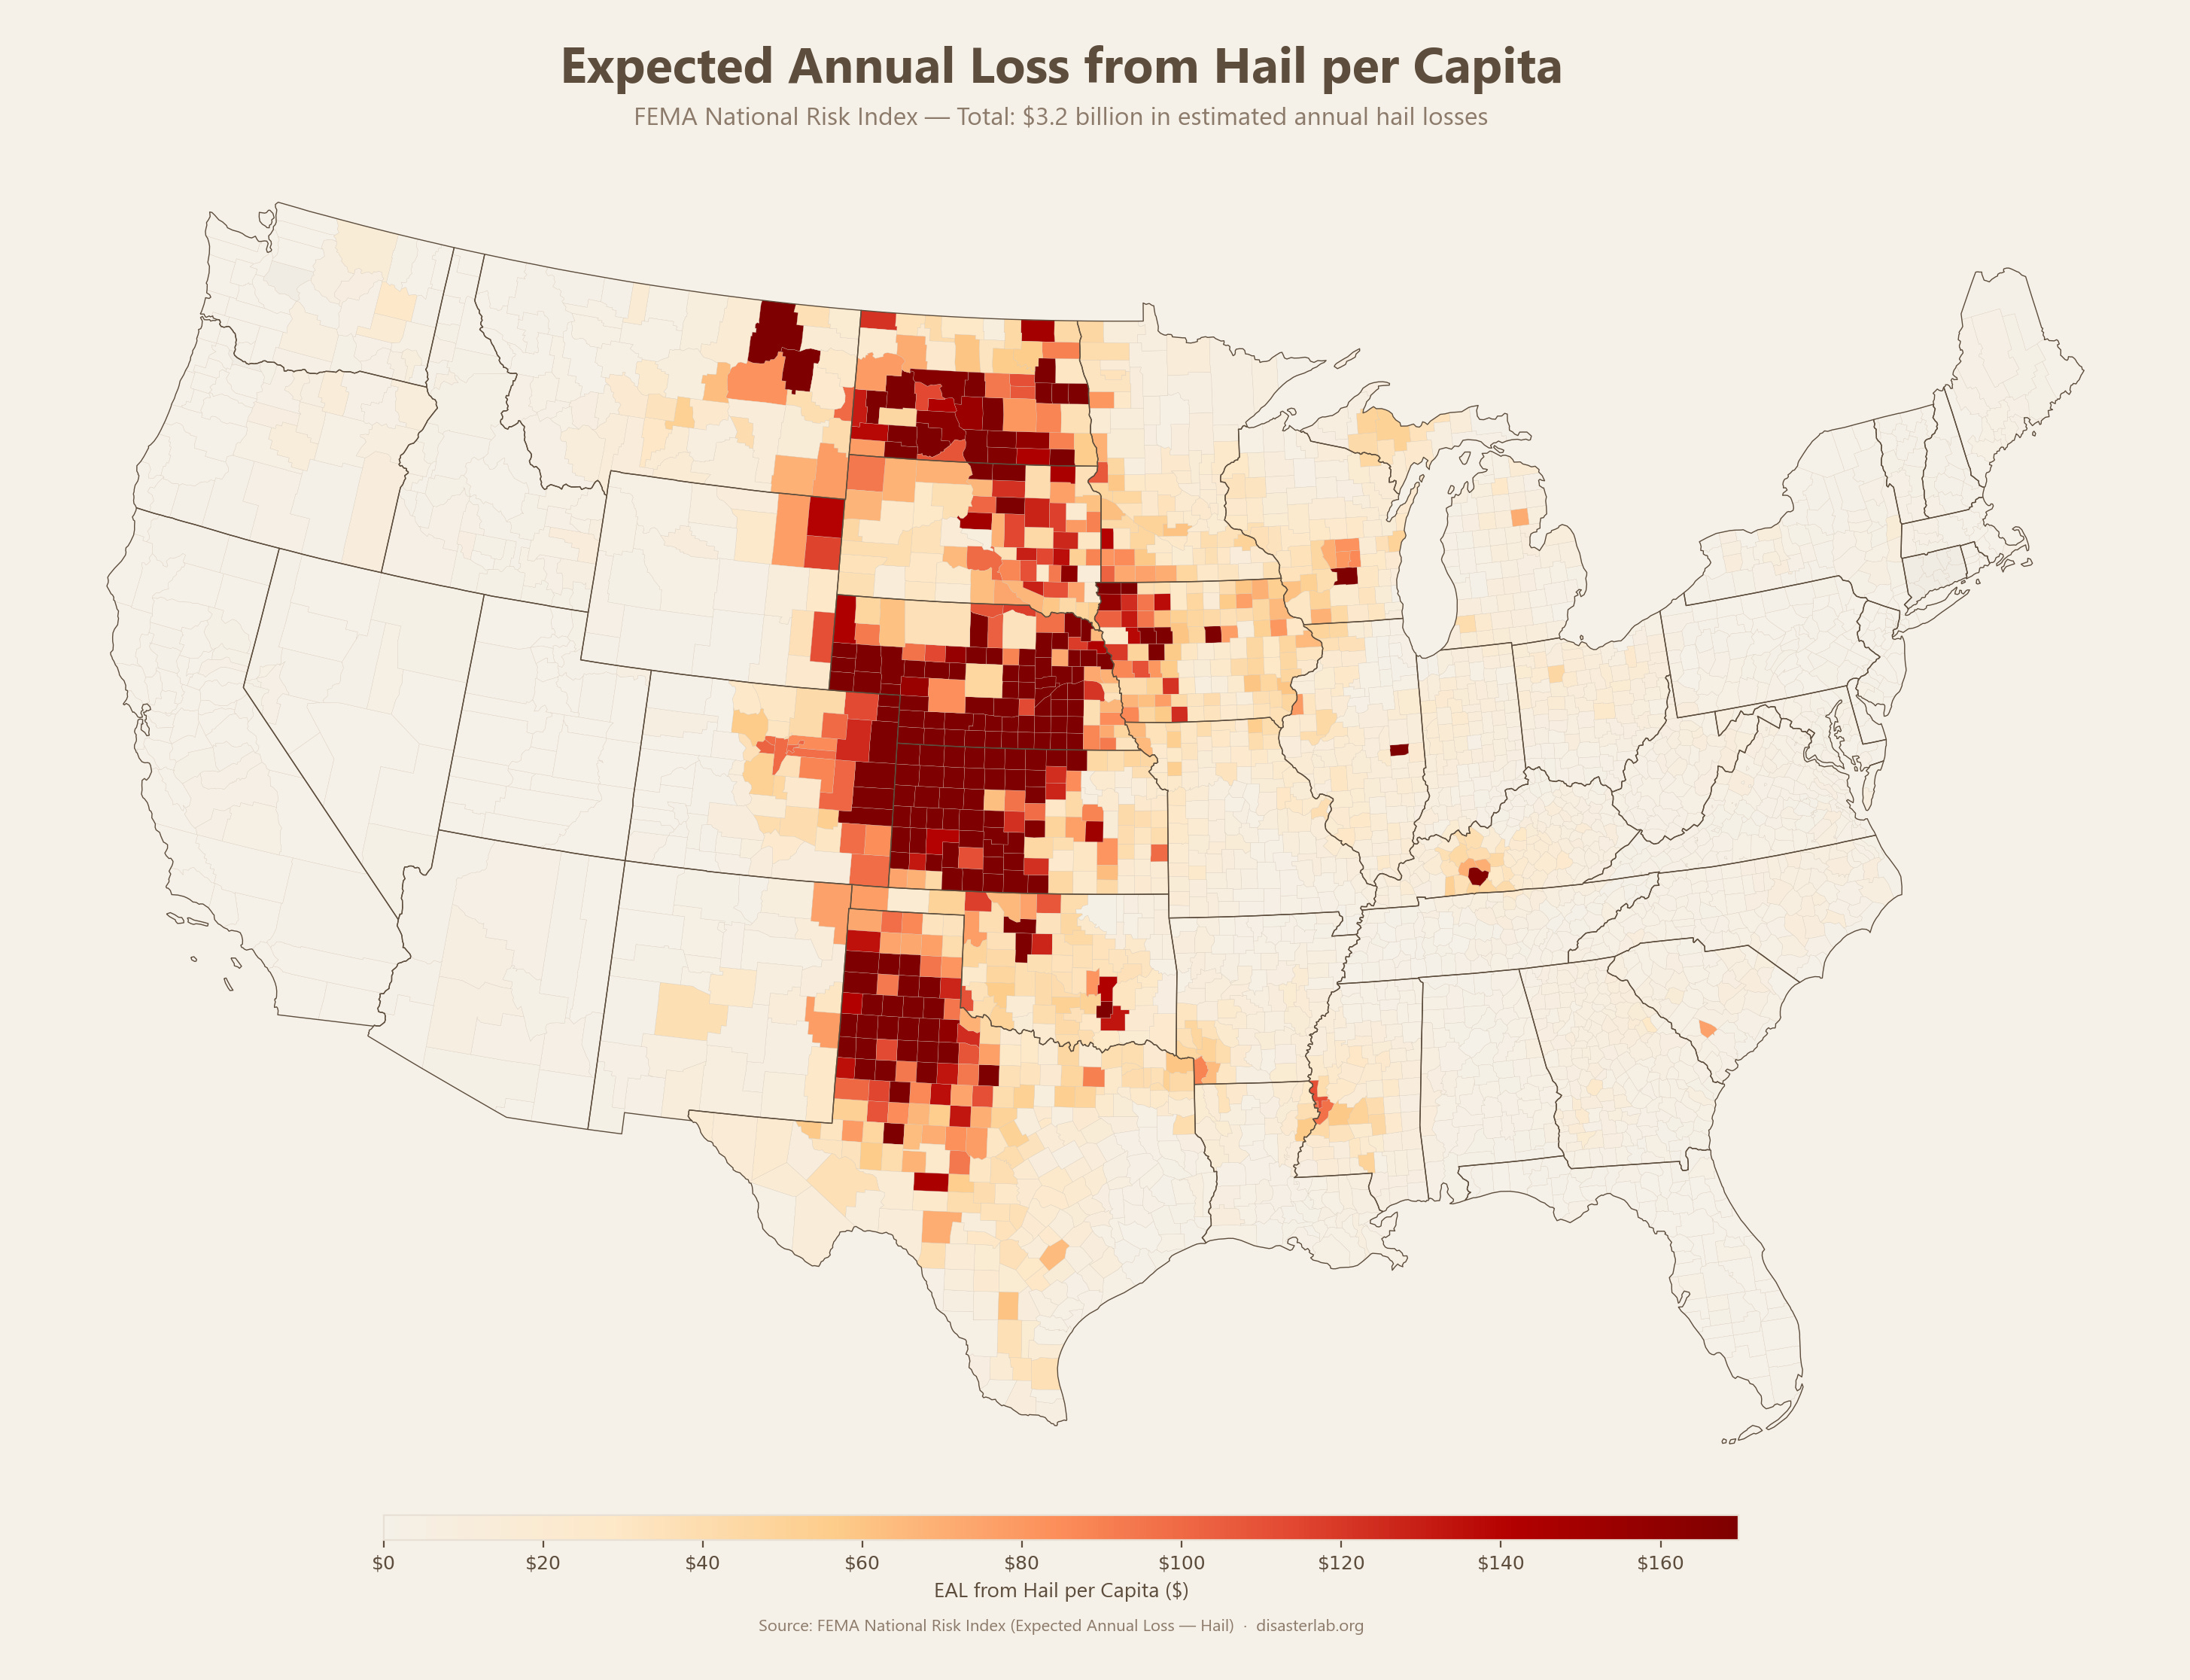
We should probably talk more about hail. Rural places are affected by every type of natural hazard, but some hazards are particularly impactful on rural regions. Hail, for instance, is expected to cost nearly as much in EAL ($3.2 billion) as wildfire ($3.9 billion) and is heavily concentrated in ‘hail alley,’ running from the Texas Panhandle through North Dakota.
There is a lot more to say about the geography of EAL in different states and regions, and from different hazards, and how rural places are uniquely challenged. In the next installment I’ll talk about how these issues intersect with common drivers of social vulnerability to disasters, like poverty rates and disability status. For now, though, I’d encourage you to explore the NRI through the RUCC lens.