
Everybody’s good at something. It’s just a case of figuring out what.
Or at least, that’s how it was explained to me growing up. Granted, those explanations often came from coaches who were cutting me from the team, or concerned teachers whispering to my parents, or over the shoulder of horrified potential prom dates as they sprinted away from me. But the lesson stuck.
And it turns out it applies to the NHL. Even in a league with 32 teams that range from model franchises to … um, not that, everyone is good at something. In fact, every team in the league is the very best at something. You just have to be willing to dig deep enough to find it.
Digging deep is kind of my whole schtick. So today, let’s go through each team and find at least one positive stat in which they led the entire league during the 2025-26 season.
Your team is the best … in this one extremely specific thing.
(All stats are from the NHL, Hockey-Reference and MoneyPuck, unless otherwise noted.)
Anaheim Ducks
Led the league in: Shootout record (8-0)
They weren’t the most impressive shootout team of the year; that would be the Utah Mammoth, who didn’t have any. But of the teams that did soil their season with a shootout, the Ducks were the only one to never take a loss. And they didn’t sneak in with a win or two — at 8-0, they had more shootouts than half the teams in the league.
Boston Bruins
Led the league in: 100+ mph shots by forwards (two)
Thanks to the NHL’s new-ish EDGE stats, we know that there were only three shots of 100+ mph taken by a forward in the entire league this year. One was by New York’s J.T. Miller in January, while the other two were by Morgan Geekie. That includes one that clocked in at 103.3 mph, the hardest shot in the league by any player this season. I’m going to go ahead and assume it was this one.
Buffalo Sabres
Led the league in: Shooting percentage at four-on-five (19.5 percent)
The story here isn’t just that the Sabres led the league in this admittedly weird category, but in just how effective they were. The Sabres’ shooting percentage when down four-on-five was not only better than every team’s number at five-on-five, but also somehow better than every team’s number at five-on-four except for Dallas. The next-best team at four-on-five was Vegas, which was way back at 13.6 percent, and four teams in the league came in under 5 percent. Maybe more impressive: The Sabres did all this without leading the league in four-on-five goals this year (that was Calgary).
Calgary Flames
Led the league in: Percentage of unblocked shots at five-on-five that missed the net (32.61 percent)
To be clear, this was the best mark in the league, which is to say it was the lowest. In related news, NHL teams miss the net a lot more than you might think.
Carolina Hurricanes
Led the league in: Winning percentage when trailing first (.515)
The Hurricanes gave up the first goal in 33 games, one off the league lead for the fewest such games. But they went 17-12-4 in those games, making them the only team in the league to win more than they lost when they trailed first. Perhaps relatedly, they also finished first in winning percentage in one-goal games.
Chicago Blackhawks
Led the league in: Penalty kill rate in wins (96.9 percent)
The penalty kill was a strength in Chicago, where they finished second overall with an 83.6 percent kill rate. This isn’t a piece about teams being second-best, though, so we’ll dig deeper. And when we do, we find that the Blackhawks were almost unbeatable when short-handed in games they ended up winning. Their mark of 96.9 percent wasn’t just the best; it made them the only team that came in over 90 percent. And even more impressive, they actually scored more short-handed goals (four) in wins than power-play goals given up (three).
Colorado Avalanche
Led the league in: Fewest goals allowed in any period (59 in the third)
As you’d expect, the Avalanche led the league in plenty of things, including relatively obscure stats such as wins, goals for, goals against, points and penalty killing. But far more importantly, the 59 goals they allowed in the third were the fewest in the league in any 20-minute period. Tied for second: The 61 goals allowed in the first period by … the Avalanche. Yeah, these guys might be good.
Columbus Blue Jackets
Led the league in: Five-on-three penalty-killing (100 percent)
The Blue Jackets made for fertile ground in this exercise, also leading the league in four-on-four goals as well as shootout goals. But you can’t argue with perfection, and the Blue Jackets were the only team to never allow a goal while down five-on-three. And it wasn’t for lack of opportunity; they faced the situation seven times, which was right around the middle of the pack.
Dallas Stars
Led the league in: Wins when trailing after two periods (eight)
In today’s NHL, trailing after two periods often means it’s game over. But the Stars managed to pull off the comeback with regularity, eight times in 22 opportunities for a win percentage of .308, which also led the league.
Detroit Red Wings
Led the league in: Least injured team by CHIP ($4.55 million)
This is the specialty stat that measures injury impact by Cap Hit of Injured Players, as measured on this site. The Red Wings finished dead last, which is to say they finished first, since injuries are bad and you want to avoid them. Detroit mostly did, finishing almost $1 million behind the next team (Nashville) and miles behind Florida’s league-leading $28.35 million.
Edmonton Oilers
Led the league in: Winning percentage in two-goal games (.769)
The Oilers struggled badly in one-goal games, finishing tied with the Blackhawks for 29th in winning percentage. They were better in three-goal games, ranking 14th. But the sweet spot was two goals — no more, no less. In two-goal games, the Oilers went 10-3, good for a league-best .769 winning percentage.
Florida Panthers
Led the league in: Power-play opportunities (266)
Huh. And here I thought the Panthers were dirty. But it turns out they’re the victims, because NHL referees give them more power plays than any other team. What an interesting observation.
Los Angeles Kings
Led the league in: Long-range shots by forwards (203)
I’m a big believer in degree of difficulty, so I decided that for the Kings’ entry, I wouldn’t use anything that had to do with going to overtime. This is what I wound up with. I probably should have just done an overtime stat.
Minnesota Wild
Led the league in: Goals differential at four-on-three (+5)
We can argue about whether this year’s Wild were a great team or merely a good one, but at four-on-three, nobody could touch them. Not only did they score a lead-leading five goals, but they were also one of eight teams not to give up any.
Montreal Canadiens
Led the league in: Shooting percentage on slap shots (15.3 percent)
The slap shot is a dying art these days. Just apparently not in Montreal, where the Habs buried them at a significantly higher rate than the next-best team; the Rangers (13.8 percent) and Hurricanes (12.1 percent) were the only other teams north of 11 percent. As a bonus, Montreal also topped the league in wrist shot percentage, at 13.1 percent.
Nashville Predators
Led the league in: Wraparound goals during overtime losses on the road (one)
I’m going to be honest, it’s a lot harder than I thought to find one of these for every team.
New Jersey Devils
Led the league in: Games where both teams had equal shots (six)
Shot stats are weird in the NHL, where score effects mean teams with fewer shots often win at a higher rate than teams that have more. Then there are the games where both teams register the exact same shot total. The Devils had more of those than anyone else, with six. They won three and lost three, in case you’re wondering.
New York Islanders
Led the league in: One-goal wins on the road (14)
Nothing makes a coach happier than seeing his team win a close game on the road. And that’s apparently especially true if your coach is a former goalie such as Patrick Roy, who saw his team do it 14 times. Pete DeBoer could never. (No, really, couldn’t — the Islanders didn’t play any road games with him as coach.)
New York Rangers
Led the league in: Percentage of hits made (56.73 percent)
Honestly, we could go with just about any hits-based stat for the Rangers. When you pride yourself on being an old-school, bruising team that’s hard to play against, you’re going to get a lot of hits. When you’re bad and never have the puck, you’ll get even more. Hey, at least they gave (way) more than they got.
Ottawa Senators
Led the league in: Fewest empty-net goals allowed (nine)
The Senators’ big problem through most of the season was that their goaltenders gave up too many goals, which was true no matter who was in net. But when there was nobody in net, the Senators became the hardest team in the league to score against. Does that mean they should have played the entire Hurricanes series at six-on-five? Look, the numbers don’t lie.
Philadelphia Flyers
Led the league in: Least amount of time spent down five-on-three (1:44)
We can chalk up the Flyers’ performance here to two main factors. First, they were disciplined enough to only go down five-on-three twice all year. And second, they gave up a goal both times. In other words, being down five-on-three is a fight they don’t want to start, but are more than willing to finish (by getting scored on).
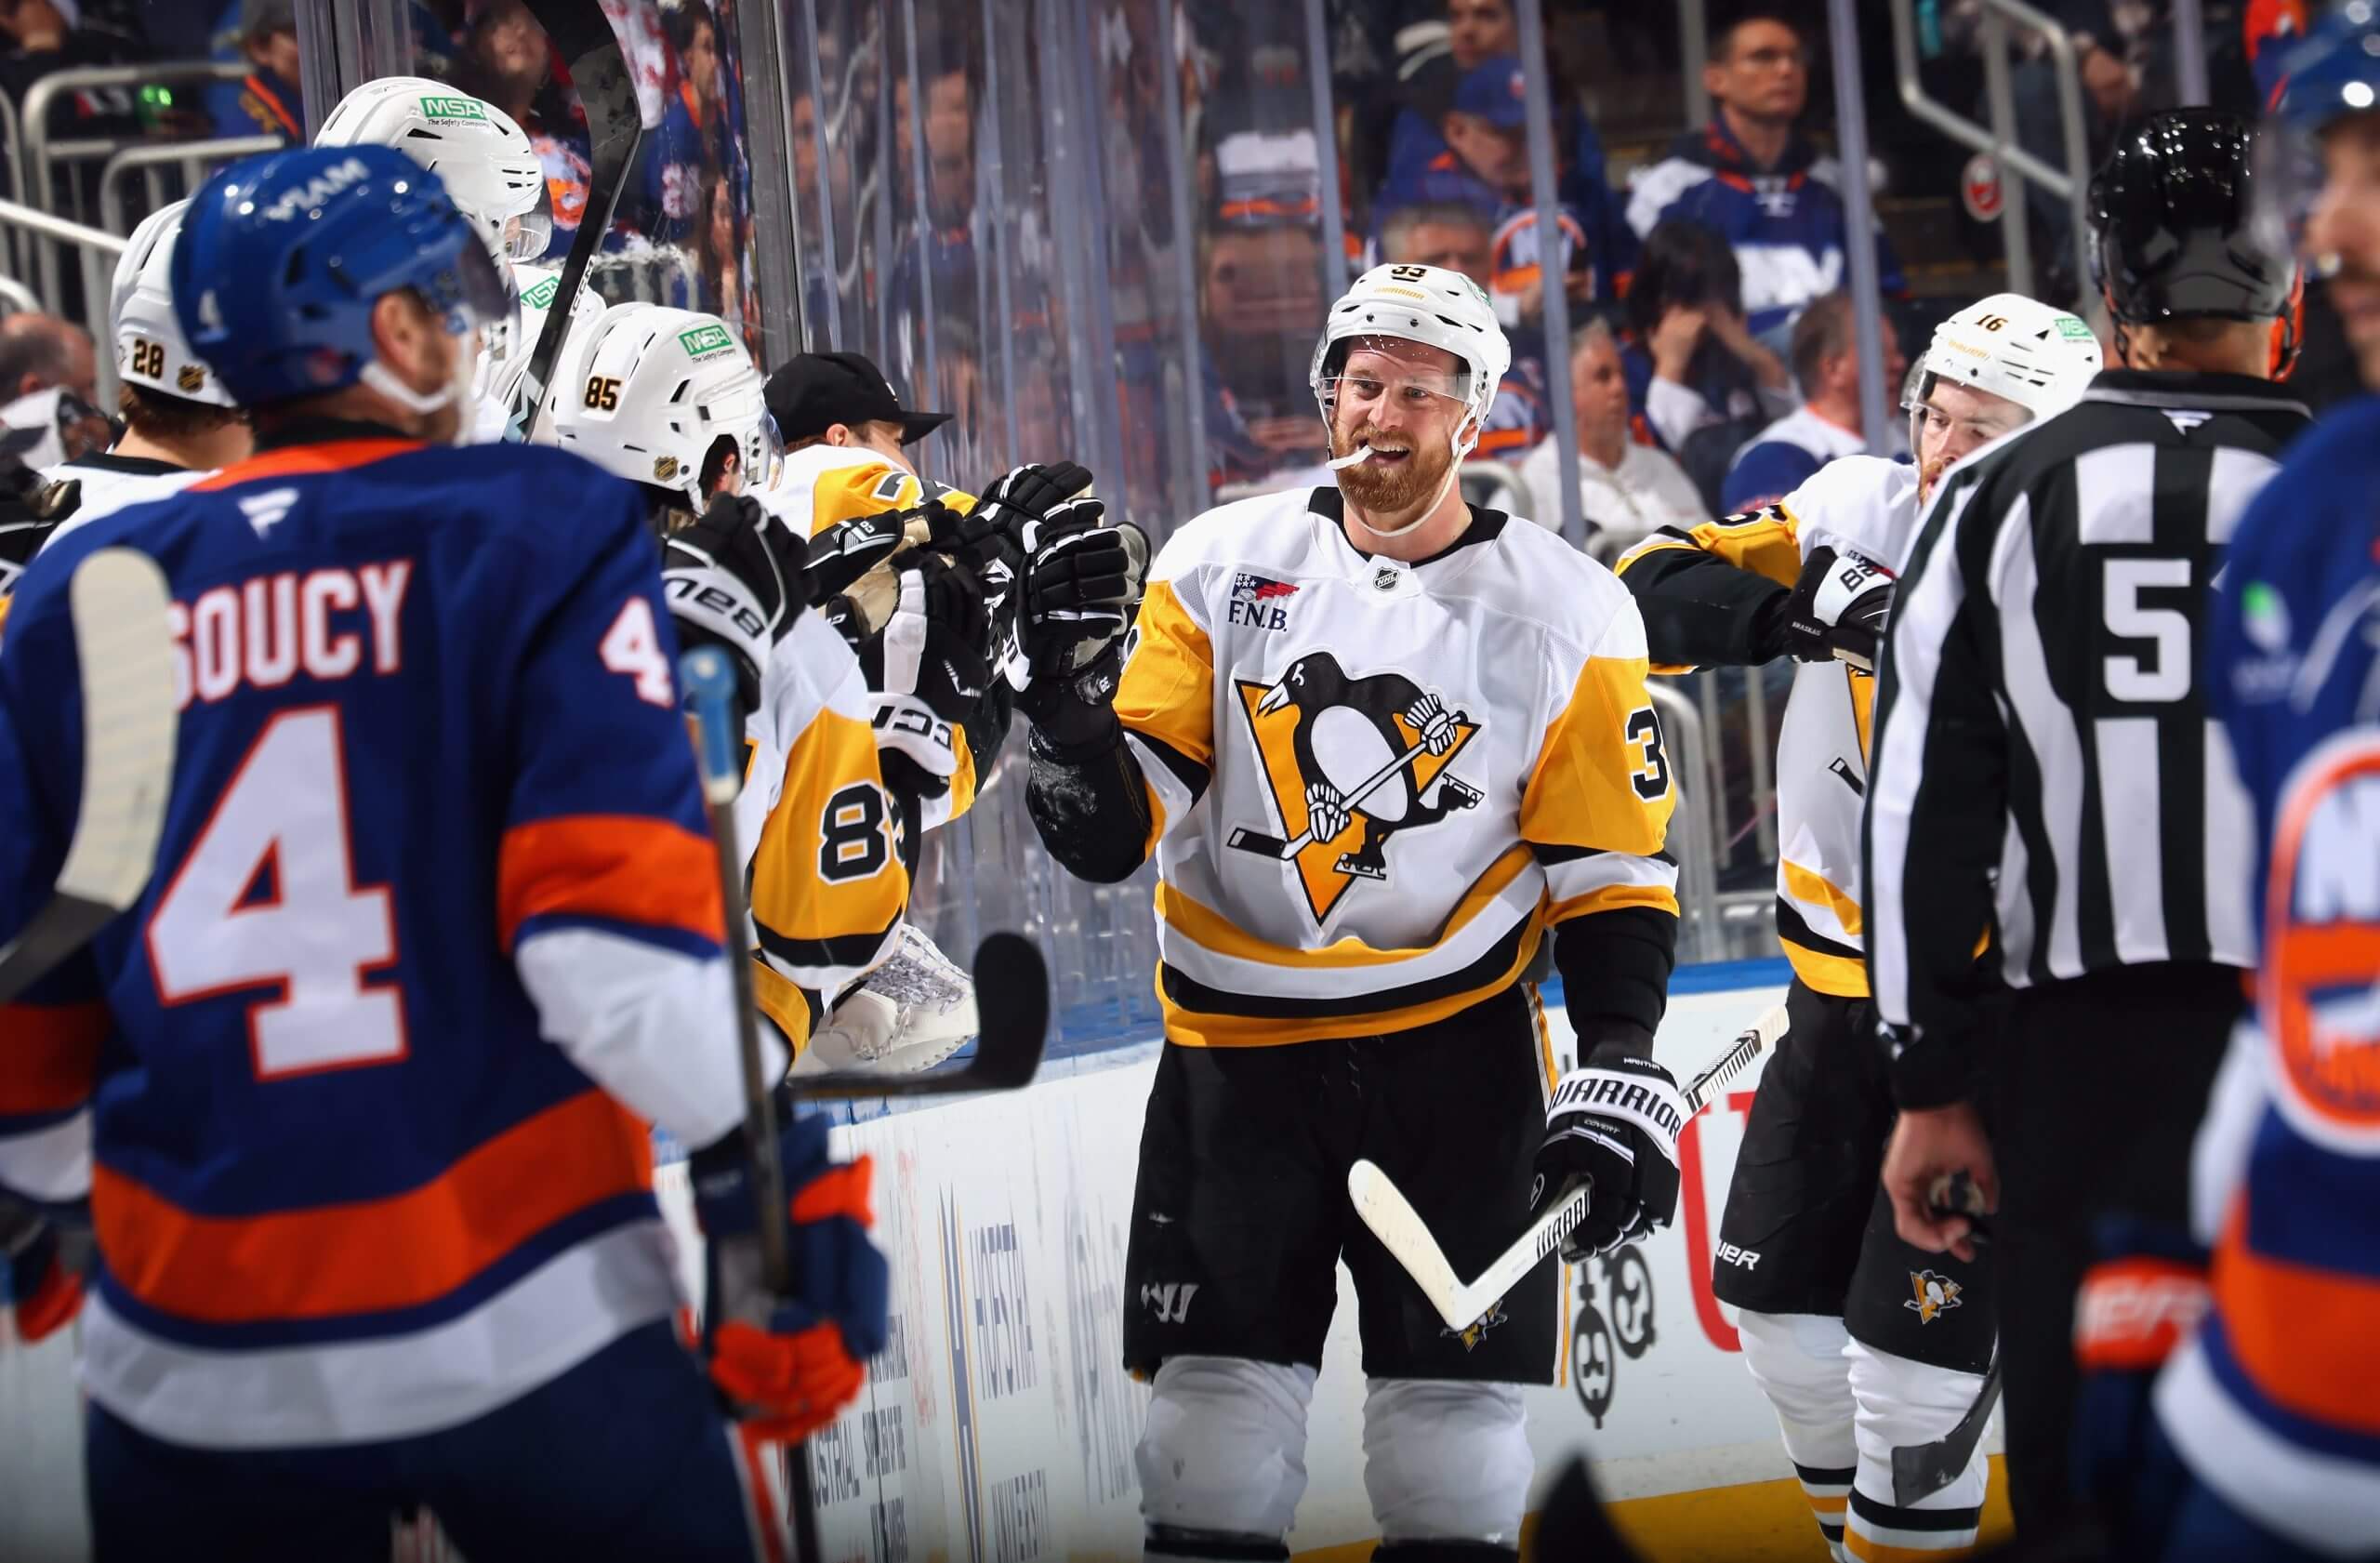
Anthony Mantha led the Penguins with seven backhand goals. (Bruce Bennett / Getty Images)
Pittsburgh Penguins
Led the league in: Backhand goals scored (32)
It was close, with the Stars right behind at 31 and three other teams at 30, but the Penguins pulled it off. Led by Anthony Mantha’s seven, the Penguins were the best of the best. Consider that a backhanded compliment.
San Jose Sharks
Led the league in: Fewest hits taken (1,469)
You can’t hit what you can’t catch. And nobody got hit less this season than the Sharks, who edged out the Blues, Leafs and Blue Jackets for that honor. As that list would indicate, a low hit total can sometimes mean a team never has the puck. In the Sharks’ case, it presumably meant that nobody wanted to risk angering Macklin Celebrini.
Seattle Kraken
Led the league in: Shutouts recorded in a loss (1)
It’s not easy to post a shutout in a losing effort. But also not impossible, thanks to the odd way the league records scoreless games that go to a shootout. In those cases, both teams get credit for a shutout, with the shootout winner counting as a goal for on the standings page but not in the goaltending stats. Does that make sense? It does not. But thankfully, this season featured only one of those dreaded 1-0 shootout decisions, and it came in this Nov. 23 barnburner between the Kraken and Islanders. Congratulations on the shutout, Joey Daccord, you loser.
St. Louis Blues
Led the league in: Home shutouts (5)
Yeah, they wouldn’t have been my pick either, but here we are. Despite Jordan Binnington and Joel Hofer struggling badly through much of the season, the Blues managed to post five shutouts on home ice — one more than the Kings, Islanders, Wild and Avalanche each managed.
Tampa Bay Lightning
Led the league in: Penalties drawn per 60 (4.97)
The Lightning are no strangers to the penalty box — they led the league in penalties, and in minors, and also majors, and also misconducts, and also game misconducts. Luckily for them, their opponents also took a ton of penalties, averaging nearly five per game. The Panthers were next on the list at 4.48 opponent penalties/60, in case you were wondering, with nobody else in the league being above 4.17.
Toronto Maple Leafs
Led the league in: Neutral-zone faceoff percentage (56.2 percent)
And the negative Toronto media acted as if nothing went well this season. The Leafs were more than a full percentage point better than the next-best team, the Rangers, and they were further ahead of third-place St. Louis than the Blues were ahead of 22nd. That’s called domination. Full credit to Craig Berube, who made sure to play to his team’s strengths with a defensive system that constantly resulted in faceoffs at center ice.
Utah Mammoth
Led the league in: Shots blocked while on a five-on-four (15)
You know a team is locked in when even its power-play unit is blocking shots. Wait, should your power play be surrendering shot attempts? Look, don’t think too hard about it, just give the Mammoth credit for having one more block than the Habs and Senators at 14 each.
Vancouver Canucks
Led the league in: Shootout save percentage (.871)
This might be one of the wildest stats of the year: The Canucks goalies managed to go a league-best .871 in the shootout, and a league-worst .872 across all other situations.
Kevin Lankinen does most of the heavy lifting here, giving up just one goal on 23 tries for a truly impressive .957, which is just one point back of Jhonas Enroth for the best mark ever by a goalie who faced at least 20 attempts.
Vegas Golden Knights
Led the league in: Goals differential in any period (+47 in the third)
I’m not a big Xs and Os guy, but if I were an NHL coach, I’d probably tell my team to go out there and score more goals than anyone while also giving up fewer than anyone. The Golden Knights came very close in the third period, with a league-leading 108 goals and just 61 against, which trailed only Colorado.
Washington Capitals
Led the league in: Mid-range shooting percentage by defensemen (15.2 percent)
Fun fact: the Capitals were the last team in the league that I could find a stat for. Can you tell? You could probably tell.
Winnipeg Jets
Led the league in: Five-on-three power play conversion rate (100 percent)
We’ll end with an easy one, because when it comes to five-on-three efficiency, no other team came close. The Jets were, quite literally, perfect.
As in, they went one-for-one. Look, it still counts.
The Jets’ only opportunity of the season came on Jan. 15 in Minnesota, and it was Jonathan Toews who converted. The goal got slightly more attention for being his 900th career point, but it also turned out to be the entirety of the 2025-26 Jets’ five-on-three experience. And it was perfection.