
Filter by article type:
In-brief analysis
In-depth analysis
In-brief analysis
May 11, 2026
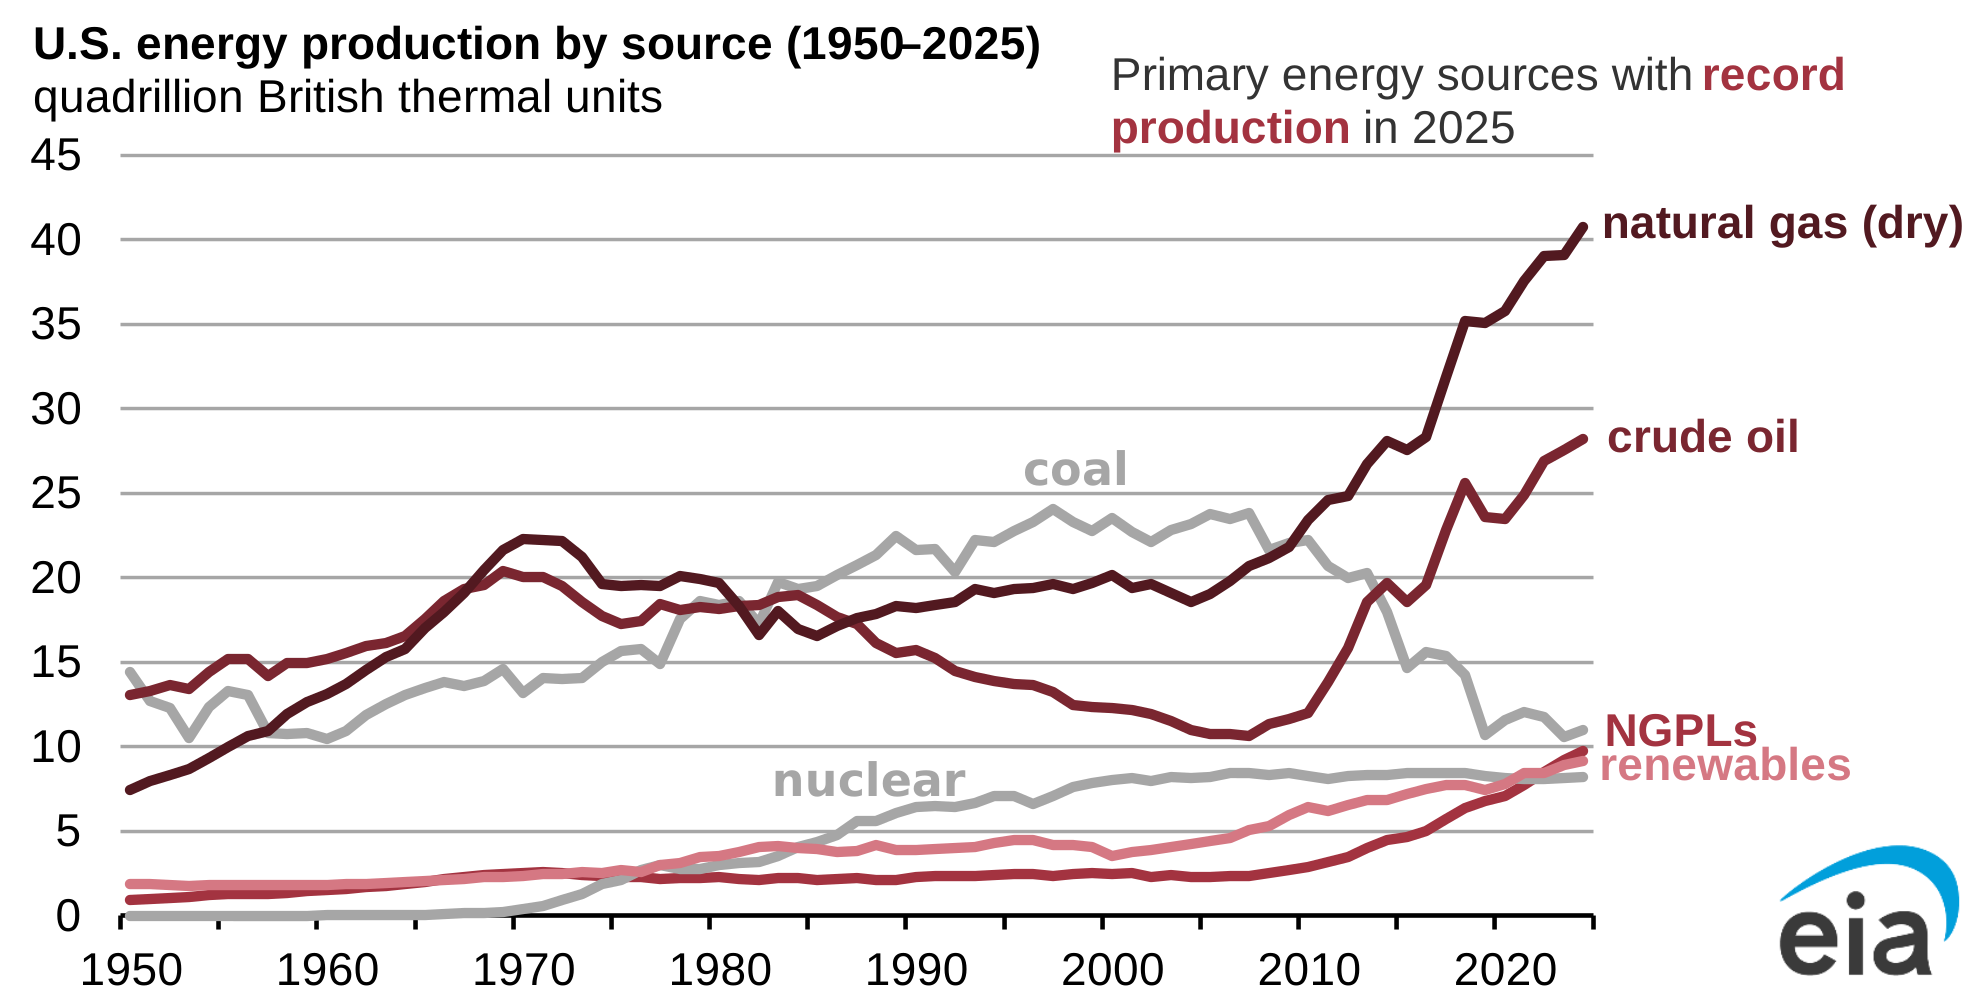
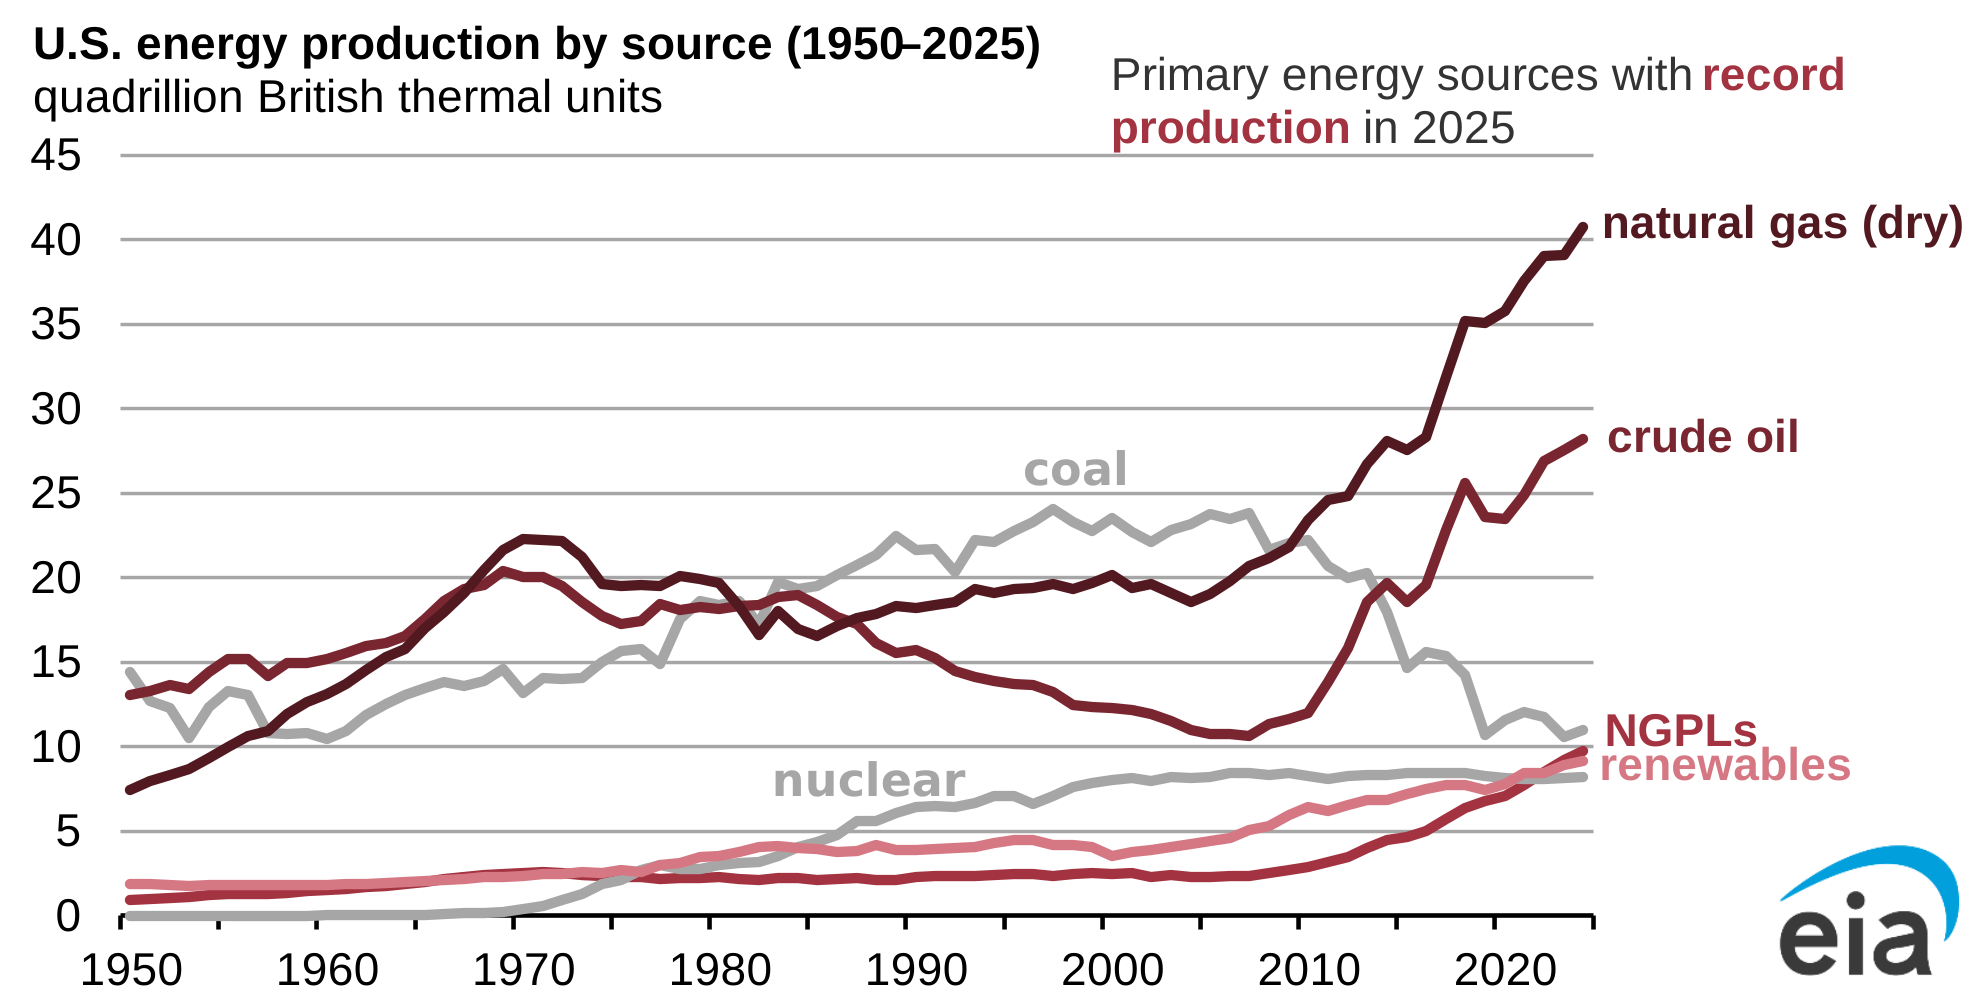
Total energy production in the United States increased to a new record of 107 quadrillion British thermal units (quads) in 2025, a 3.4% increase from the previous record set in 2024, according to new data in our Monthly Energy Review. Total production was driven by record-high production in natural gas, crude oil, natural gas plant liquids (NGPLs), and renewables. This was the fourth consecutive year in which the United States set a record for total energy production.
In-brief analysis
May 7, 2026
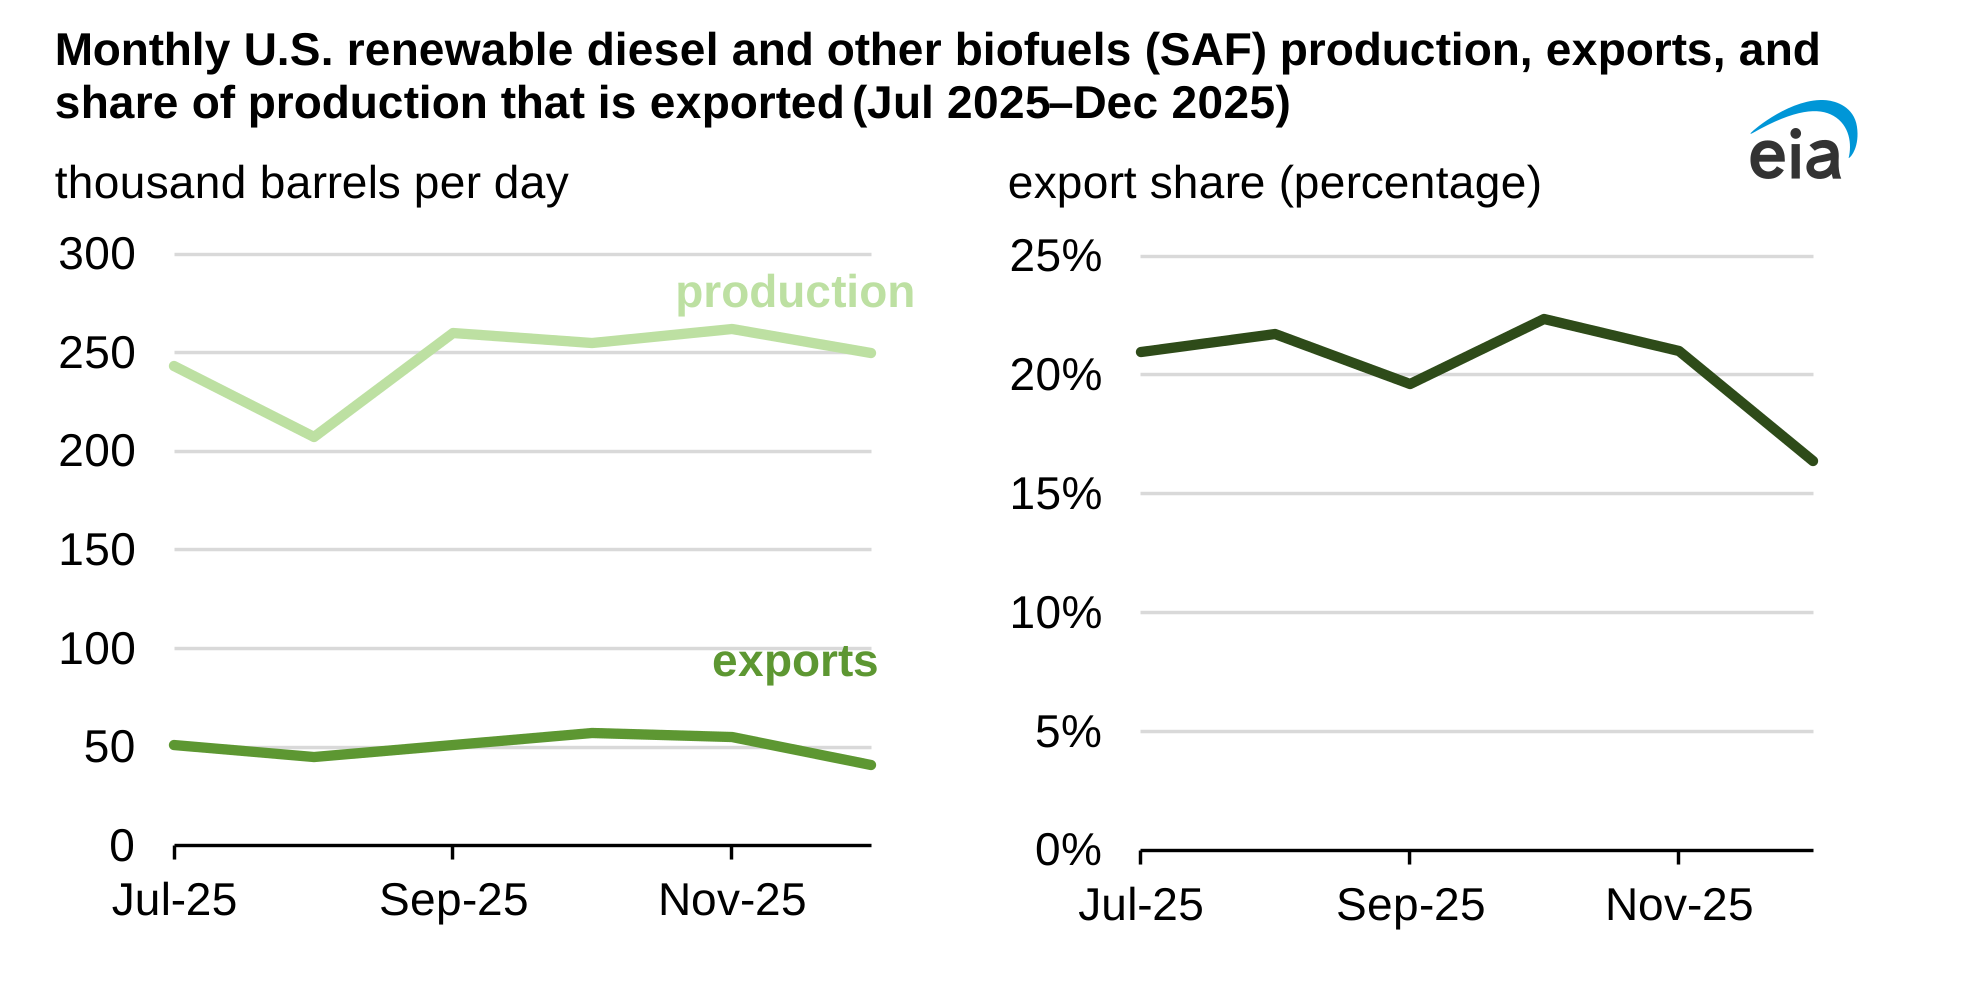
The United States exported nearly 50,000 barrels per day (b/d) of renewable diesel and other biofuels—a category which includes sustainable aviation fuel (SAF)—in the second half of 2025 (2H25), about 20% of the combined production for those fuels. About half of these exports went to Canada, with the rest mostly going to Europe.
In-brief analysis
May 5, 2026
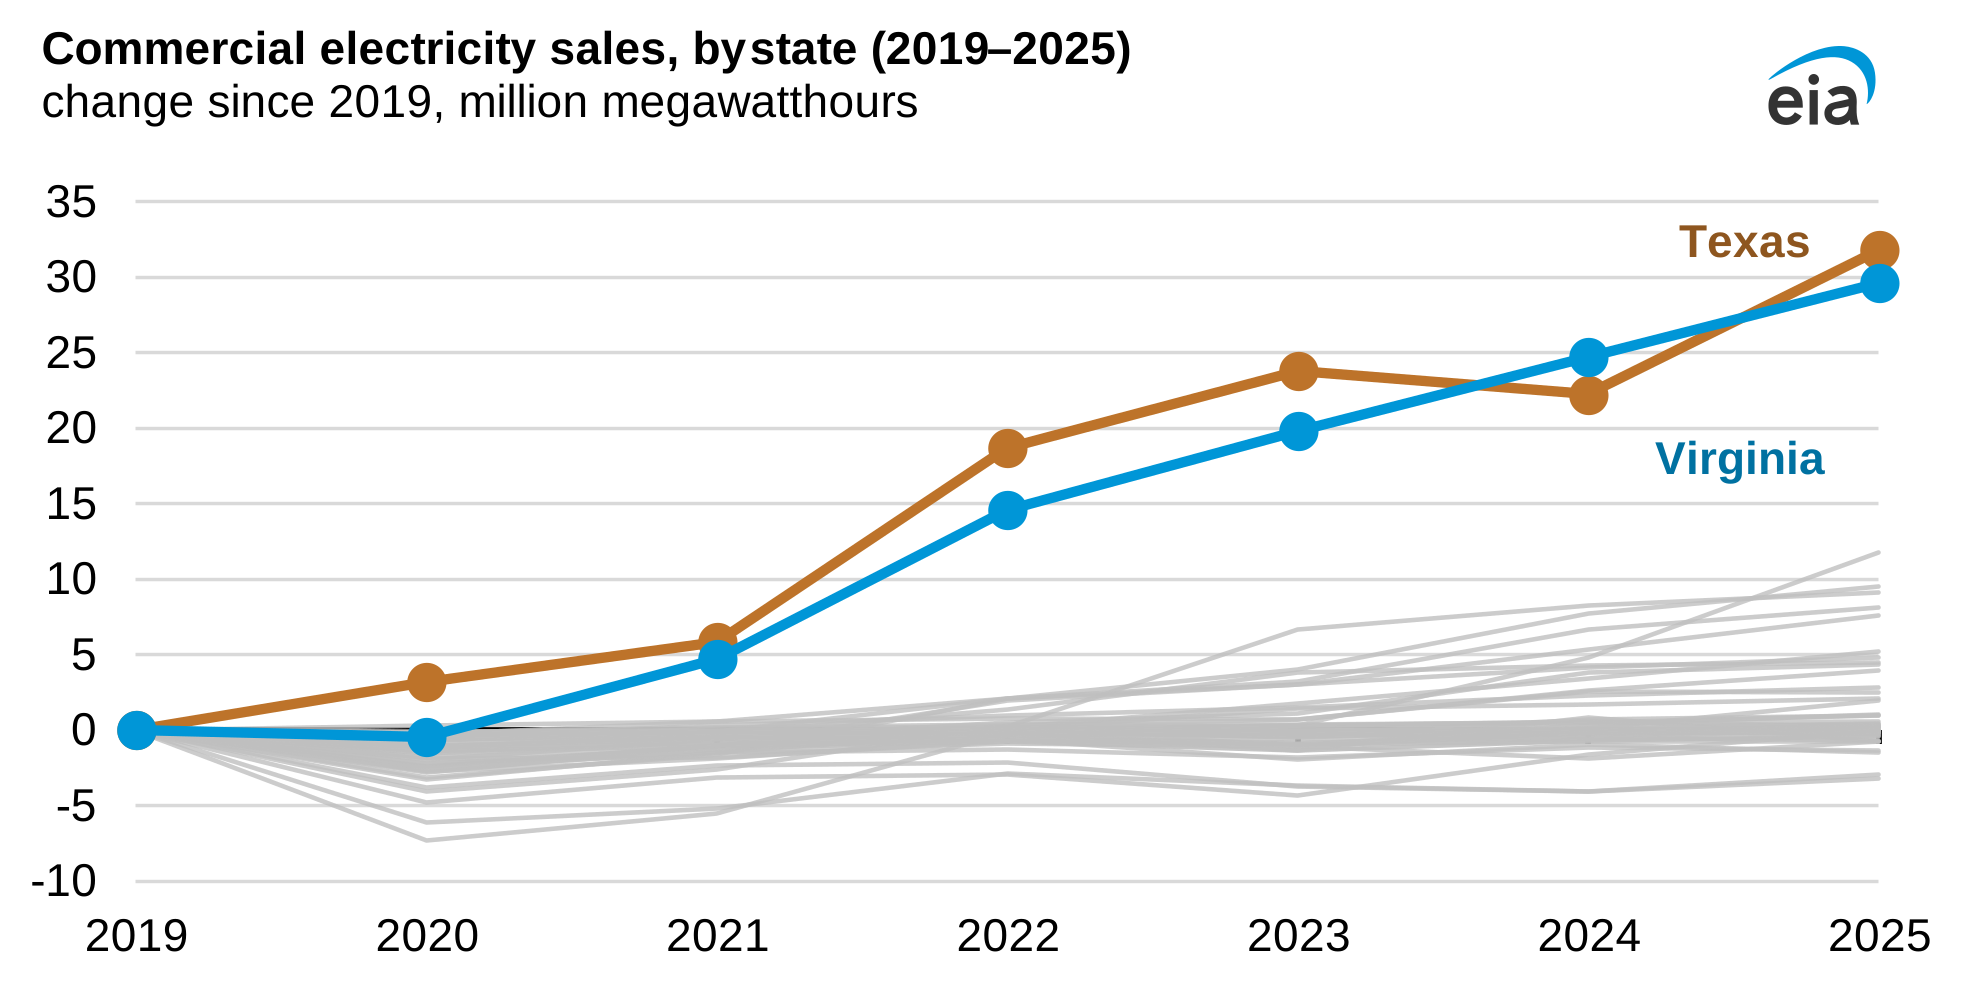
Data source: U.S. Energy Information Administration, EIA-861, Annual Electric Power Industry Report, October 2025, final data for 2019–24, and EIA-861M (formerly EIA-826), Monthly Electric Power Industry Report, February 2026, preliminary data for 2025
Commercial electricity sales in Virginia increased by nearly 30.0 million megawatthours (MWh) between 2019 and 2025, much faster growth than in any other state except Texas, a much larger state, according to our Annual Electric Power Industry Report. The growth in sales of electricity in Virginia is largely driven by a concentration of data centers, as well as electric vehicle adoption and building electrification.
In-brief analysis
May 4, 2026
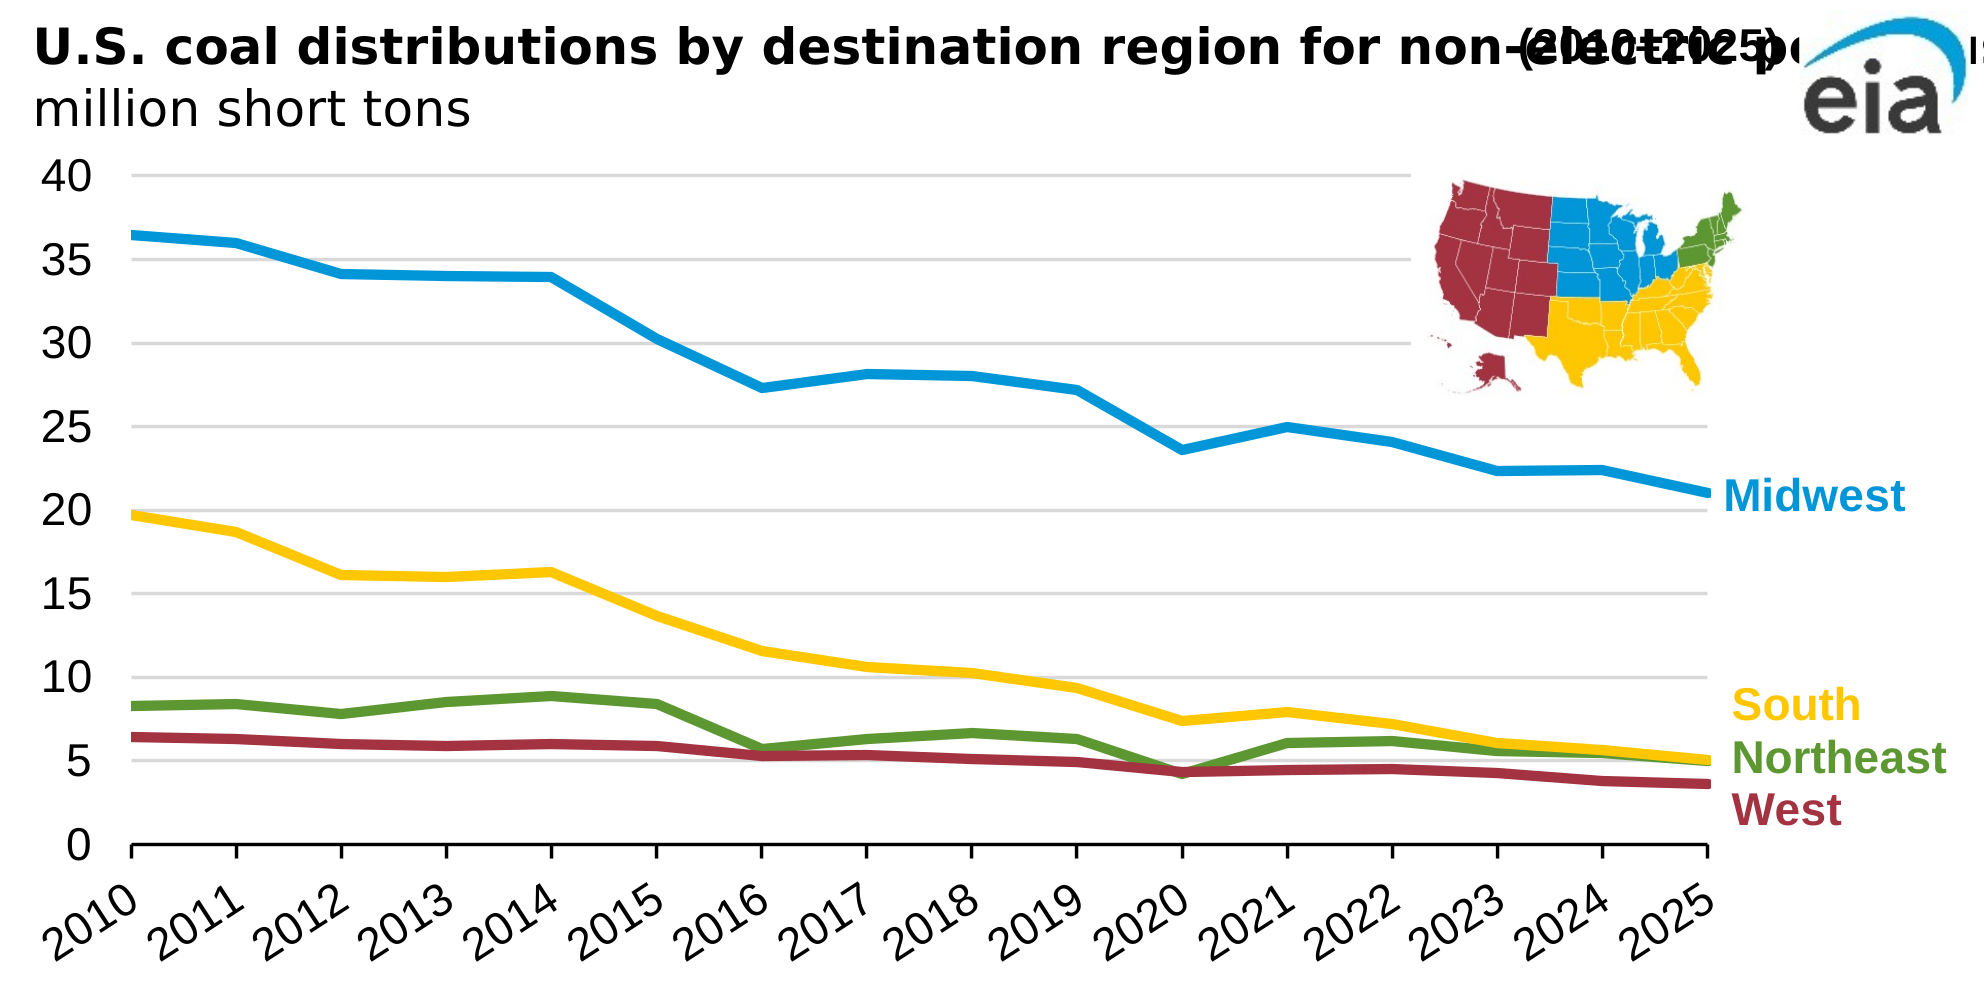
Data source: U.S. Energy Information Administration, Annual Coal Distribution Report and Quarterly Coal Distribution Report
Note: The 2025 data points are annualized using the four quarters of preliminary 2025 data from the Quarterly Coal Distribution Report. The Annual Coal Distribution Report provides detailed information about domestic coal distribution by, coal-origin state coal-destination state, consumer category, and method of transportation. It also summarizes foreign coal distribution by coal-producing state.
The volume of coal delivered in the United States for uses other than power generation—primarily, for manufacturing—decreased by about half in the last 15 years. Coal delivered for these purposes in the South decreased the most in percentage terms between 2010 and 2025, falling 75%, or 14.7 million short tons (MMst), according to our Annual Coal Distribution Report and Quarterly Coal Distribution Report. In 2010, the South received more than double the amount of coal received in the Northeast; by 2025 the two regions received about the same amount. Manufacturers’ increasing use of natural gas instead of coal and the closure of manufacturing plants using coal were major factors in this decline.
In-brief analysis
Apr 30, 2026
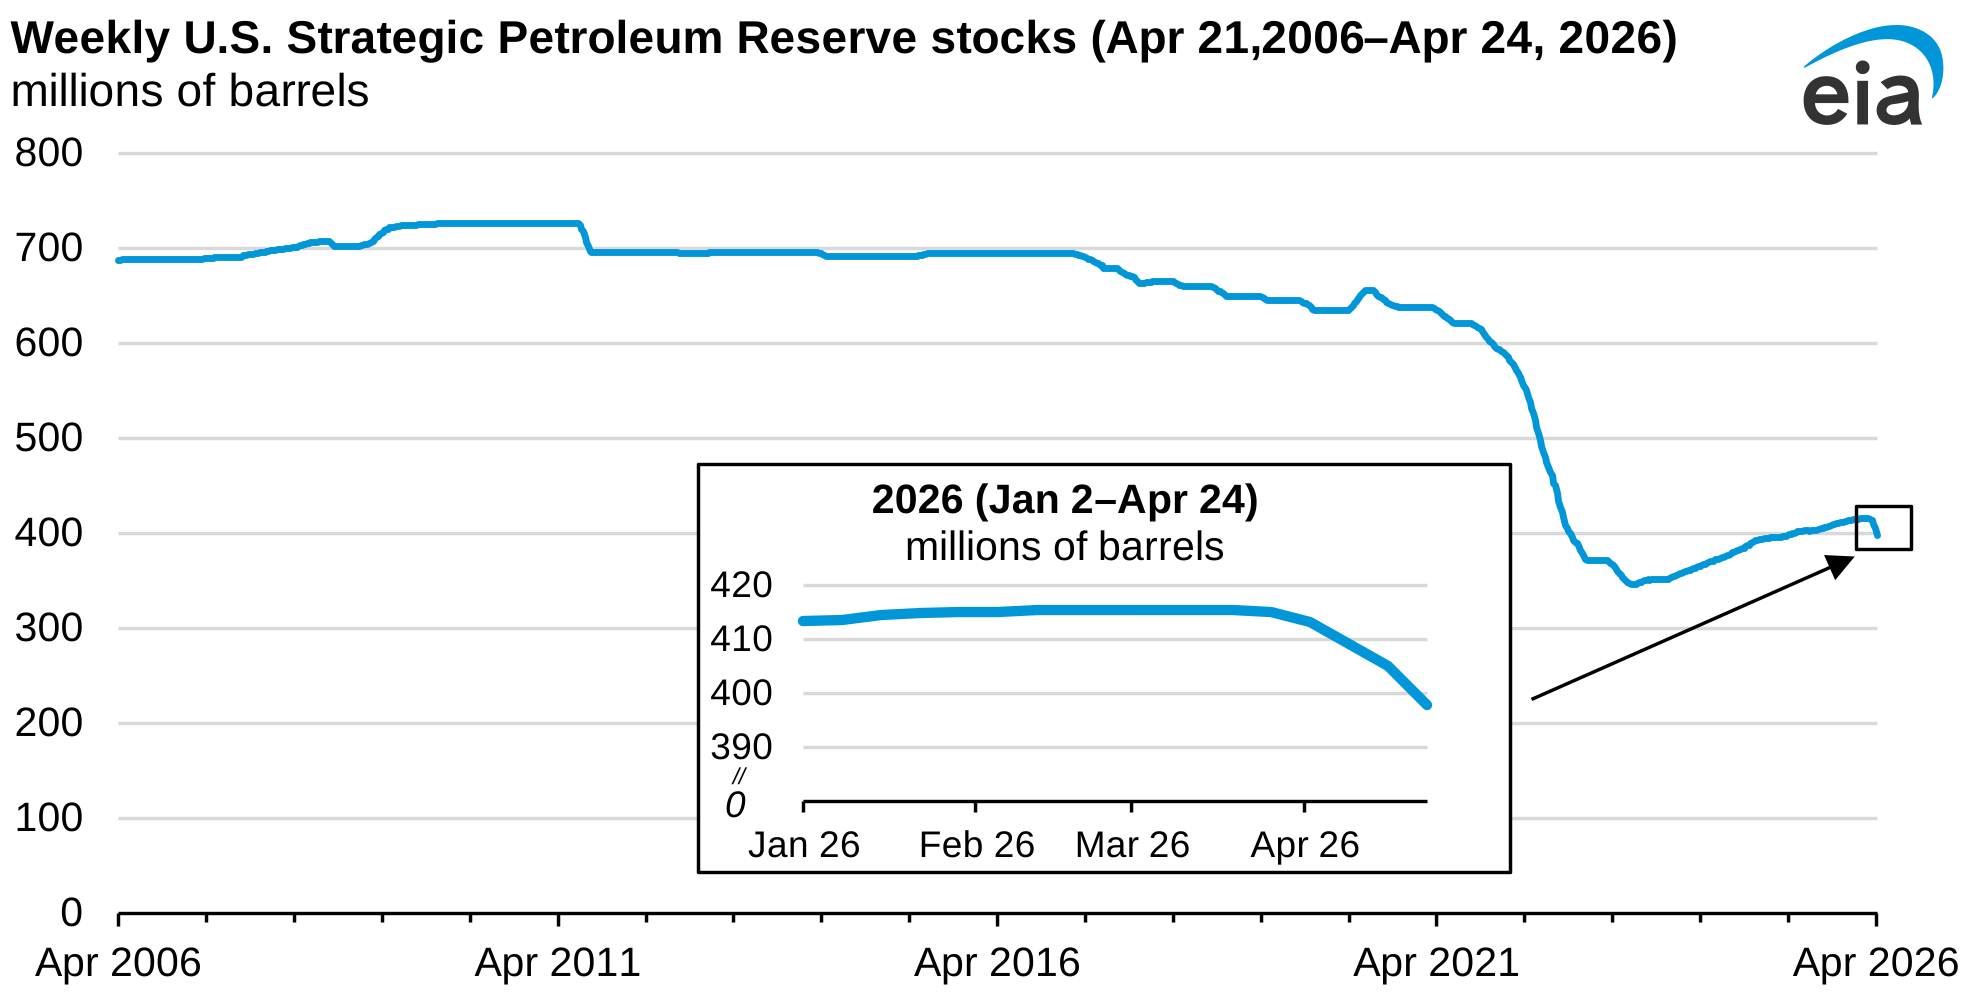
Between the week ending March 20 and the week ending April 24, the U.S. Department of Energy (DOE) released a total of 17.5 million barrels of crude oil from the U.S. Strategic Petroleum Reserve (SPR), according to data in our Weekly Petroleum Status Report. DOE released 7.1 million barrels in the week ending April 24, the most released since the week ending October 7, 2022. SPR stocks are currently 397.9 million barrels.
In-brief analysis
Apr 29, 2026
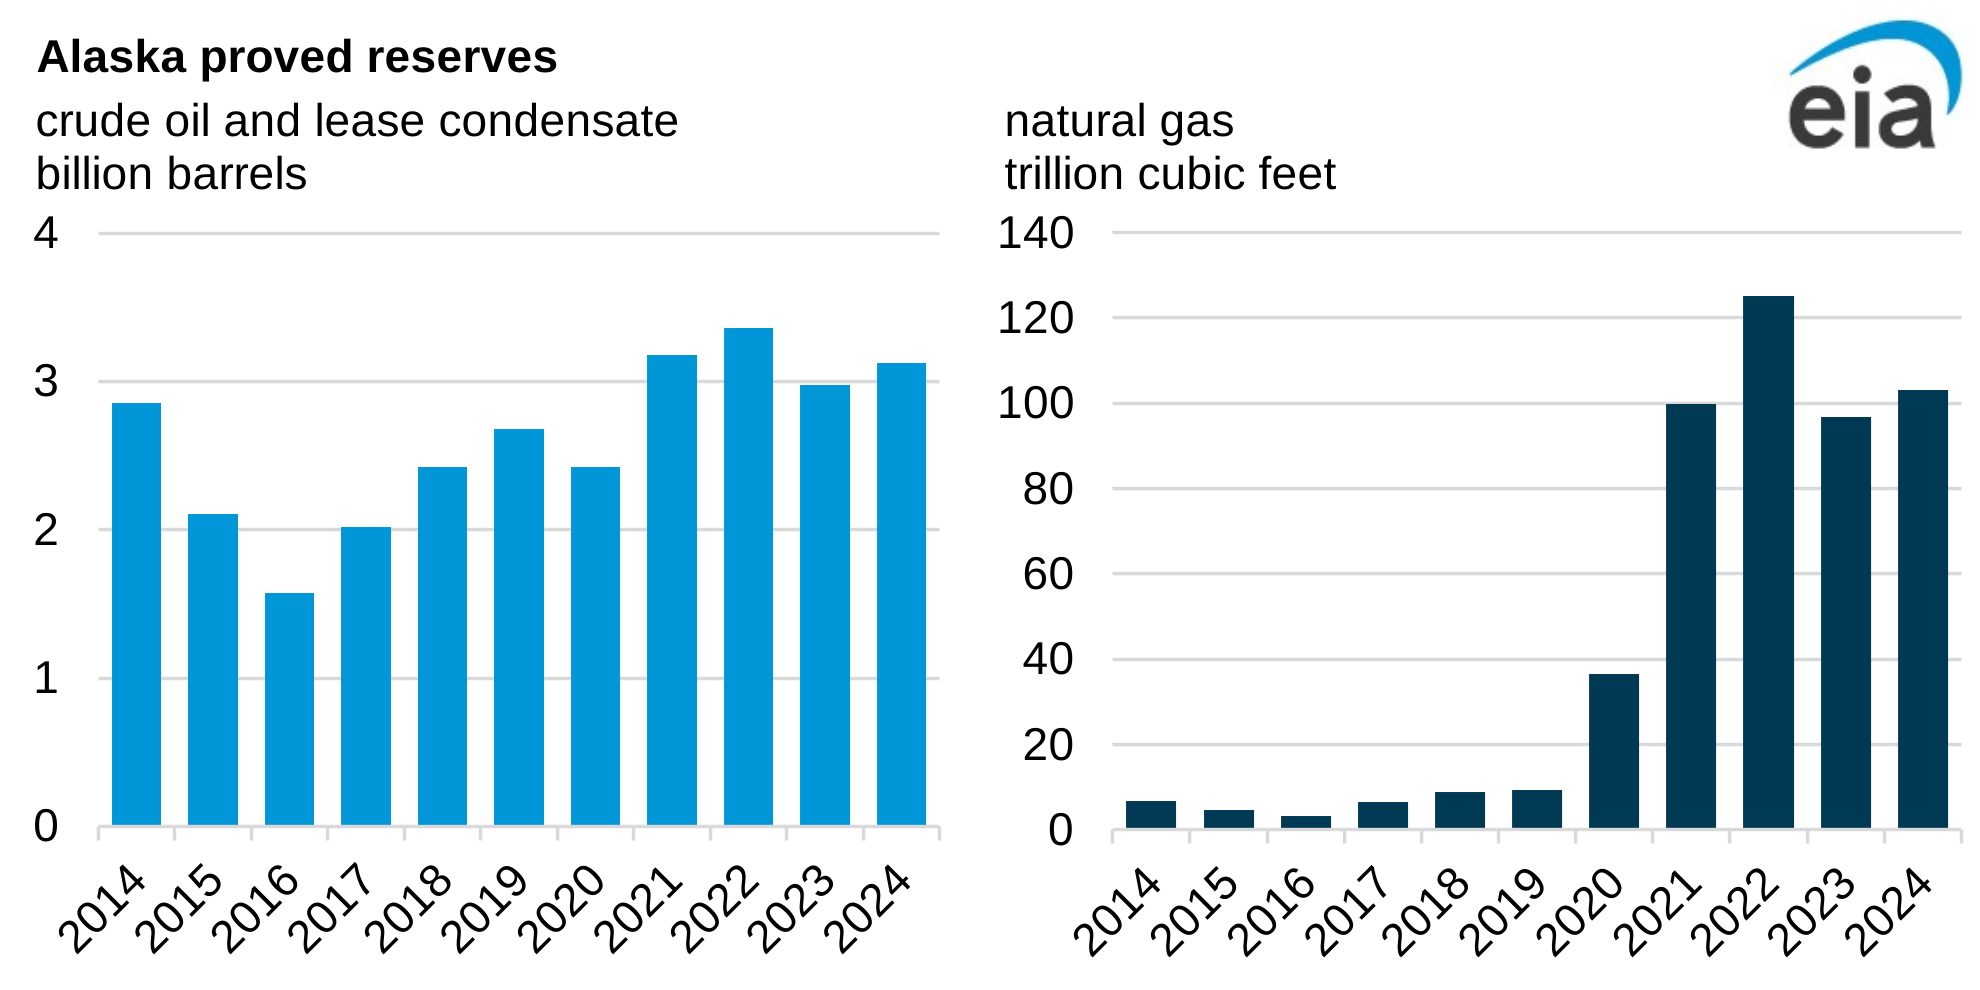
Oil and gas producers operating in Alaska reported increases in proved reserves in 2024 at a time when low prices triggered a decrease in nationwide proved reserves, according to our recently released U.S. Crude Oil and Natural Gas Proved Reserves, Year-End 2024 report. Alaska’s crude oil and lease condensate proved reserves increased 5%, and natural gas proved reserves increased nearly 7% in 2024.
In-brief analysis
Apr 28, 2026
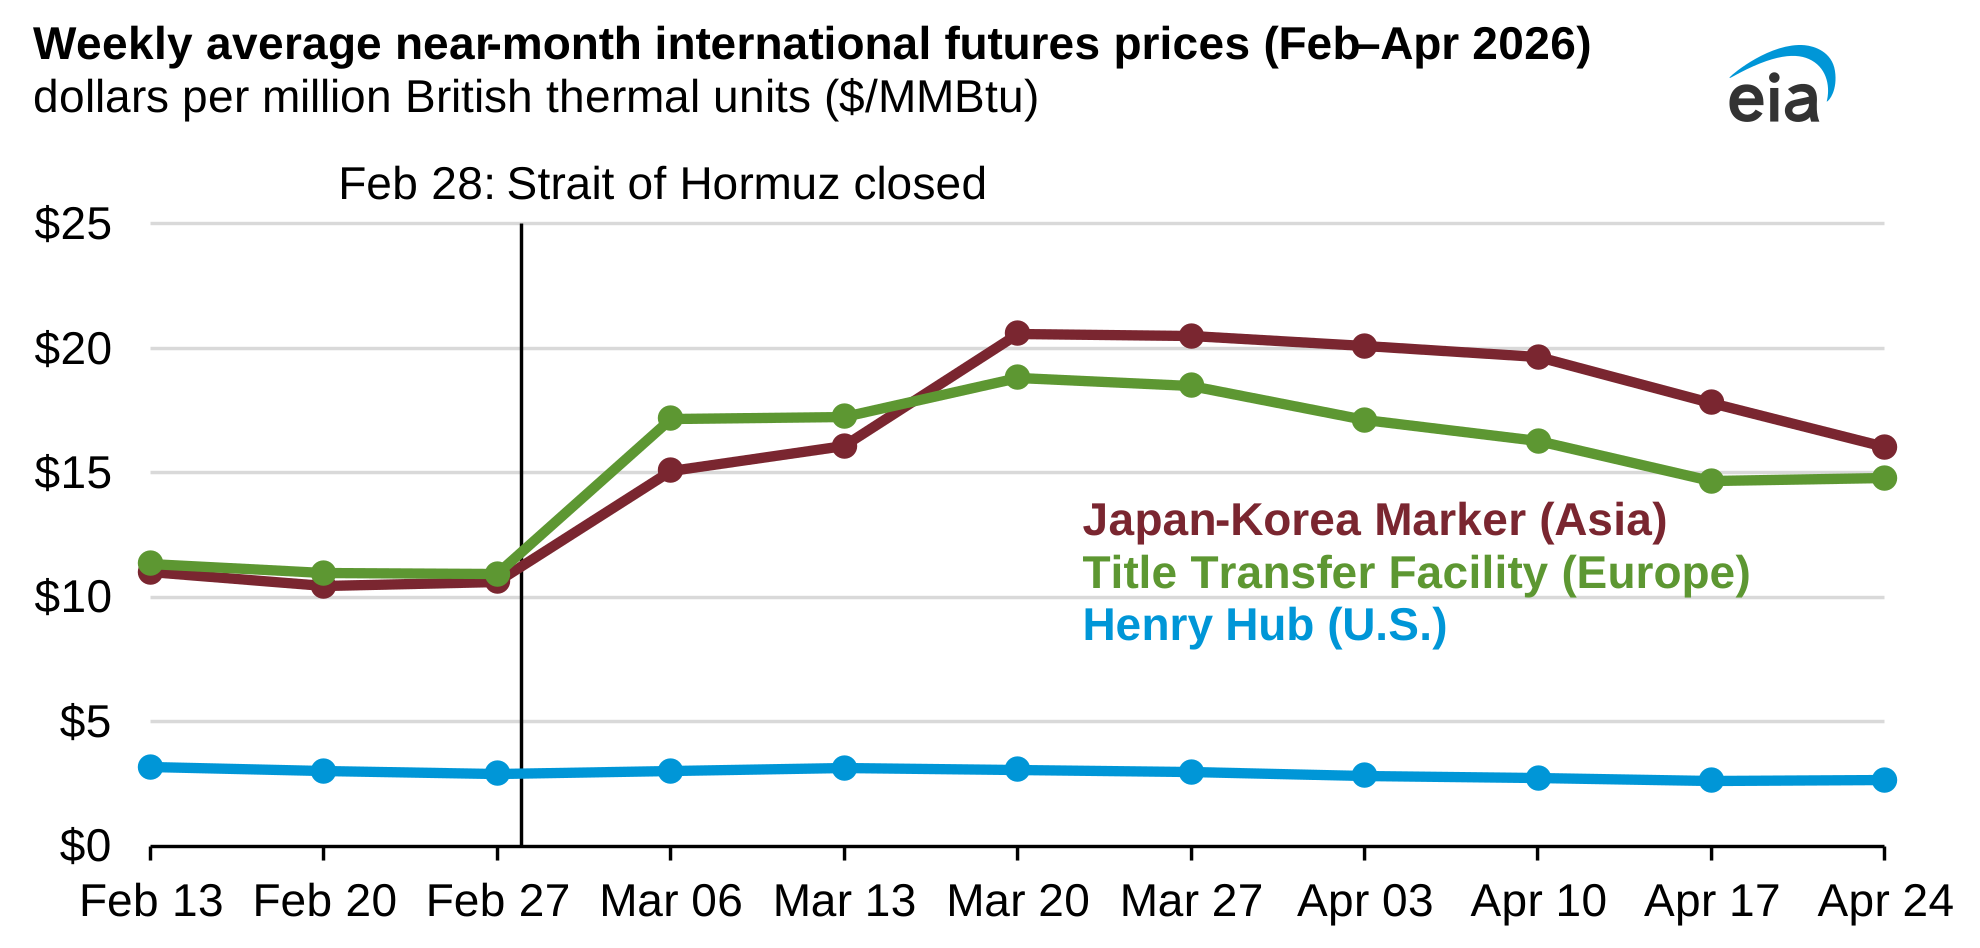
Data source: Bloomberg, L.P.
Note: Weekly average is for the week running Monday–Friday.
Prices for natural gas in Europe and Asia have diverged from those in the United States since the February 28 closure of the Strait of Hormuz.
In-depth analysis
Apr 27, 2026
This TIE was modified to address a correction in terminology and update a link.
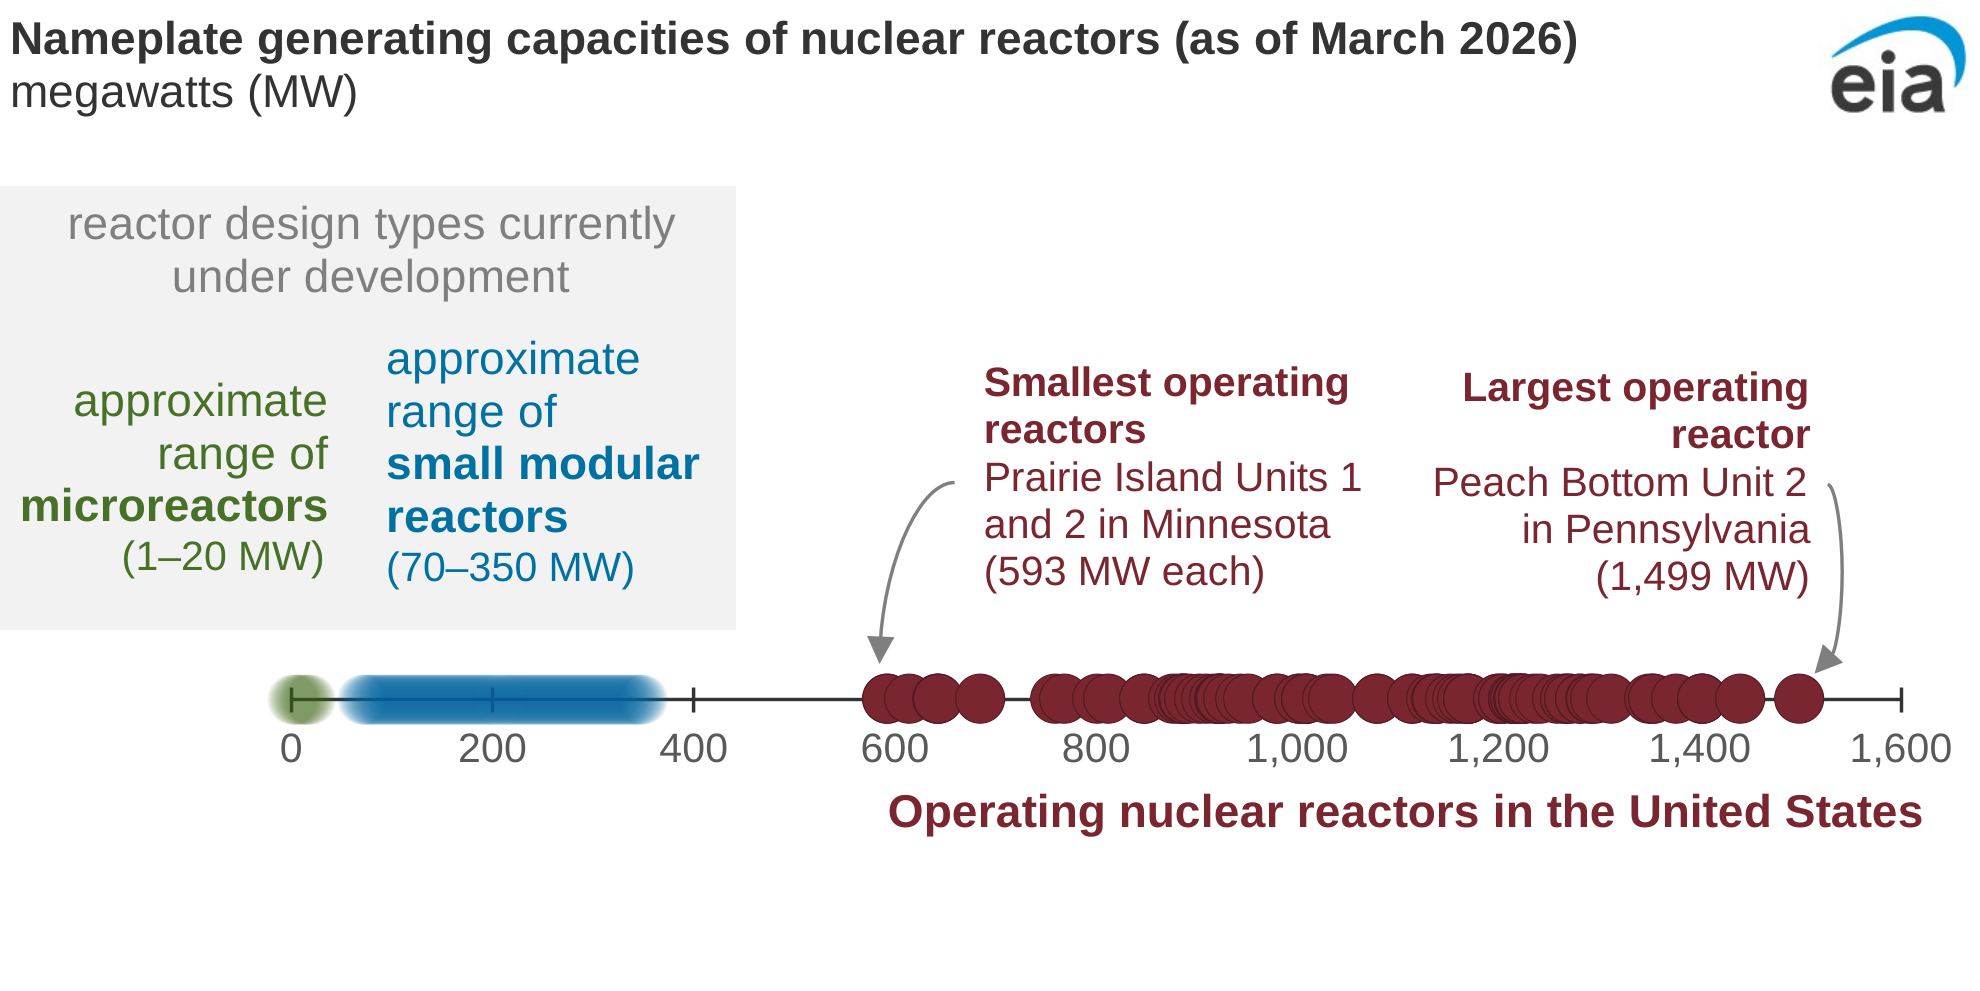
Electric utilities in the United States currently operate about 98 gigawatts (GW) of nuclear generating capacity, but very little nuclear capacity has been built in the last few decades. High capital costs and lengthy licensing and approval processes have limited the expansion of nuclear power. However, several companies are developing new small modular reactor (SMR) designs aimed at reducing capital costs and increasing siting flexibility, challenges associated with traditional nuclear power.
In-brief analysis
Apr 24, 2026
Data source: Intercontinental Exchange, Thomson Reuters
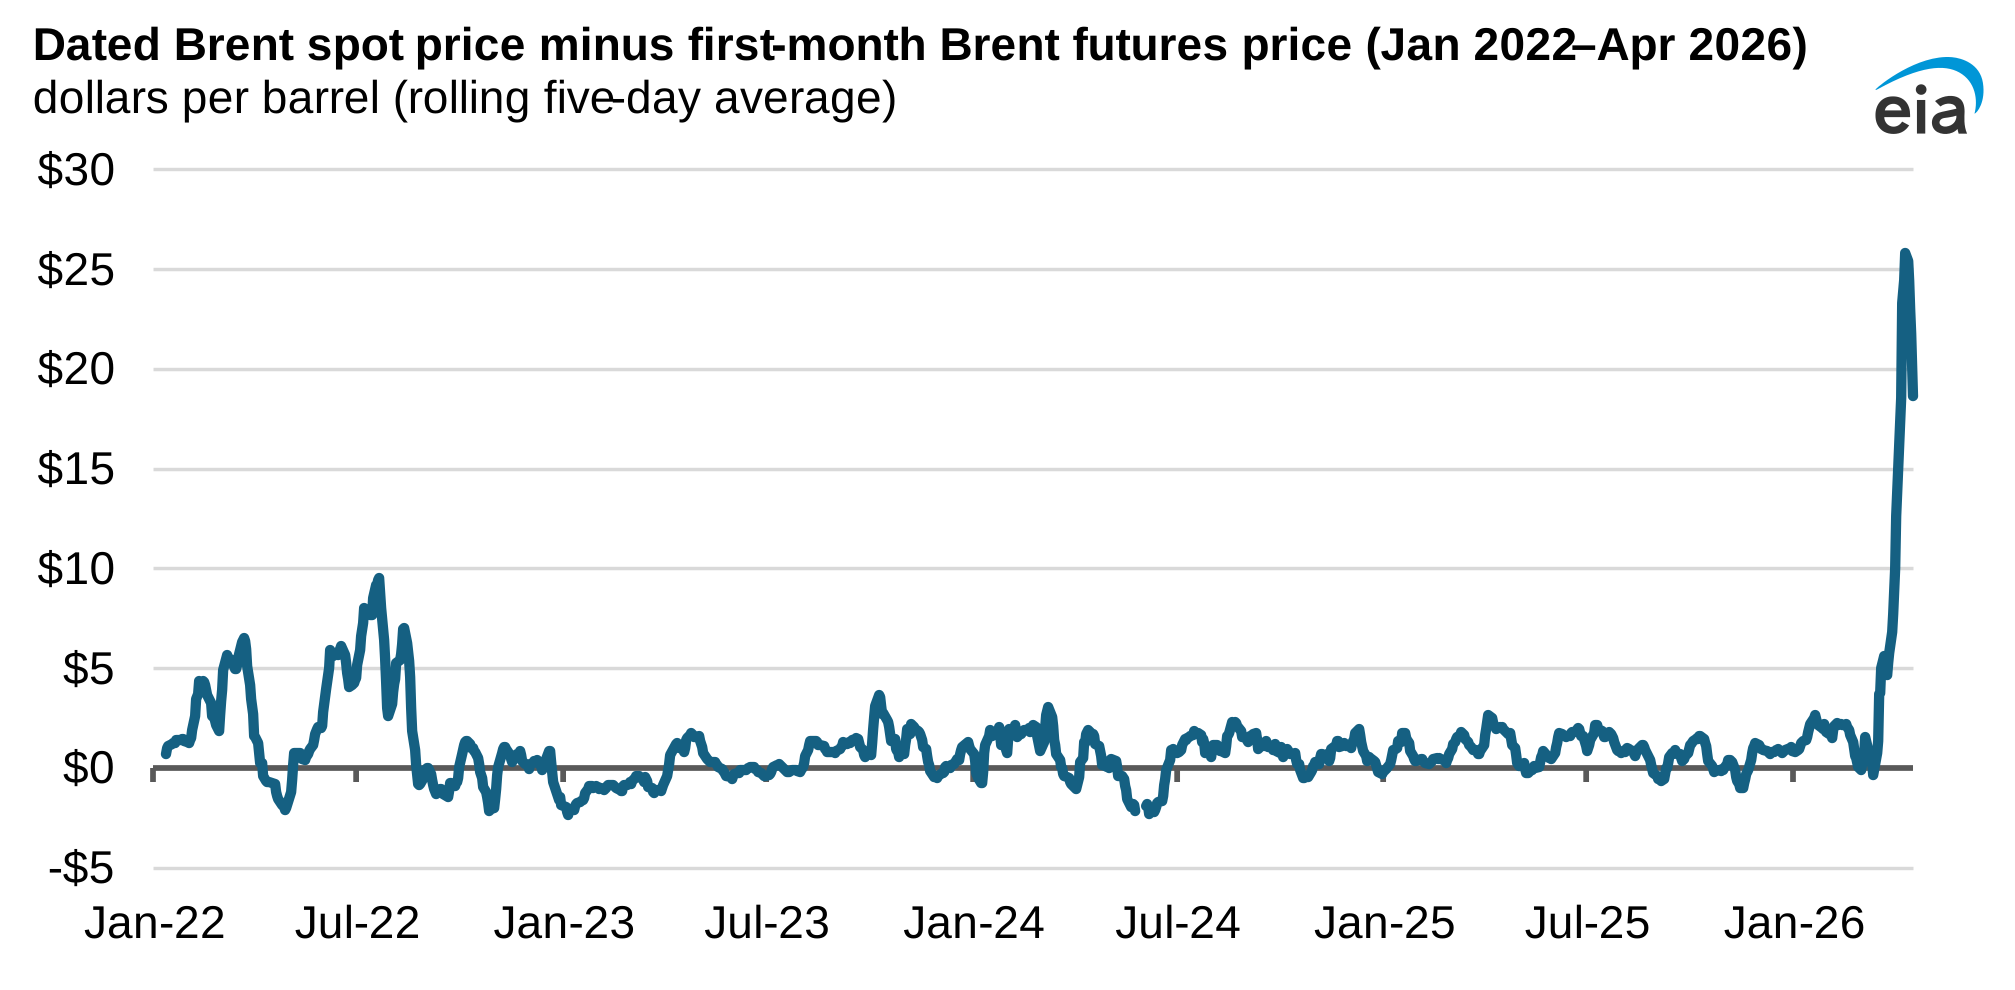
The Dated Brent spot price increased to a premium of more than $25 per barrel (b) compared with the front-month Brent futures contract in early April. Brent crude oil price benchmarks are widely used by commodities traders, financial market participants, economists, and others to assess changes in global petroleum prices more broadly.
In-brief analysis
Apr 23, 2026
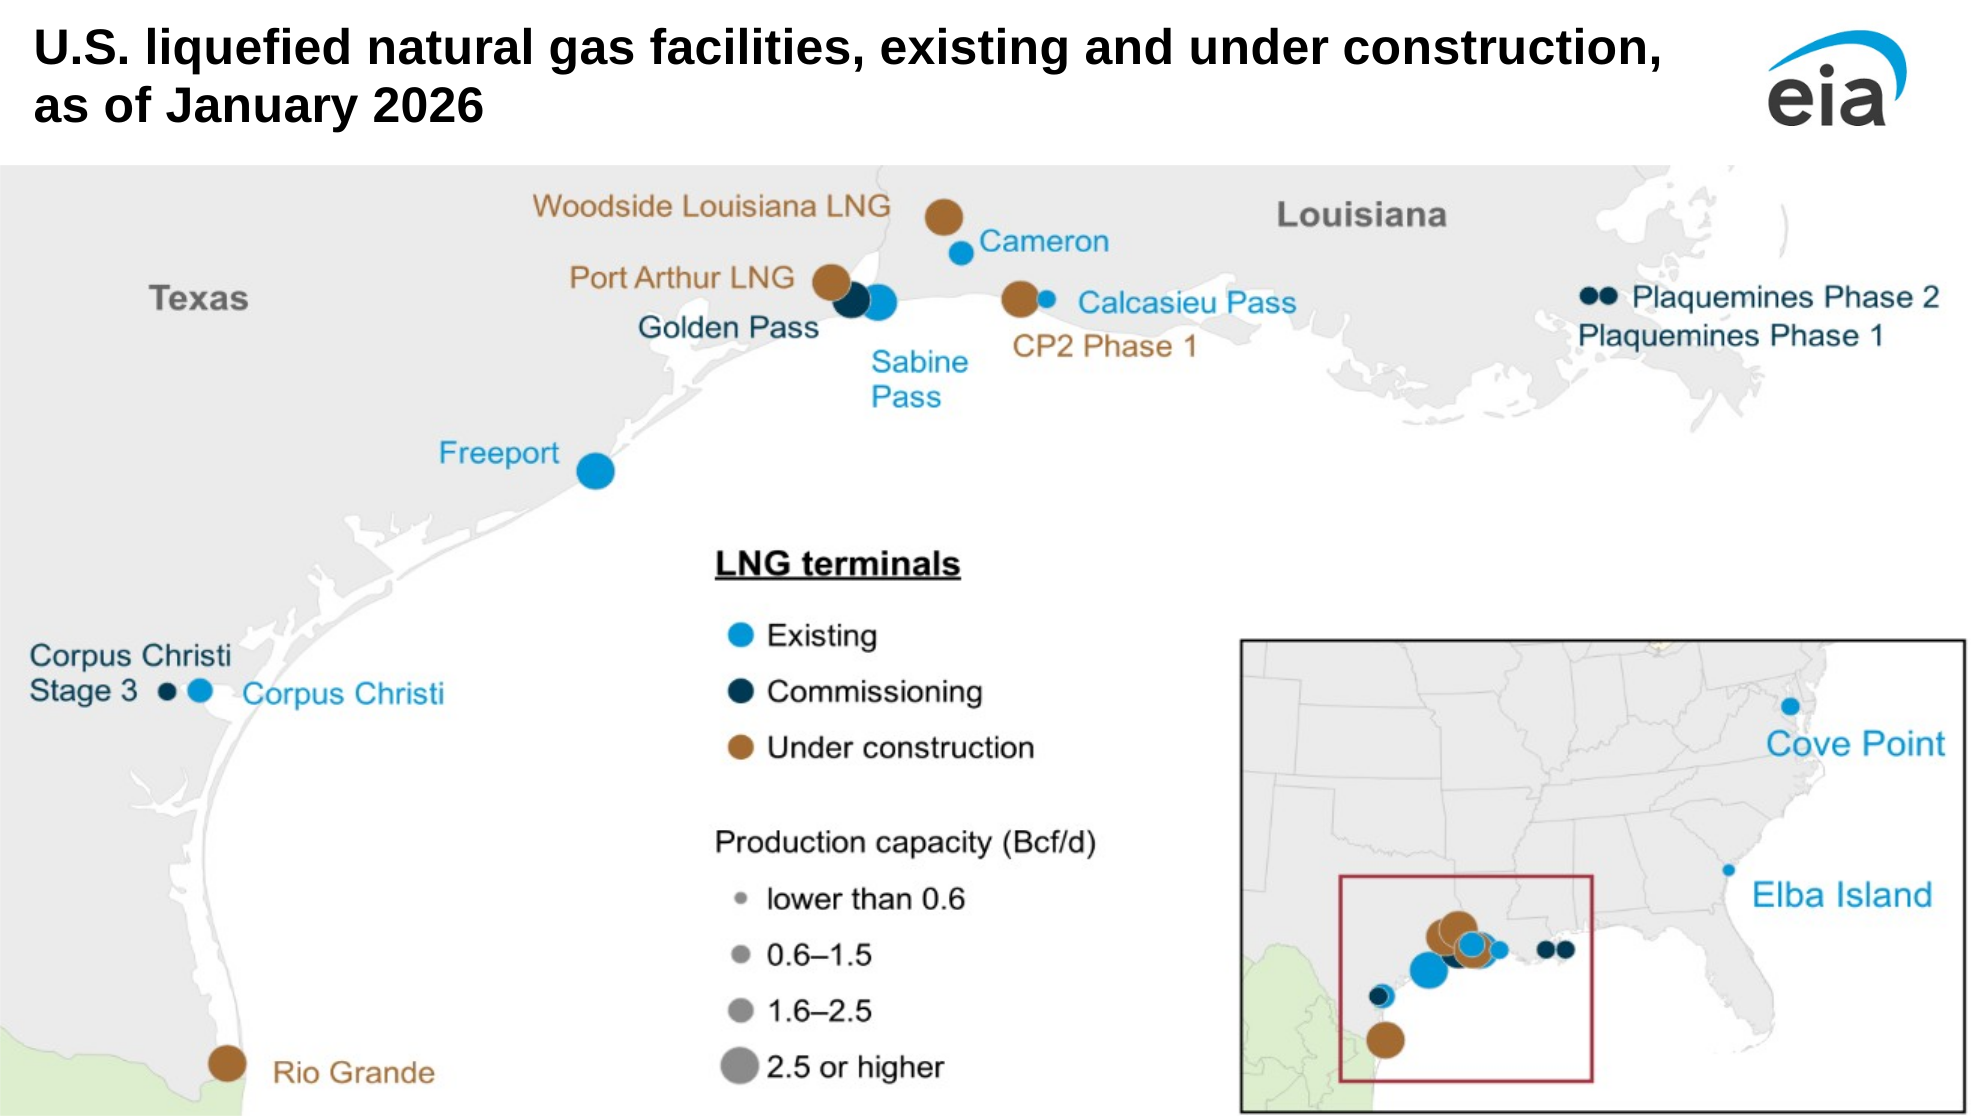
The article has been changed to reflect Corpus Christi and Corpus Christi Liquefaction Stage 3 as one terminal, reflecting the co-location of these projects, although having different liquefaction train technologies.
Data source: U.S. Energy Information Administration, Liquefaction Capacity File; trade press
Note: Bcf/d=billion cubic feet per day; LNG=liquefied natural gas
On April 22, 2026, Golden Pass LNG—the 9th liquefied natural gas (LNG) terminal in the United States—shipped its first cargo from Train 1, according to the project developer. The shipment left port 23 days after achieving first LNG production in March 2026. The terminal began shipping as geopolitical developments in the Strait of Hormuz have affected over 10 billion cubic feet per day (Bcf/d), or approximately 20%, of global supply. Golden Pass LNG is the only new U.S. LNG export terminal currently expected to begin LNG shipments in 2026.
In-brief analysis
Apr 21, 2026
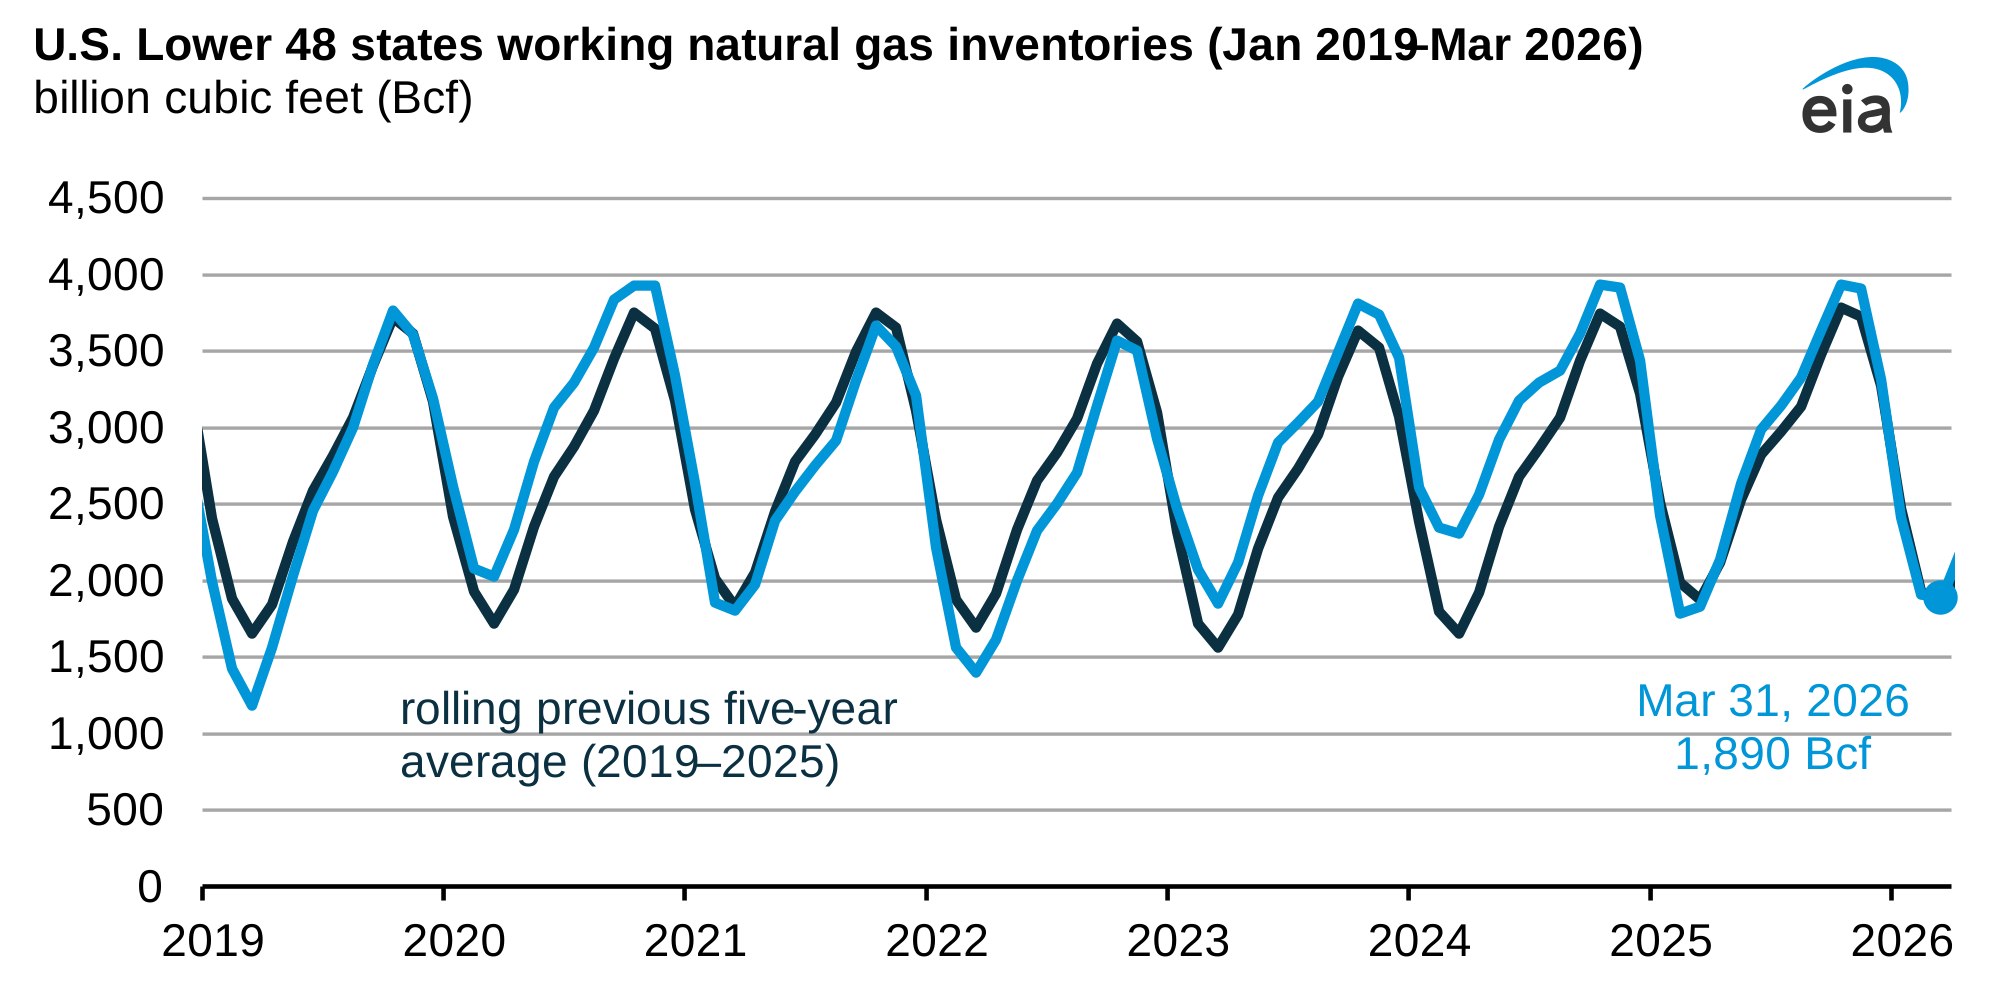
We estimate the Lower 48 U.S. states began this natural gas injection season (April–October) with 1,890 billion cubic feet (Bcf) of working natural gas in storage, based on interpolated data from our Weekly Natural Gas Storage Report. This level was 3% above the previous five-year (2021–25) average and 3% above last year’s end-of-season storage volume.
In-brief analysis
Apr 20, 2026
Data source: U.S. Energy Information Administration, Short-Term Energy Outlook (STEO), March 2026
Note: Other estimates derived from the International Energy Agency, China National Bureau of Statistics, Vortexa Analytics, Kayrros, Kpler, Argus Media, and Global Trade Tracker.
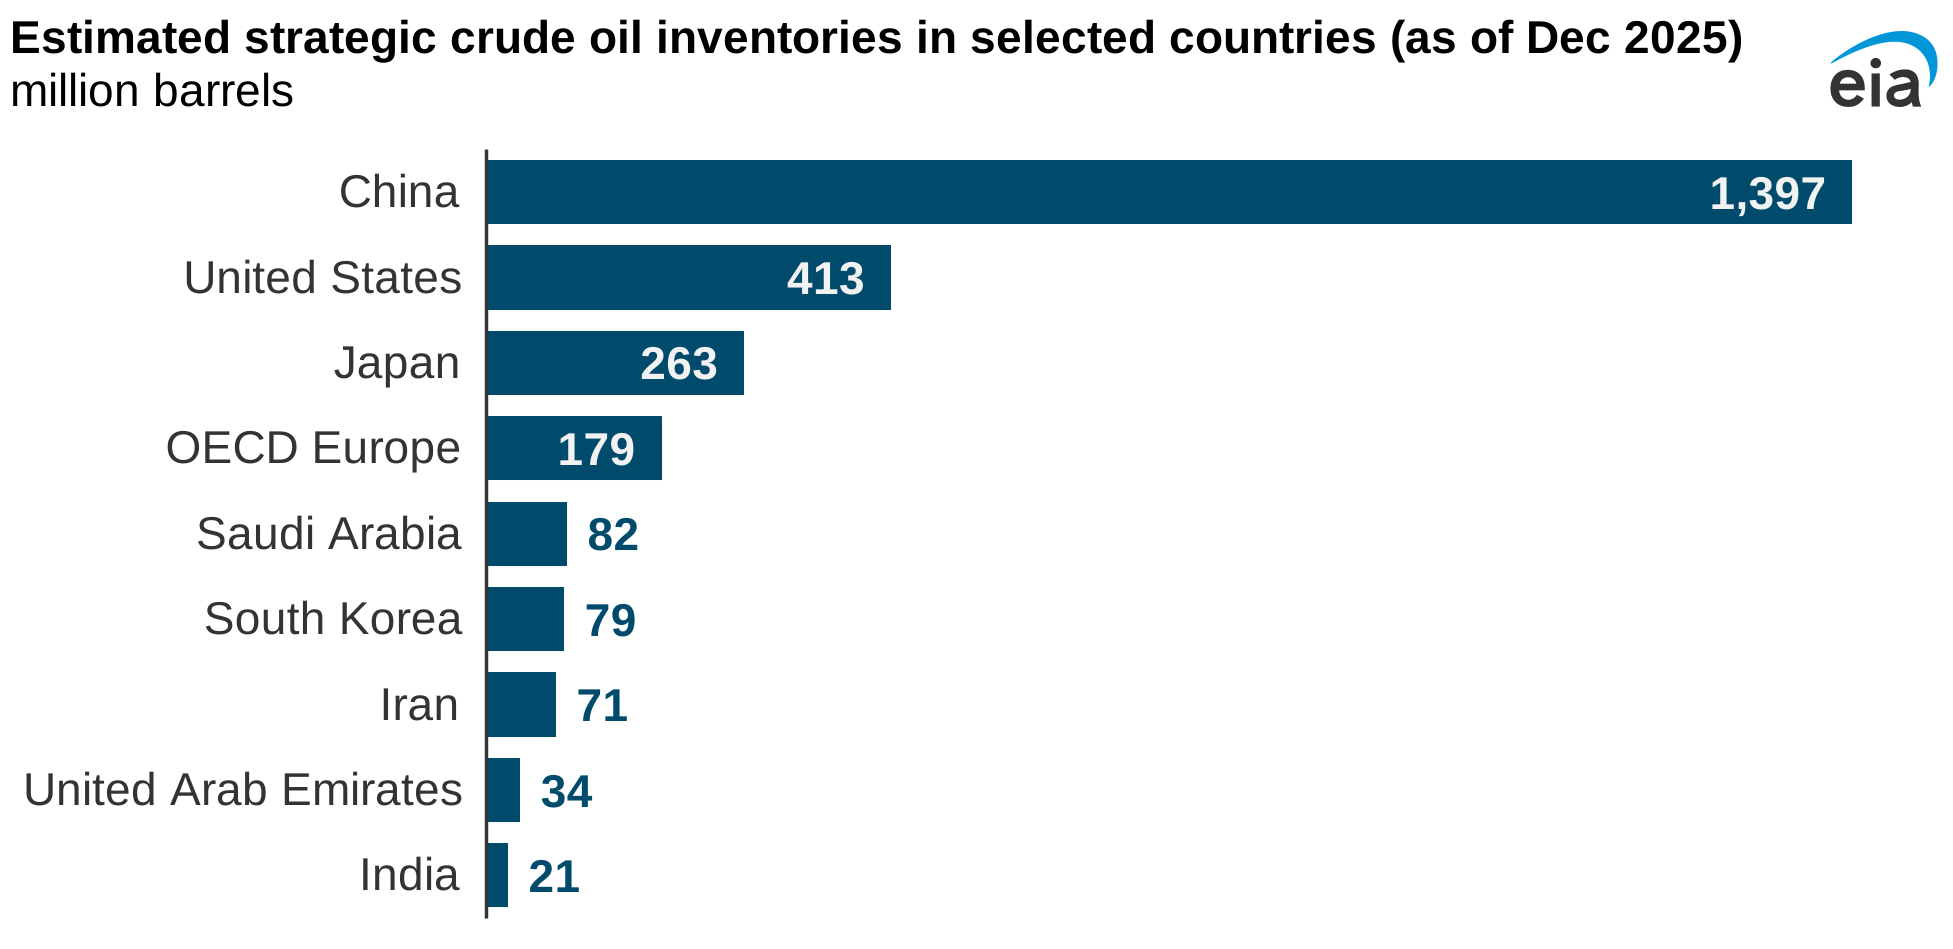
In the 1970s, the United States and other OECD countries established strategic oil stocks aimed at mitigating the impact of supply disruptions. In March 2026, the United States, along with other members of the International Energy Agency, agreed to a coordinated emergency release of strategic oil stocks following the effective closure of the Strait of Hormuz.
In-brief analysis
Apr 16, 2026
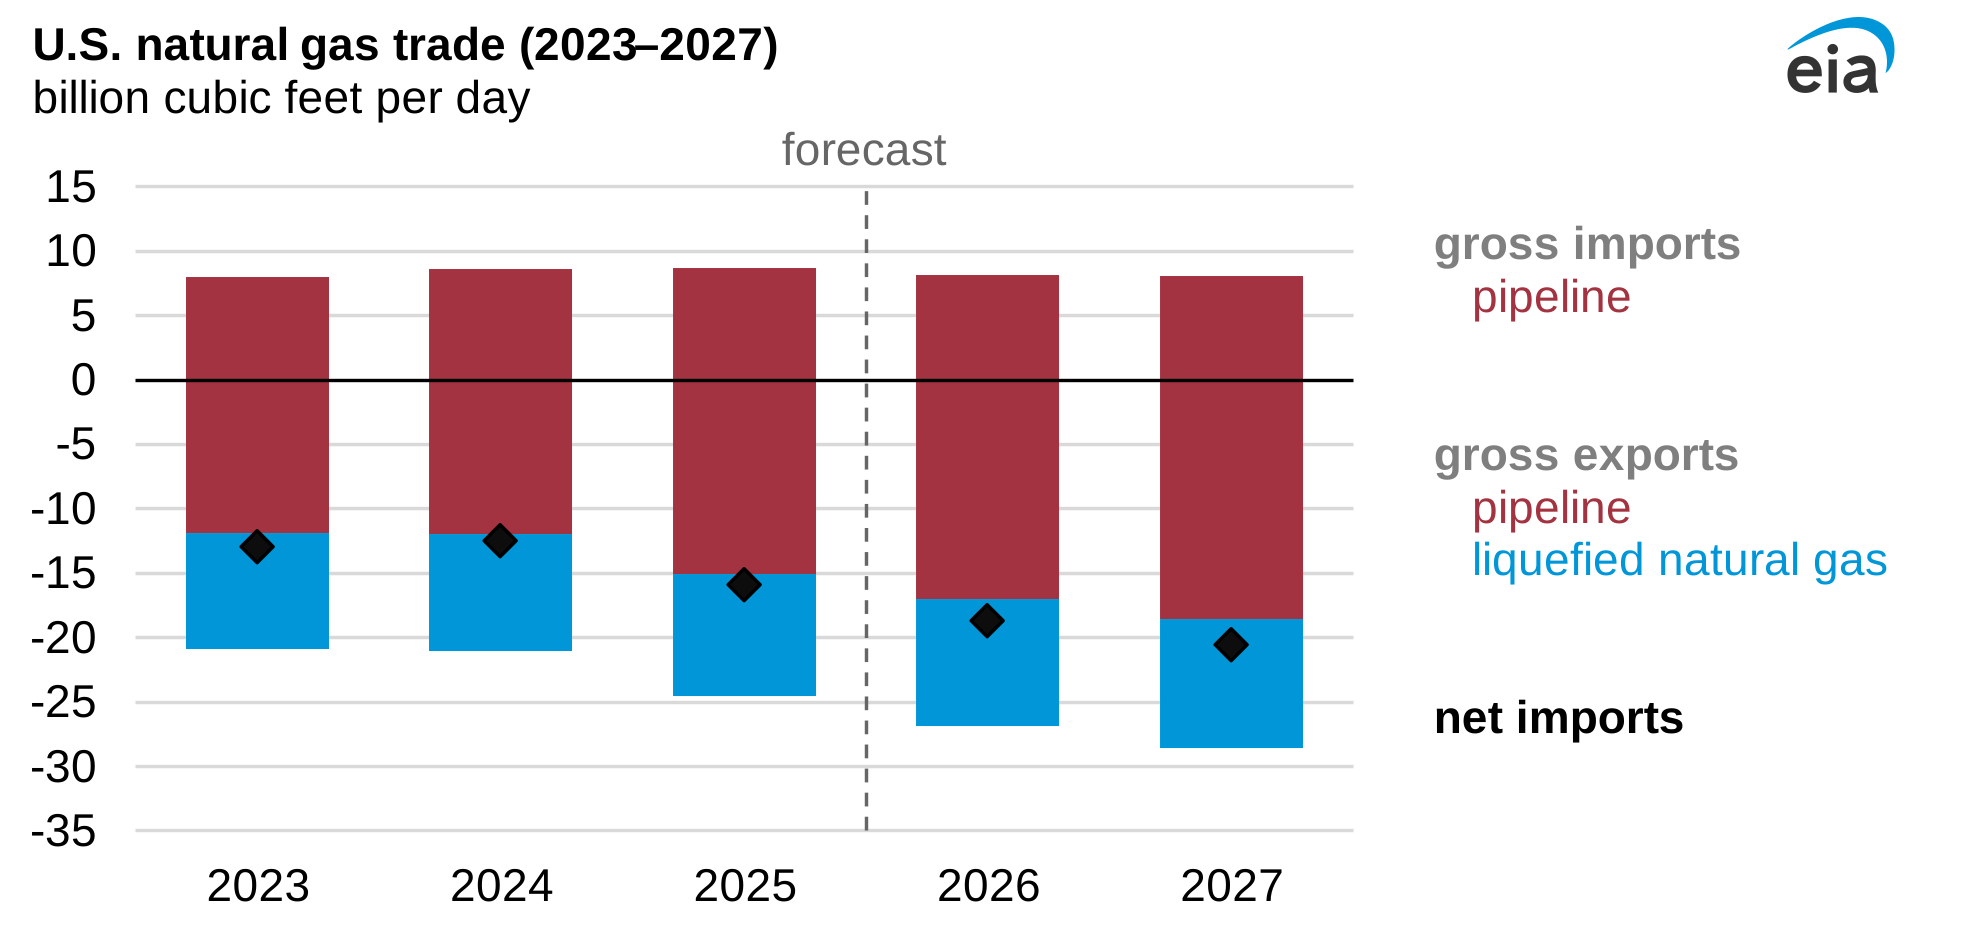
In our latest Short-Term Energy Outlook (STEO), we forecast that U.S. liquefied natural gas (LNG) exports will continue to increase as five LNG export projects start operations and ramp up production by the end of 2027. We also forecast increased natural gas pipeline exports, mainly to Mexico. In our forecast, net exports of U.S. natural gas (exports minus imports) grow 18% to 18.7 billion cubic feet per day (Bcf/d) in 2026. In 2027, net exports increase another 10% to 20.5 Bcf/d.
In-brief analysis
Apr 15, 2026
Repost corrects a labeling error on the map of the United States.
Data source: U.S. Environmental Protection Agency
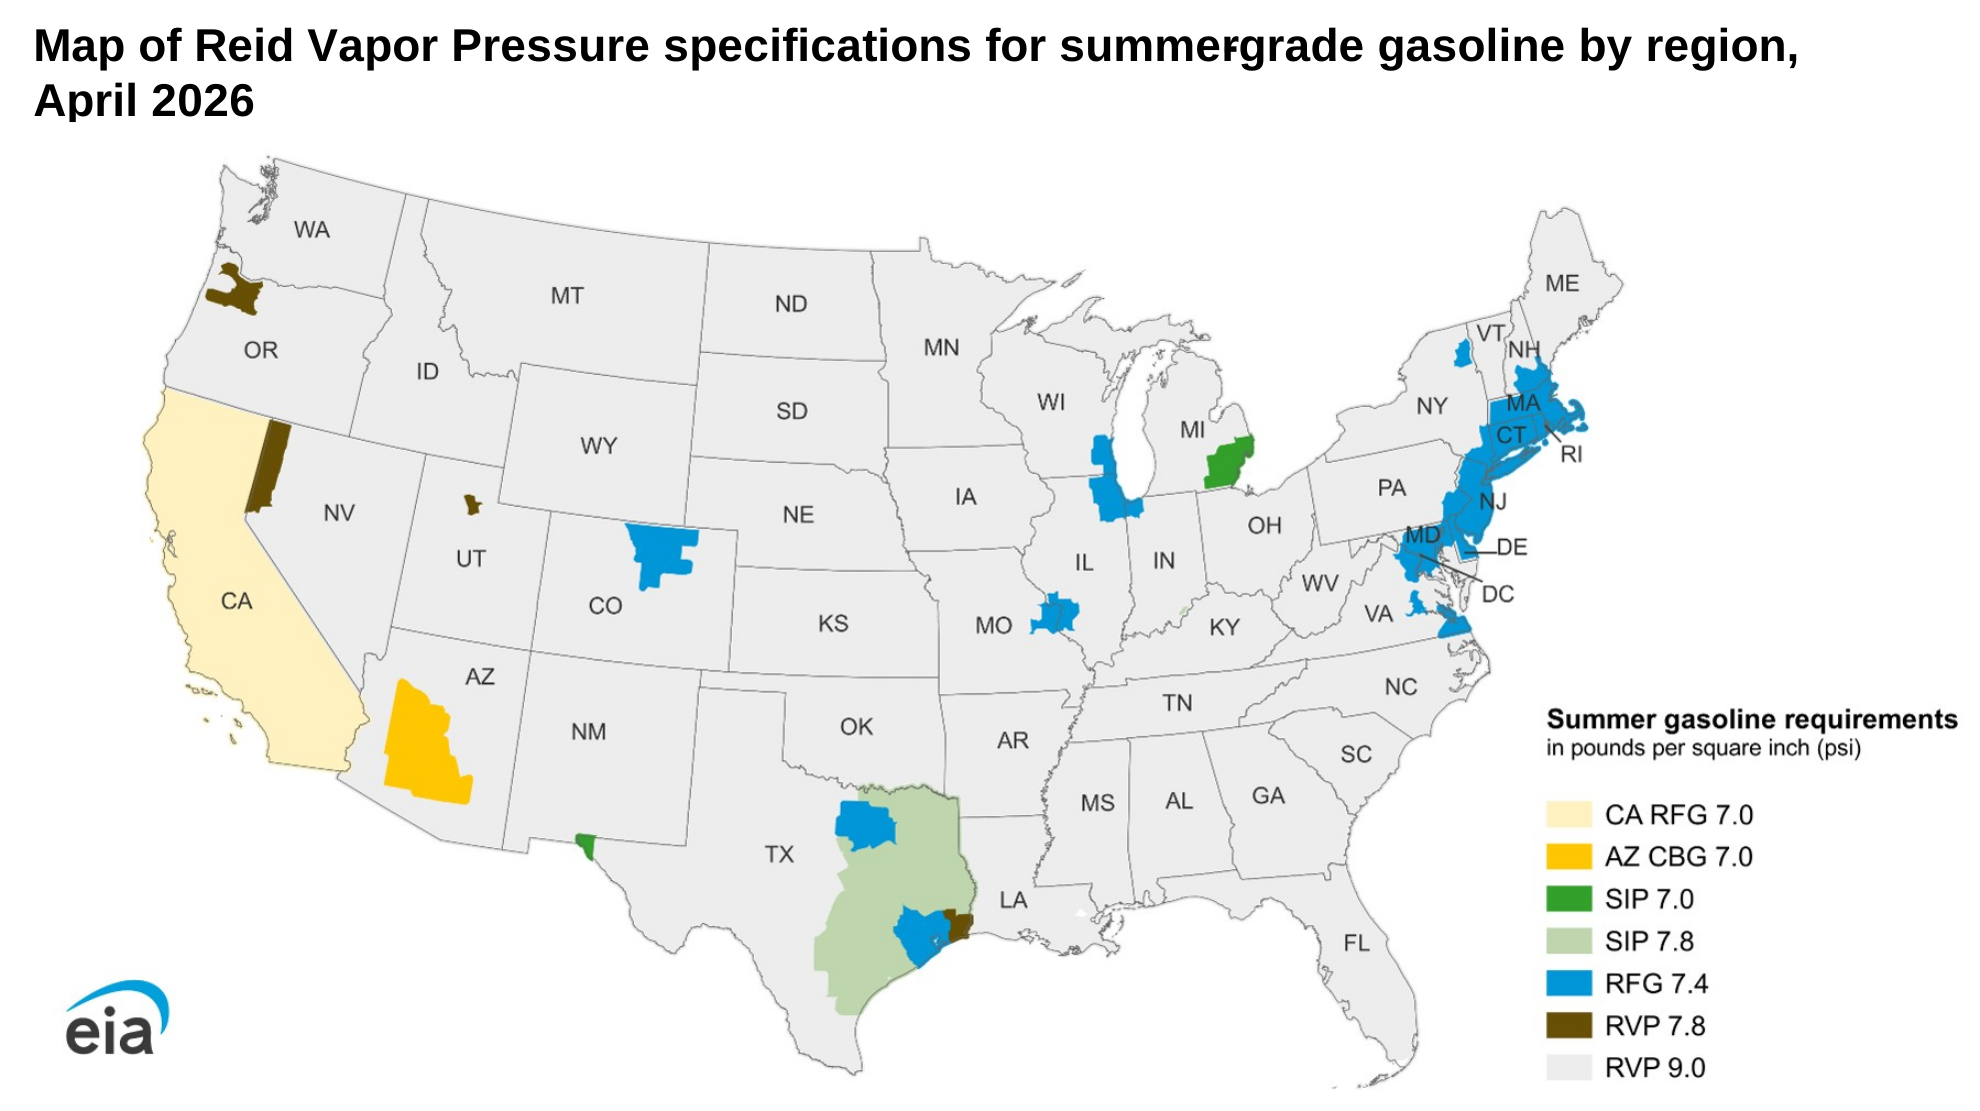
Note: Map includes some partial counties and shows both required and Opt-In RFG areas. In California all counties implement a version of the California Reformulated Gasoline Program, not just those required by the Clean Air Act. Alaska, Hawaii, and U.S. territories are exempt from federal volatility regulations. RVP=Reid Vapor Pressure, RFG=Reformulated Gasoline, SIP=State Implementation Plan, AZ CBG=Arizona Cleaner Burning Gasoline, CA RFG=California Reformulated Gasoline
Motor gasoline in the United States is a blend of hydrocarbons and chemicals, with specific formulas varying by region and season. To meet federal air quality standards, the U.S. Environmental Protection Agency (EPA) and state regulators require different formulations, depending on air quality and location, which affect performance, cost, and emissions. In addition, warmer summer months require a different gasoline formulation than cooler winter months. Key differences between formulations include octane rating, volatility—commonly measured as Reid vapor pressure (RVP)—and emissions. This year, the EPA will relax federal enforcement of summer RVP standards to help reduce gasoline prices.
In-brief analysis
Apr 14, 2026
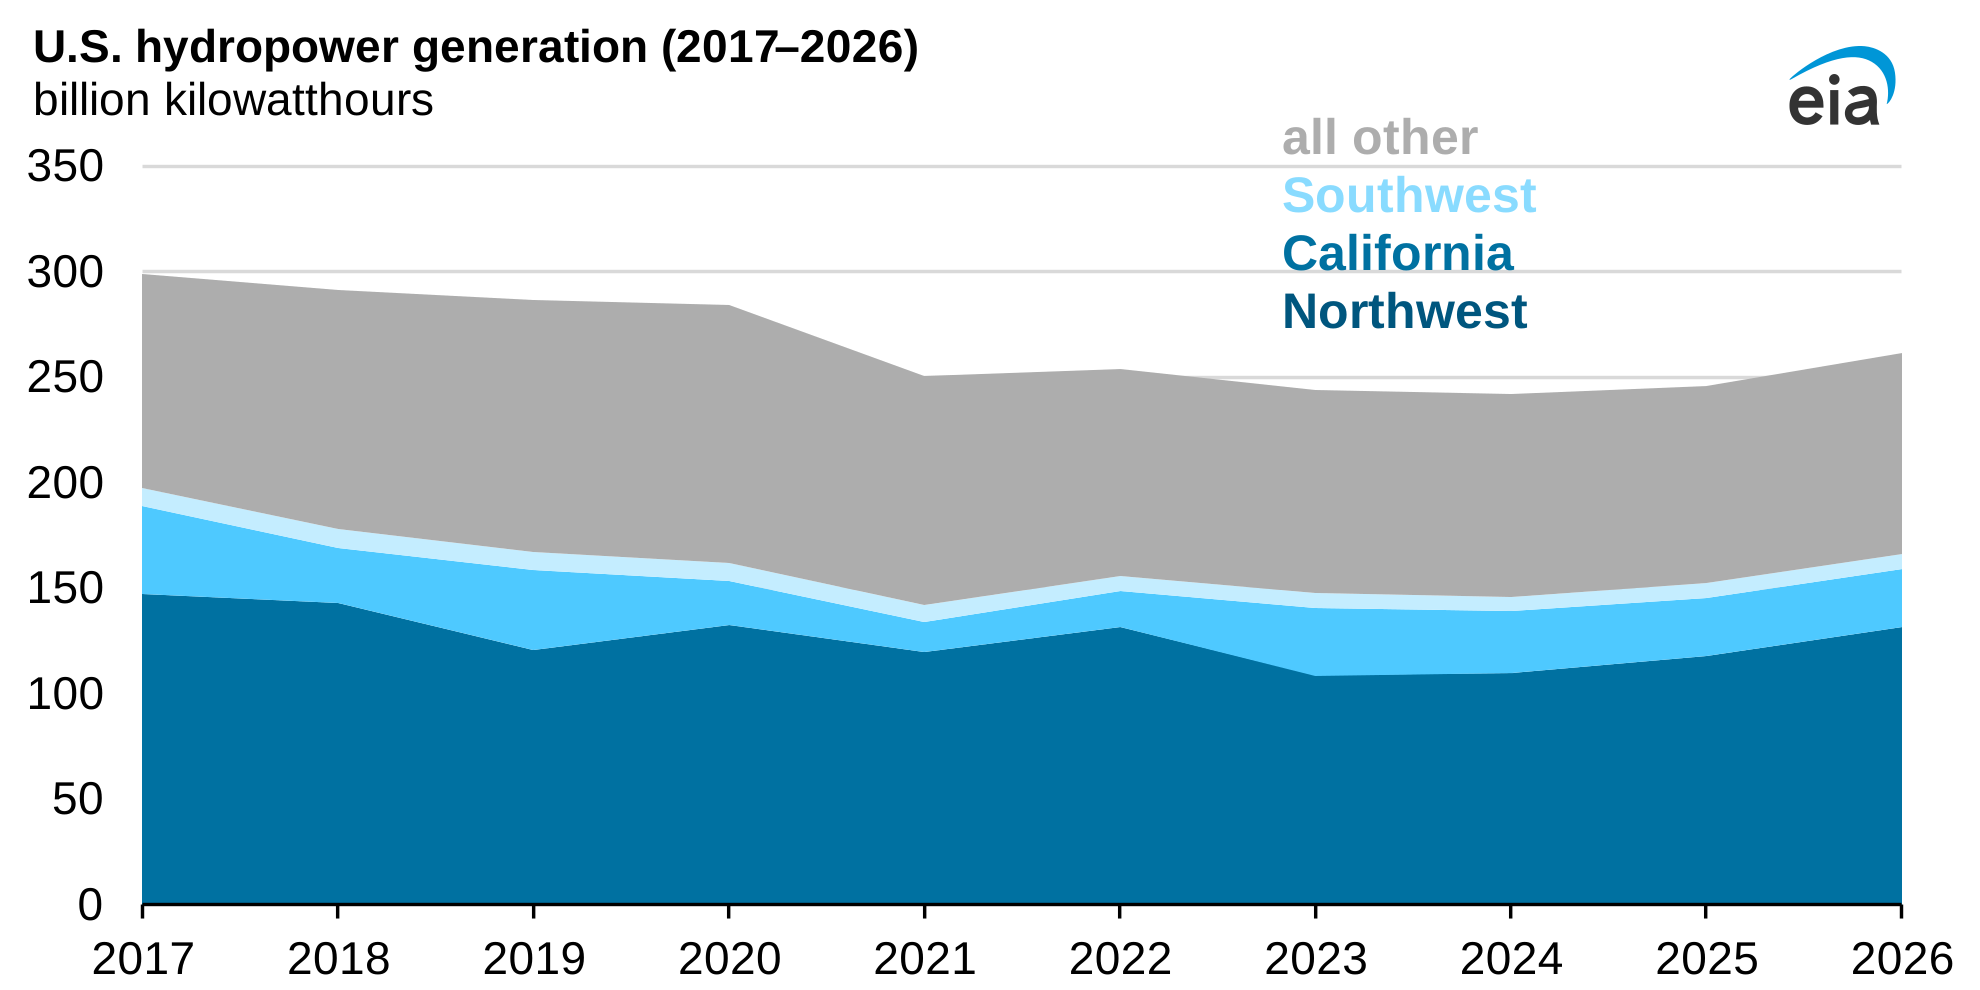
In our April Short-Term Energy Outlook (STEO), we expect U.S. hydropower generation will increase by 5% in 2026 but remain 1.8% below the 10-year average following snow drought conditions in some states. Hydropower generation in 2025 increased to 245 billion kilowatthours (BkWh), about 4 BkWh more than the record-low generation year 2024. In 2026, we expect generation will be 259 BkWh, which would represent 6% of U.S. electricity generation.