
Filter by article type:
In-brief analysis
In-depth analysis
In-brief analysis
May 20, 2026
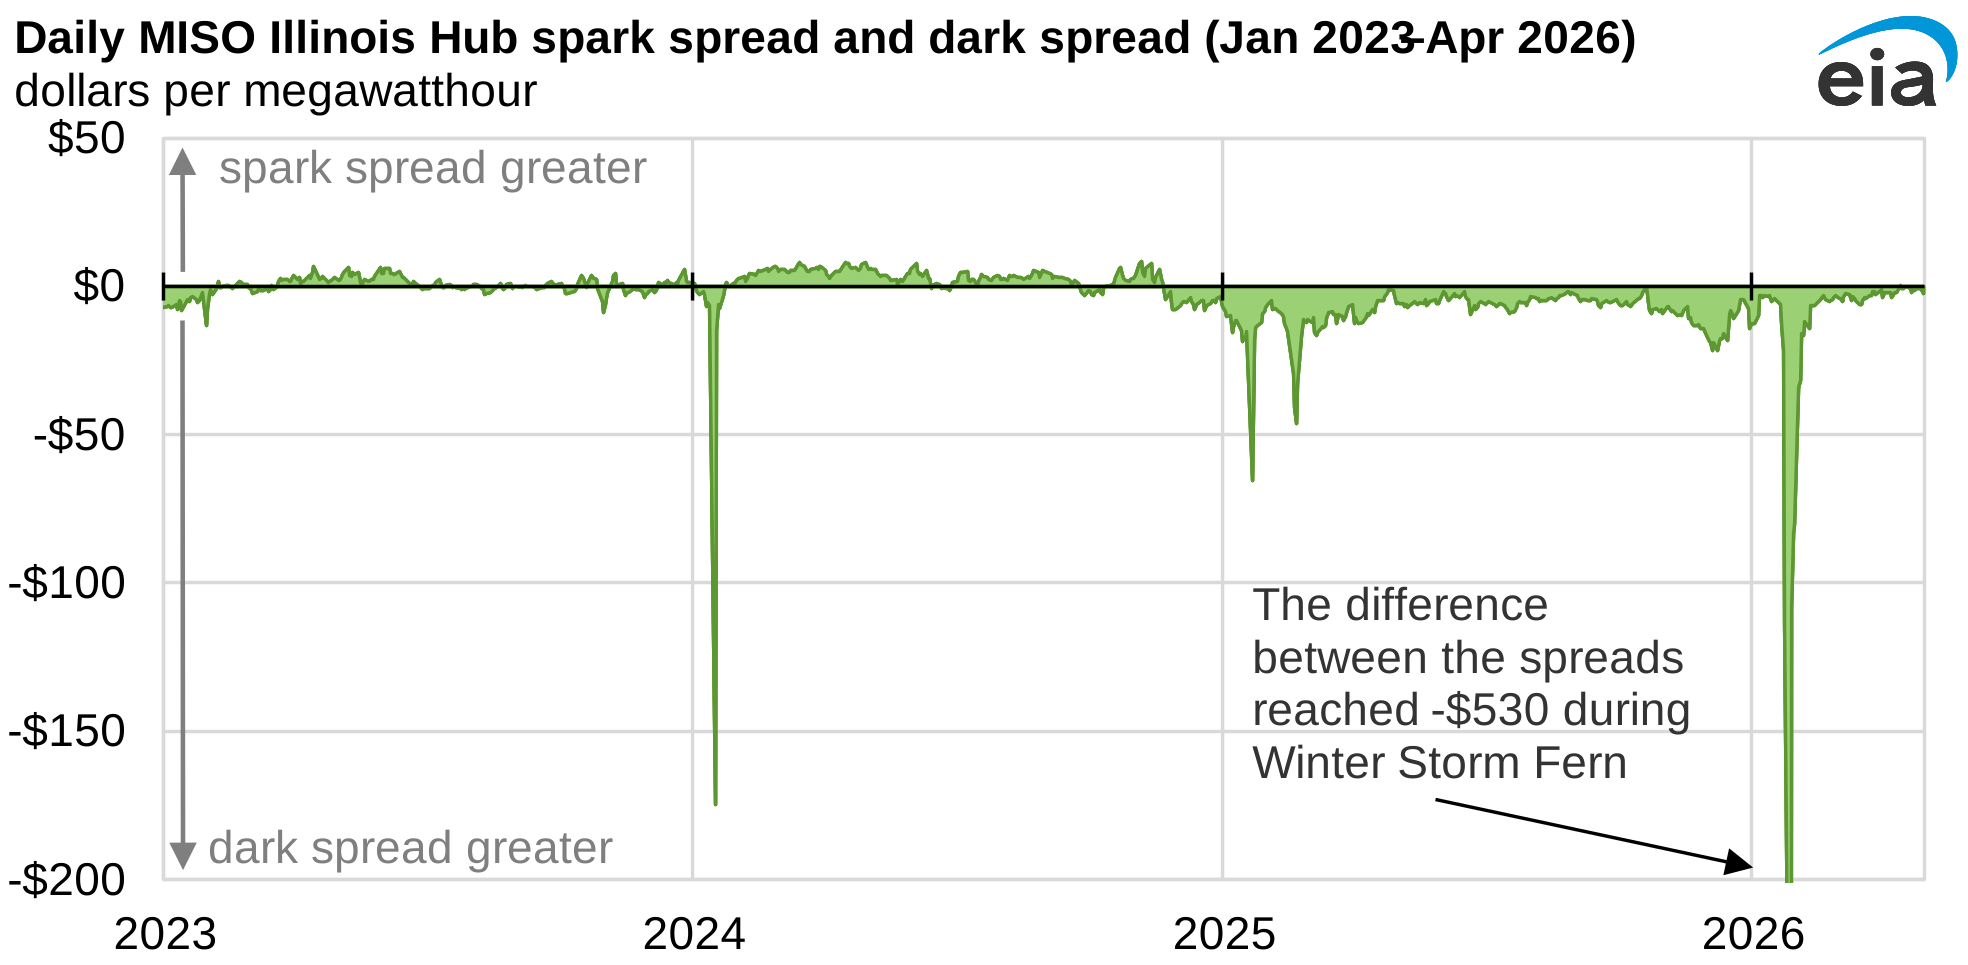
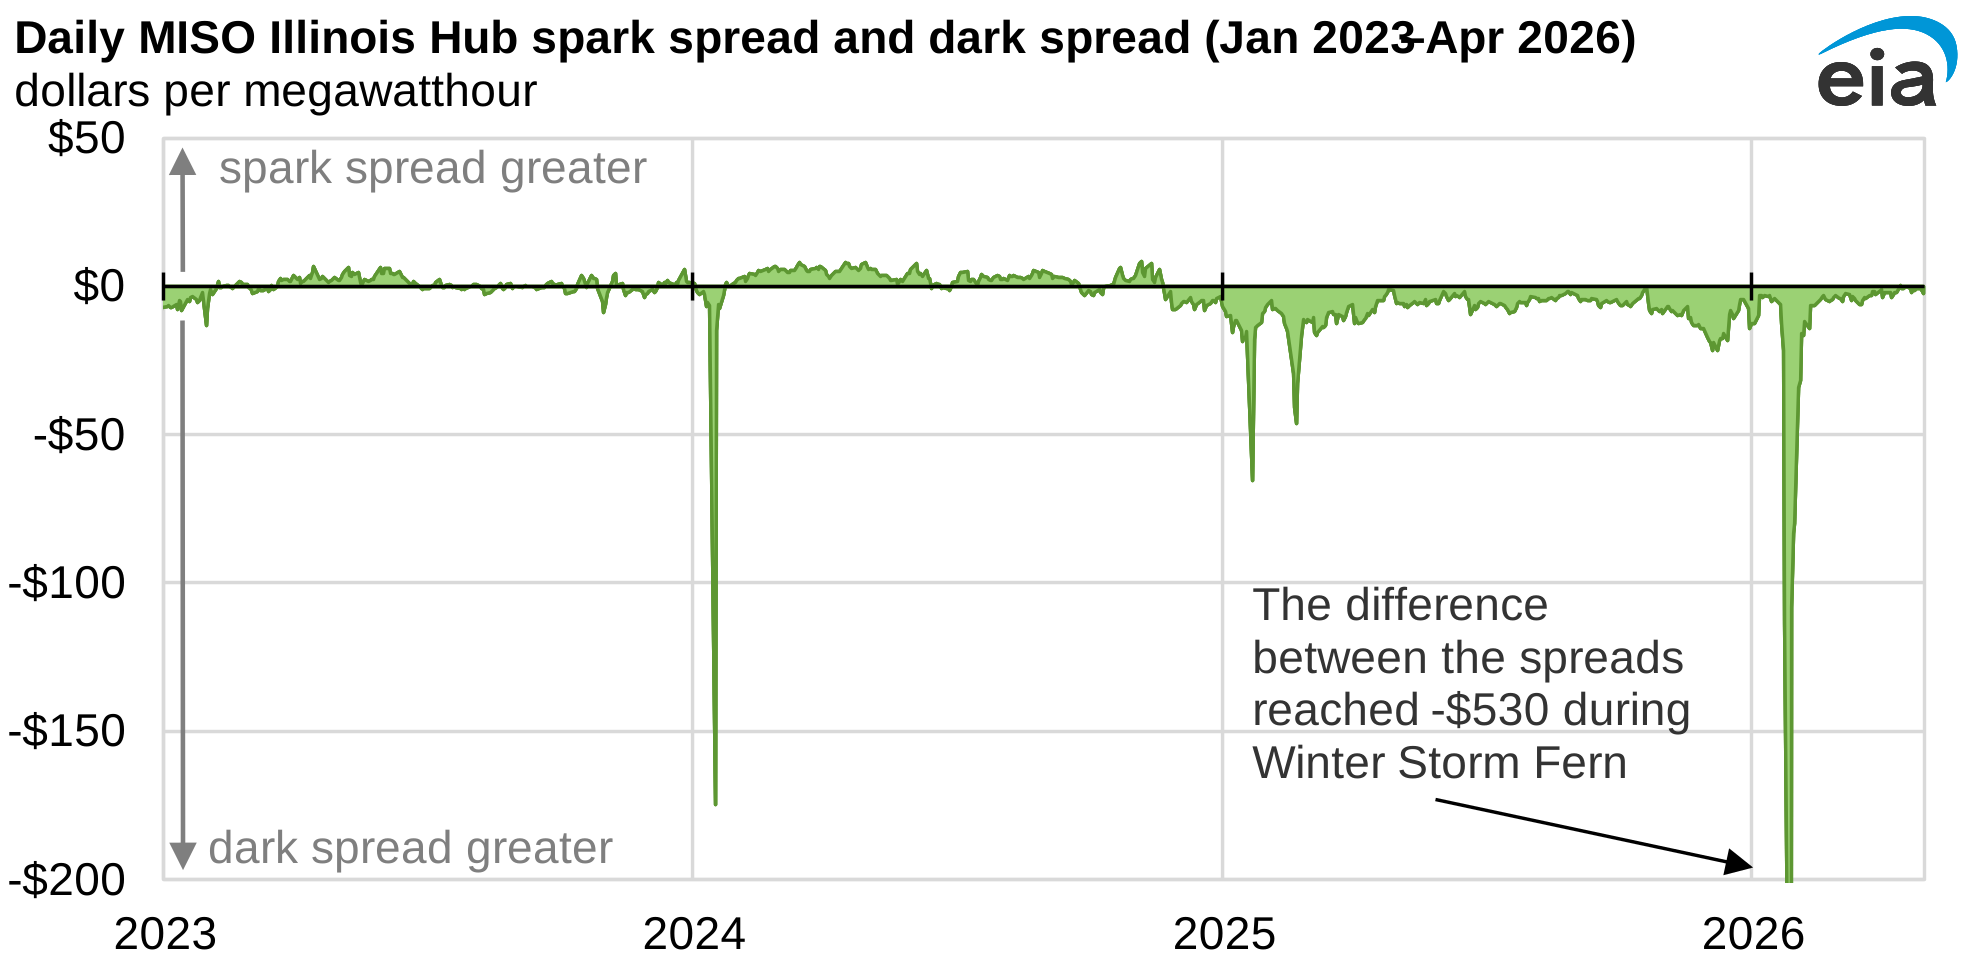
Data source: U.S. Energy Information Administration, based on data from S&P Global Market Intelligence
Note: The specifics of the calculation methodology are detailed in our 2017 Today in Energy article, with minor adjustments to heat rates and heat contents used. The heat rate used for the dark spread was 10,579 British thermal units per kilowatthour (Btu/kWh) while the heat rate for the spark spread was 8,365 Btu/kWh.
In the first four months of 2026, electricity, natural gas, and coal prices suggested continued favorable economics for coal generation in MISO. The dark spread of coal, the difference between the fuel costs for coal-fired generation and the wholesale electricity price, in the Midcontinent Independent System Operator (MISO) region outpaced a similar measure of revenue relative to fuel costs for natural gas-fired generators known as the spark spread.
In-brief analysis
May 19, 2026
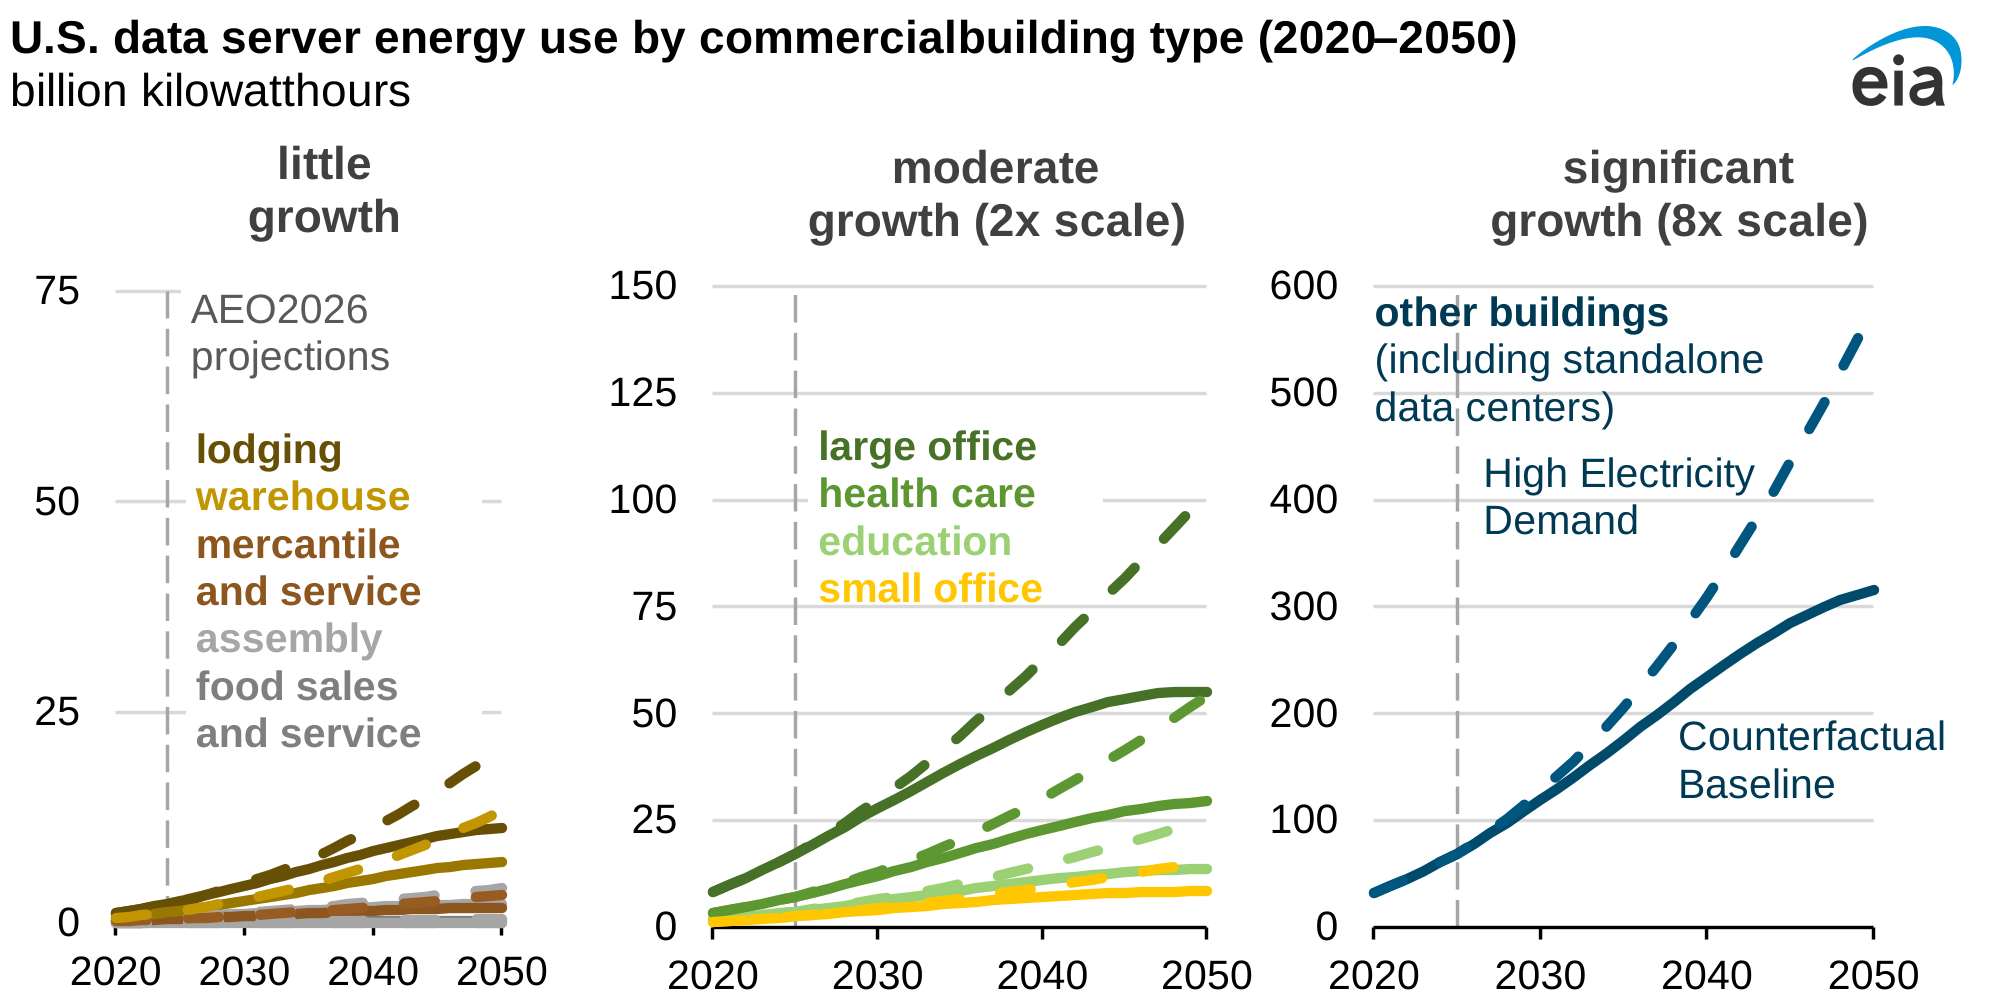
Data source: U.S. Energy Information Administration, Annual Energy Outlook 2026 (AEO2026) Counterfactual Baseline and High Electricity Demand cases
In the Annual Energy Outlook 2026 (AEO2026), our long-term outlook, we project electricity consumed by data center servers will increase across the commercial building stock, increasing more in standalone data centers than in all other data center rooms combined. By 2050, server consumption alone reaches between 446 billion kilowatthours (BkWh) and 818 billion BkWh. The highest end of the range reflects faster growth in server power draw and installed stock in our High Electricity Demand case. Standalone data centers are represented in the other buildings category, where we project servers will consume 581 BkWh of electricity in 2050 in our High Electricity Demand case. Across all cases, servers alone accounted for an estimated 7% of commercial sector electricity consumption in 2025. Data center server electricity use grows to 22%–33% of commercial building electricity use by 2050 across our cases.
In-brief analysis
May 15, 2026
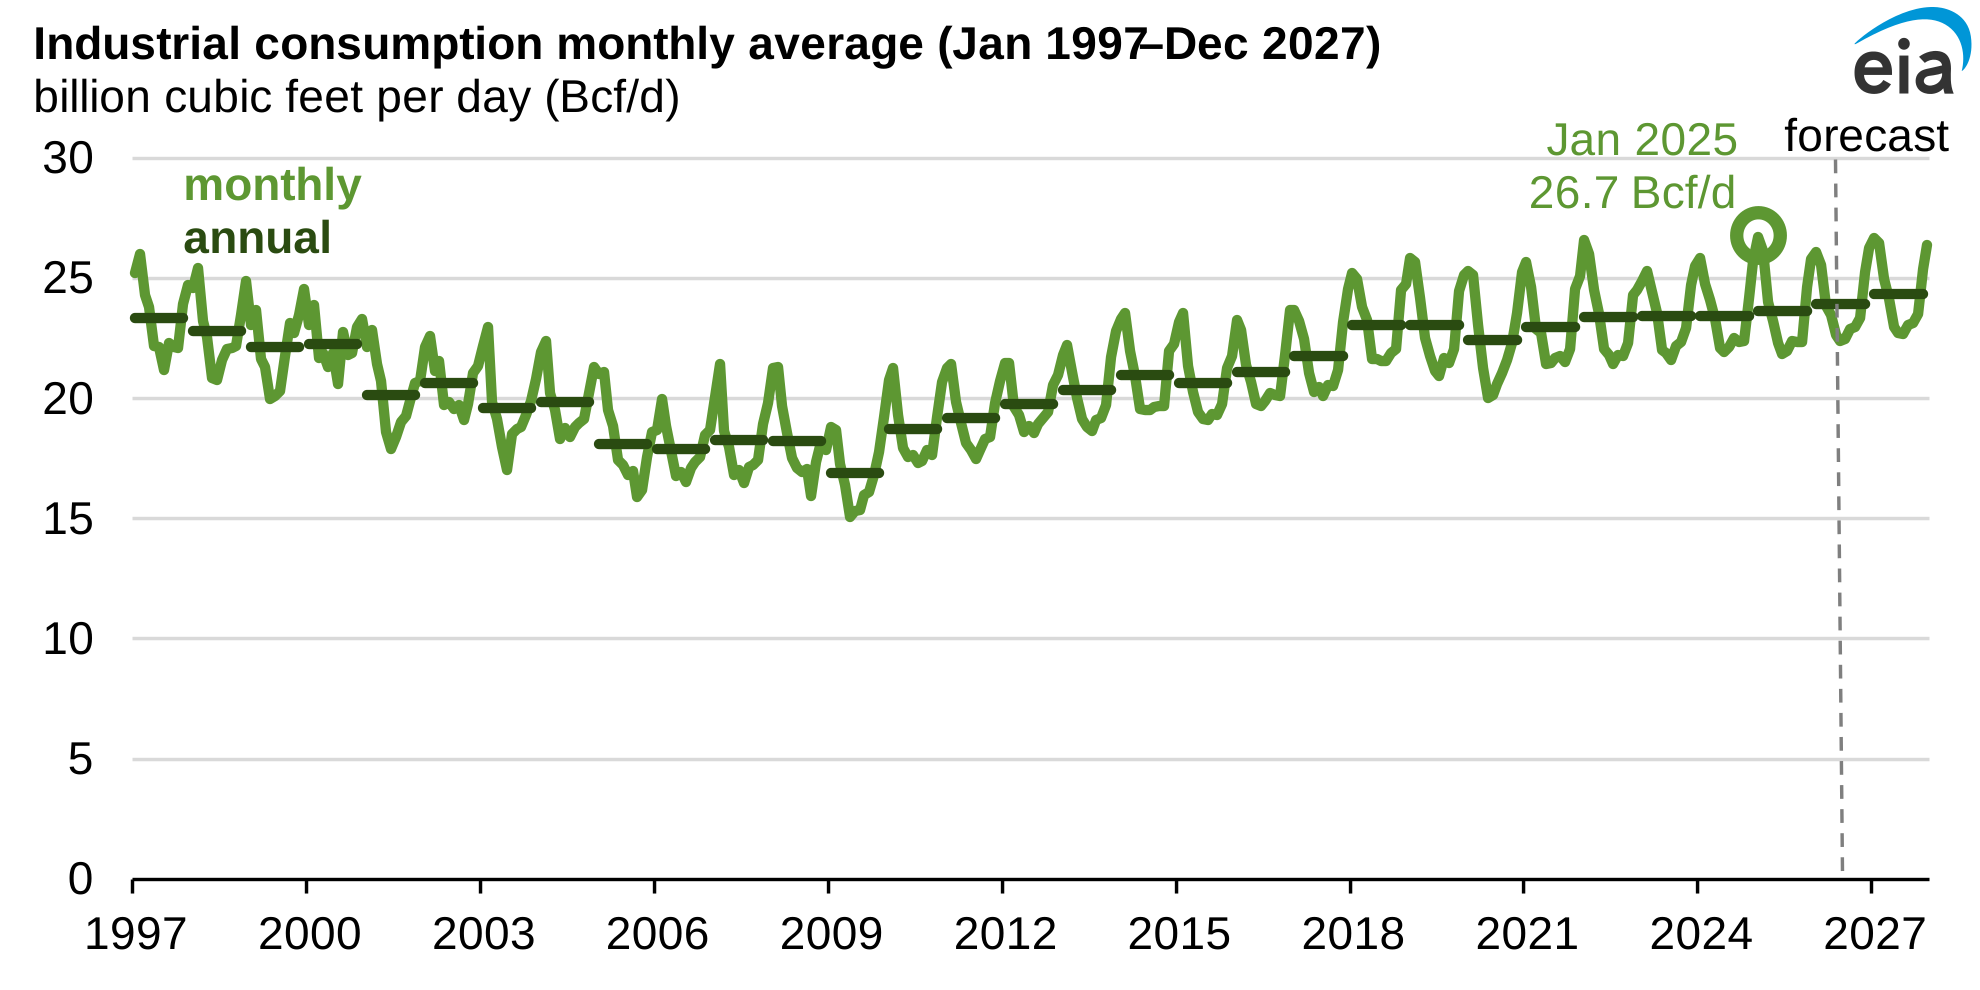
We forecast U.S. industrial natural gas consumption will climb to record highs through 2027 in our latest Short-Term Energy Outlook. Industrial consumption averaged a record 23.6 billion cubic feet per day (Bcf/d) in 2025, 1% more than the record 23.4 Bcf/d reached in 2023. In our forecast, consumption gradually increases further in 2026 and in 2027 as we expect the natural gas-weighted manufacturing index to also rise slightly over this period.
In-brief analysis
May 13, 2026
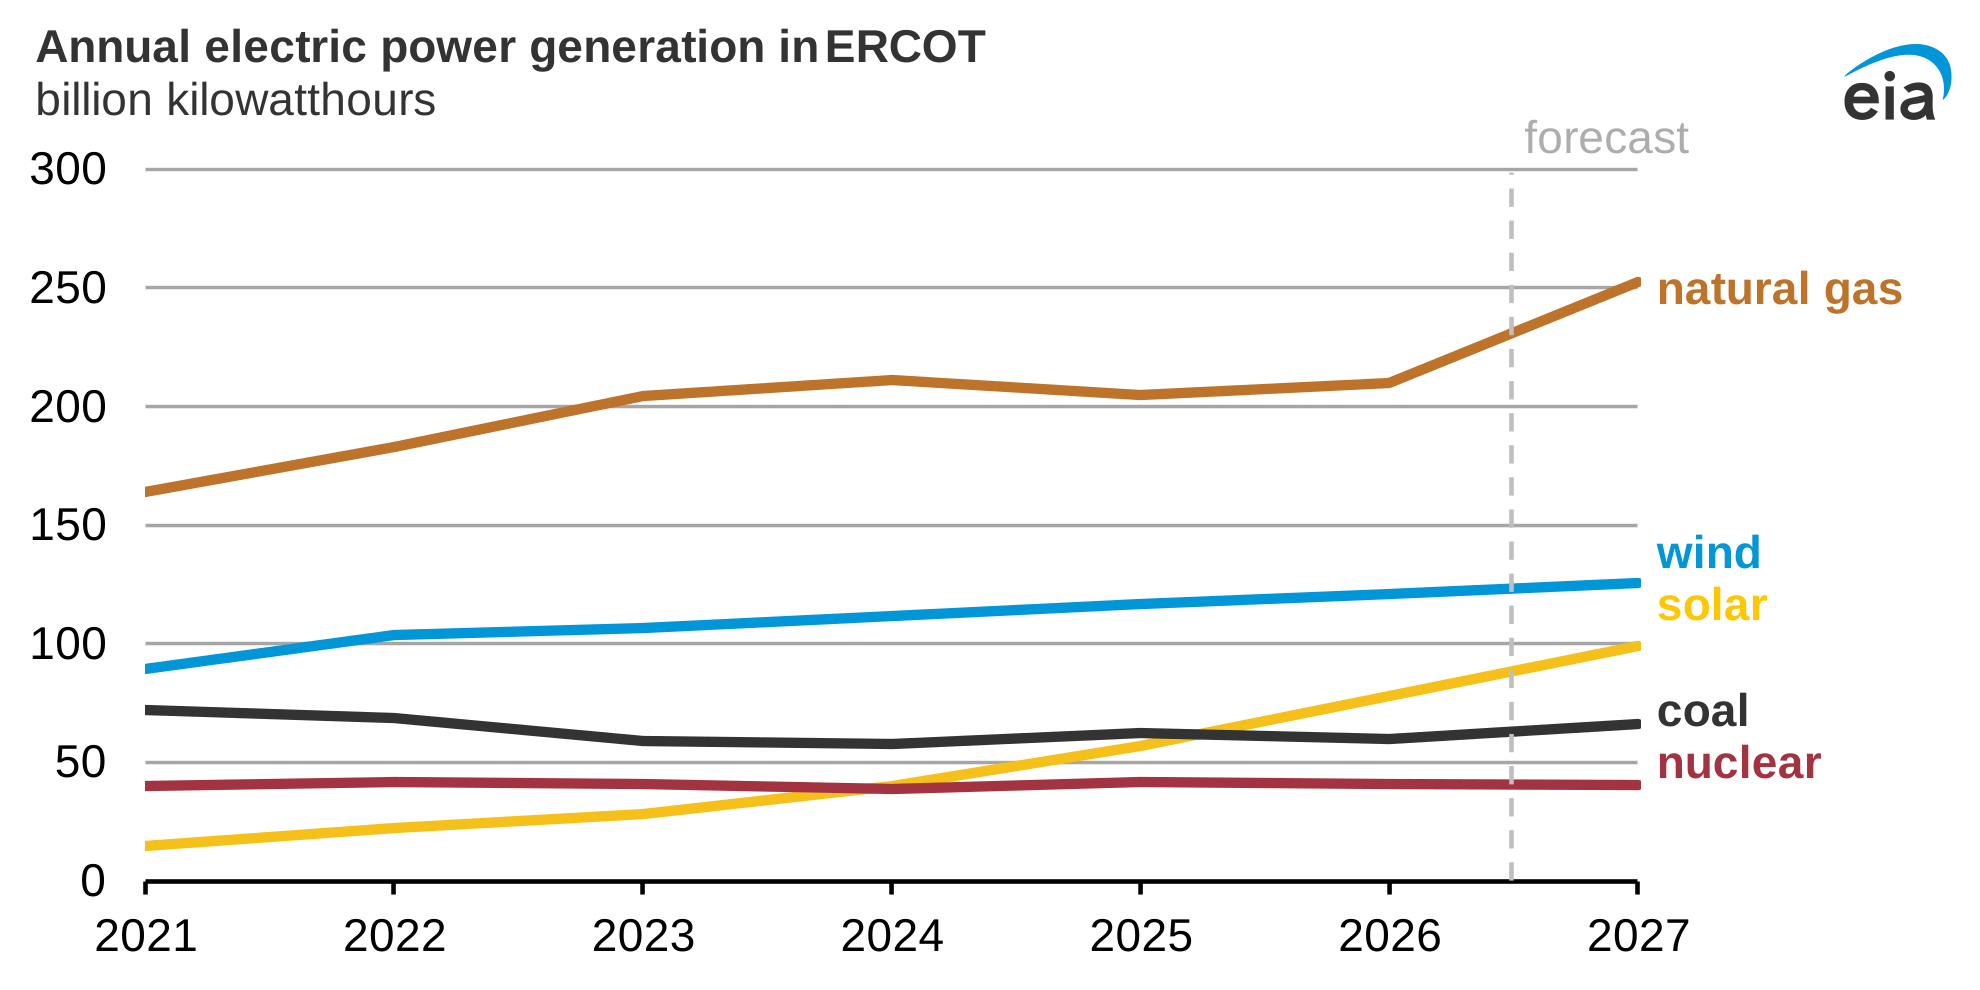
In our most recent Short-Term Energy Outlook (STEO), we forecast that annual electric power generation from utility-scale solar will surpass that from coal for the first time in 2026 within the electricity grid that covers most of Texas. Solar generation is expected to reach 78 billion kilowatthours (BkWh) in 2026 in the electricity grid operated by the Electric Reliability Council of Texas (ERCOT) compared with 60 BkWh for coal.
In-brief analysis
May 11, 2026
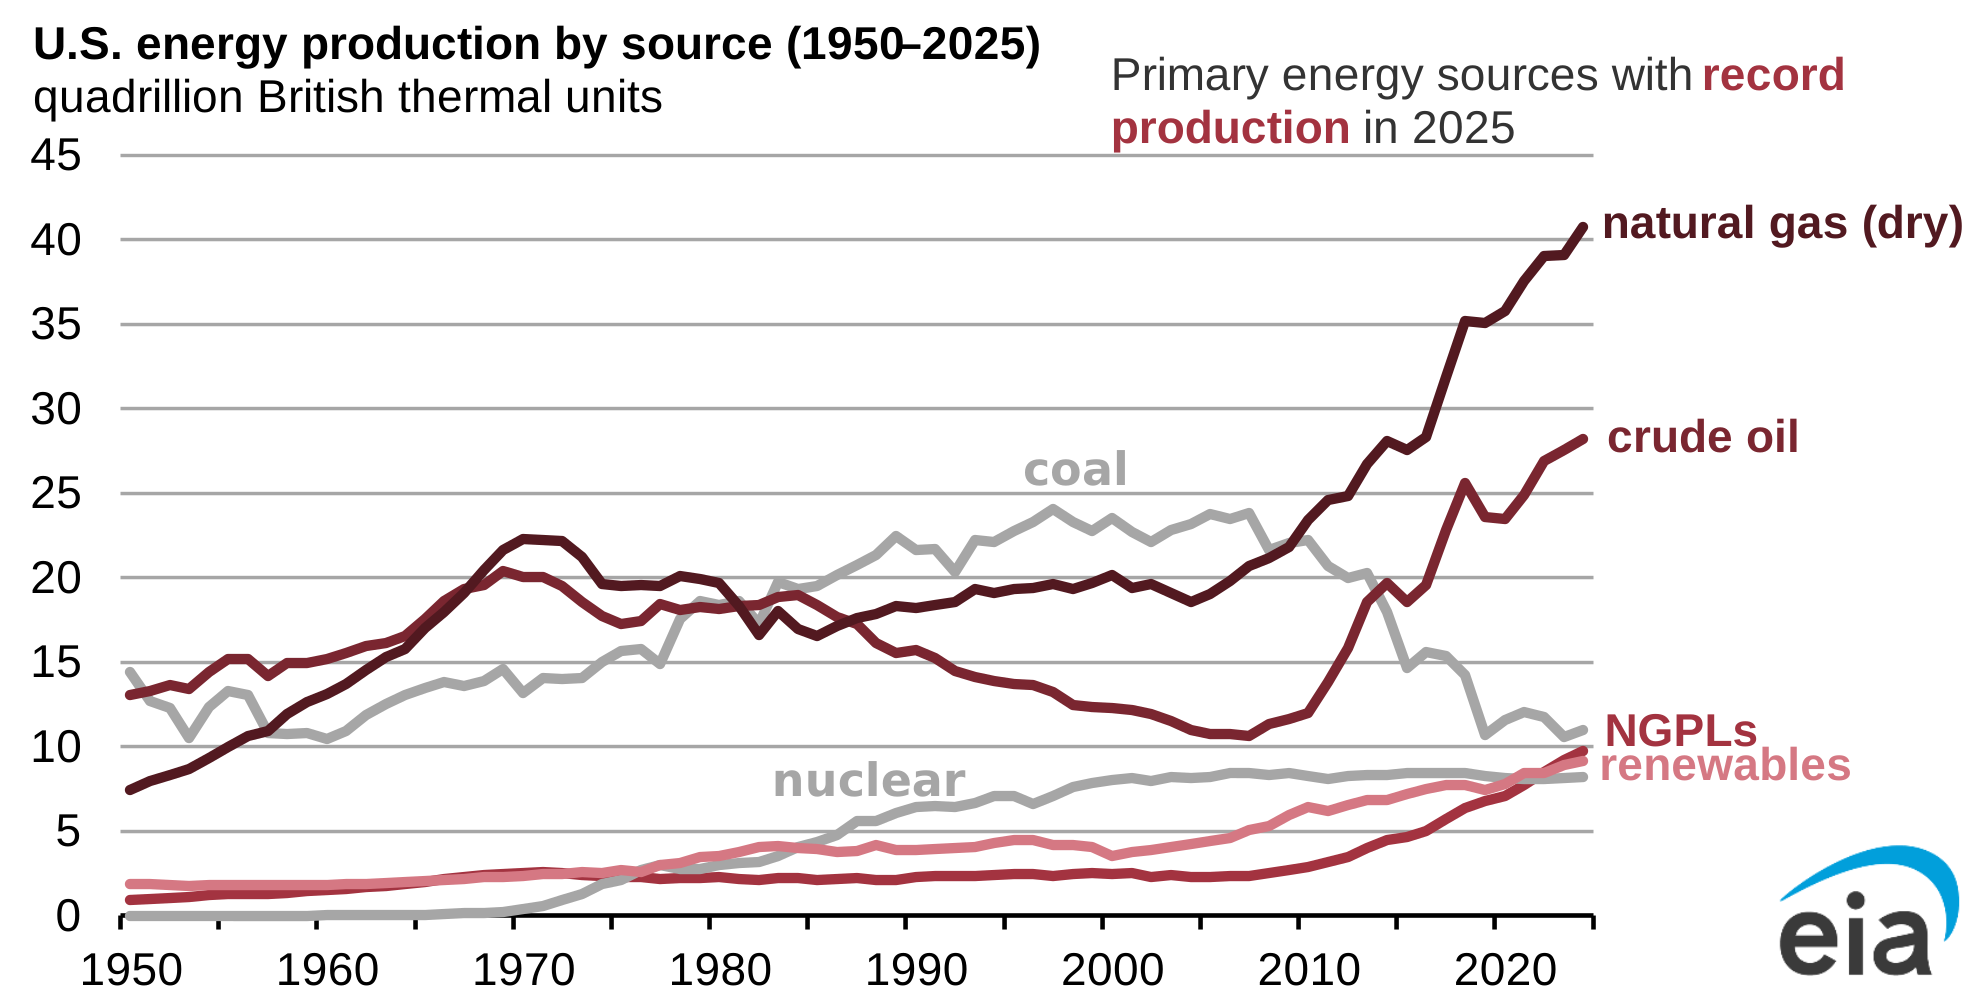
Total energy production in the United States increased to a new record of 107 quadrillion British thermal units (quads) in 2025, a 3.4% increase from the previous record set in 2024, according to new data in our Monthly Energy Review. Total production was driven by record-high production in natural gas, crude oil, natural gas plant liquids (NGPLs), and renewables. This was the fourth consecutive year in which the United States set a record for total energy production.
In-brief analysis
May 7, 2026
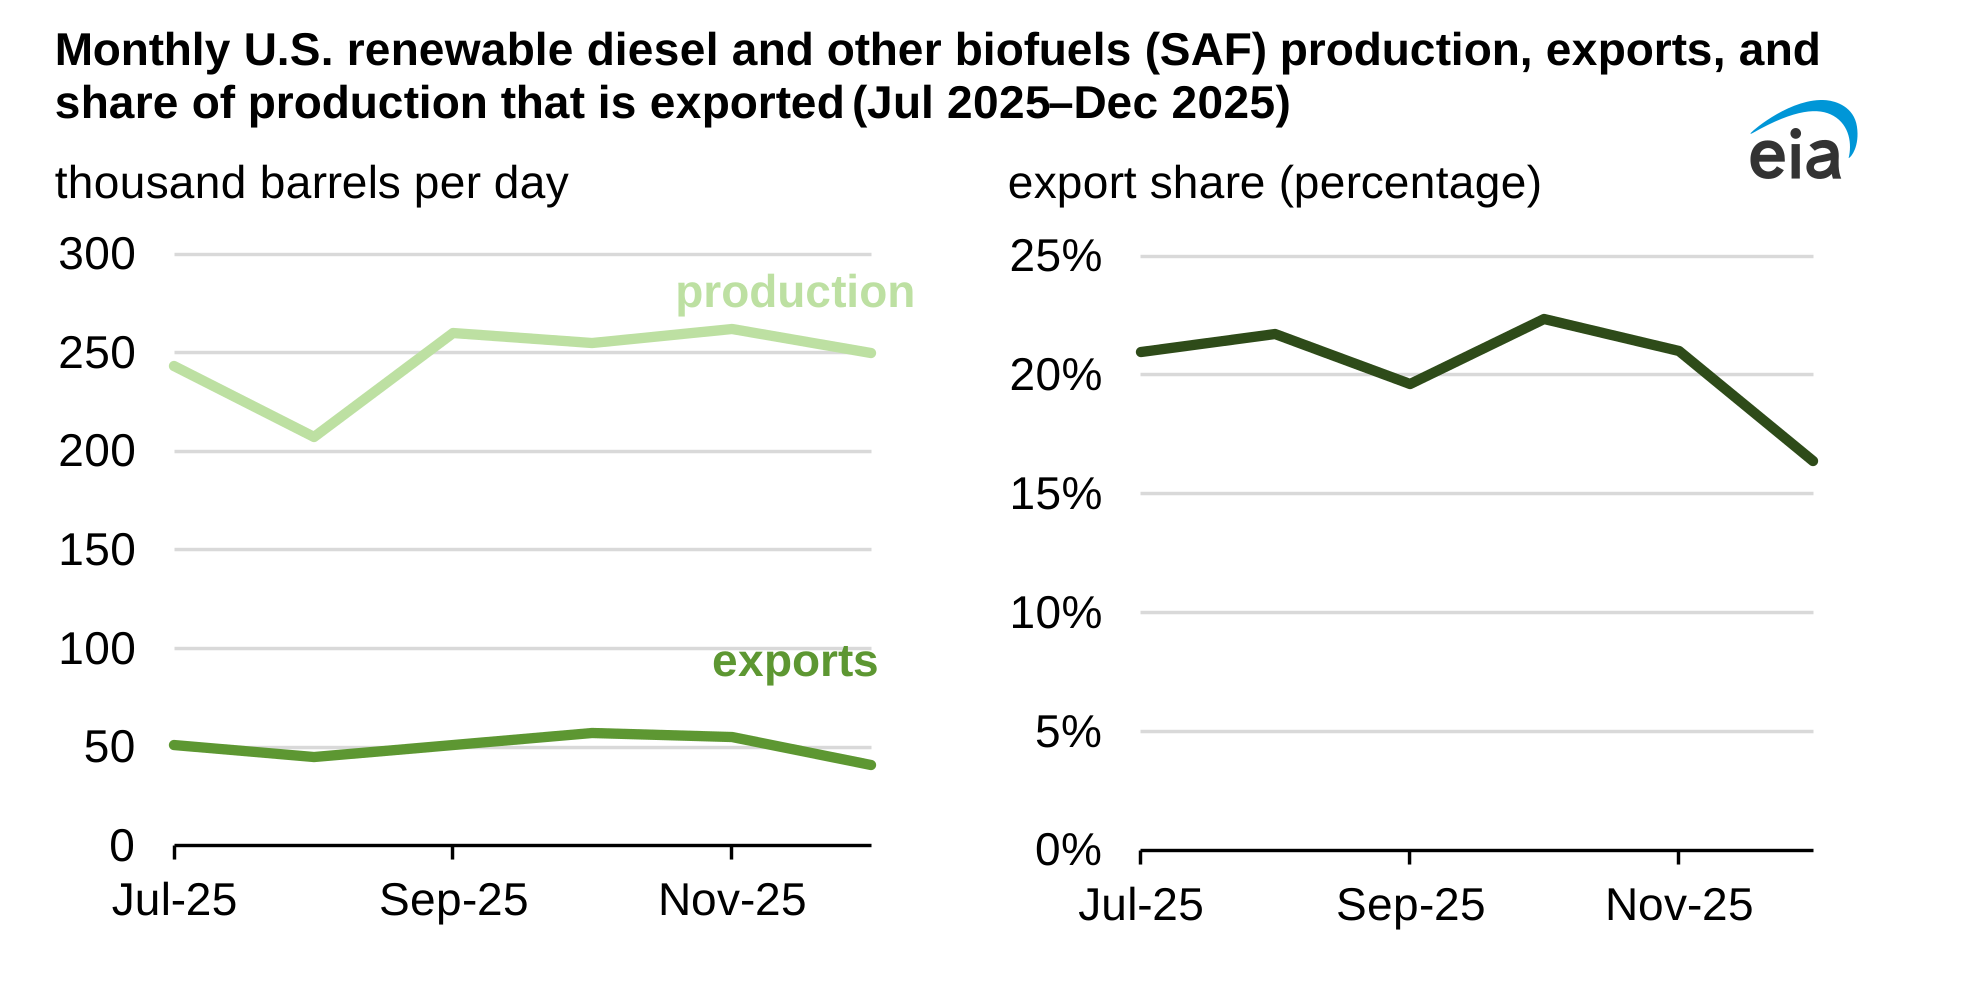
The United States exported nearly 50,000 barrels per day (b/d) of renewable diesel and other biofuels—a category which includes sustainable aviation fuel (SAF)—in the second half of 2025 (2H25), about 20% of the combined production for those fuels. About half of these exports went to Canada, with the rest mostly going to Europe.
In-brief analysis
May 5, 2026
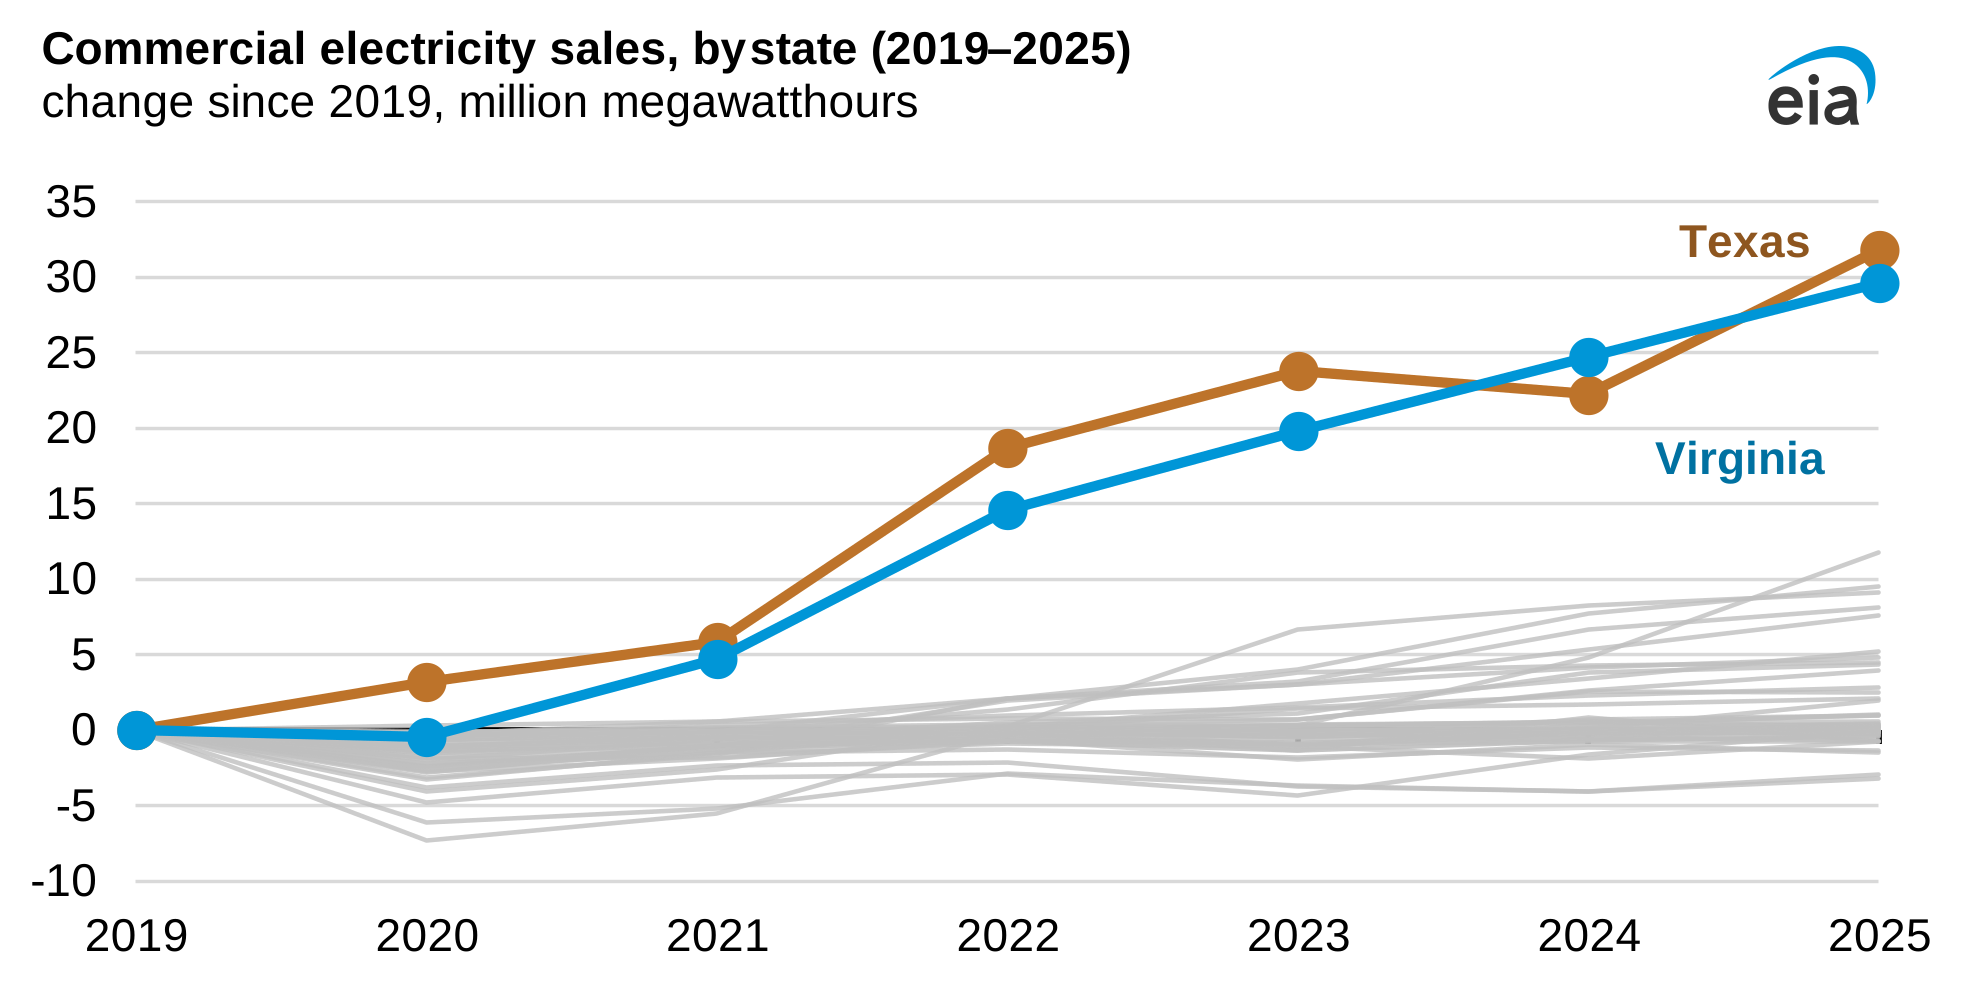
Data source: U.S. Energy Information Administration, EIA-861, Annual Electric Power Industry Report, October 2025, final data for 2019–24, and EIA-861M (formerly EIA-826), Monthly Electric Power Industry Report, February 2026, preliminary data for 2025
Commercial electricity sales in Virginia increased by nearly 30.0 million megawatthours (MWh) between 2019 and 2025, much faster growth than in any other state except Texas, a much larger state, according to our Annual Electric Power Industry Report. The growth in sales of electricity in Virginia is largely driven by a concentration of data centers, as well as electric vehicle adoption and building electrification.
In-brief analysis
May 4, 2026
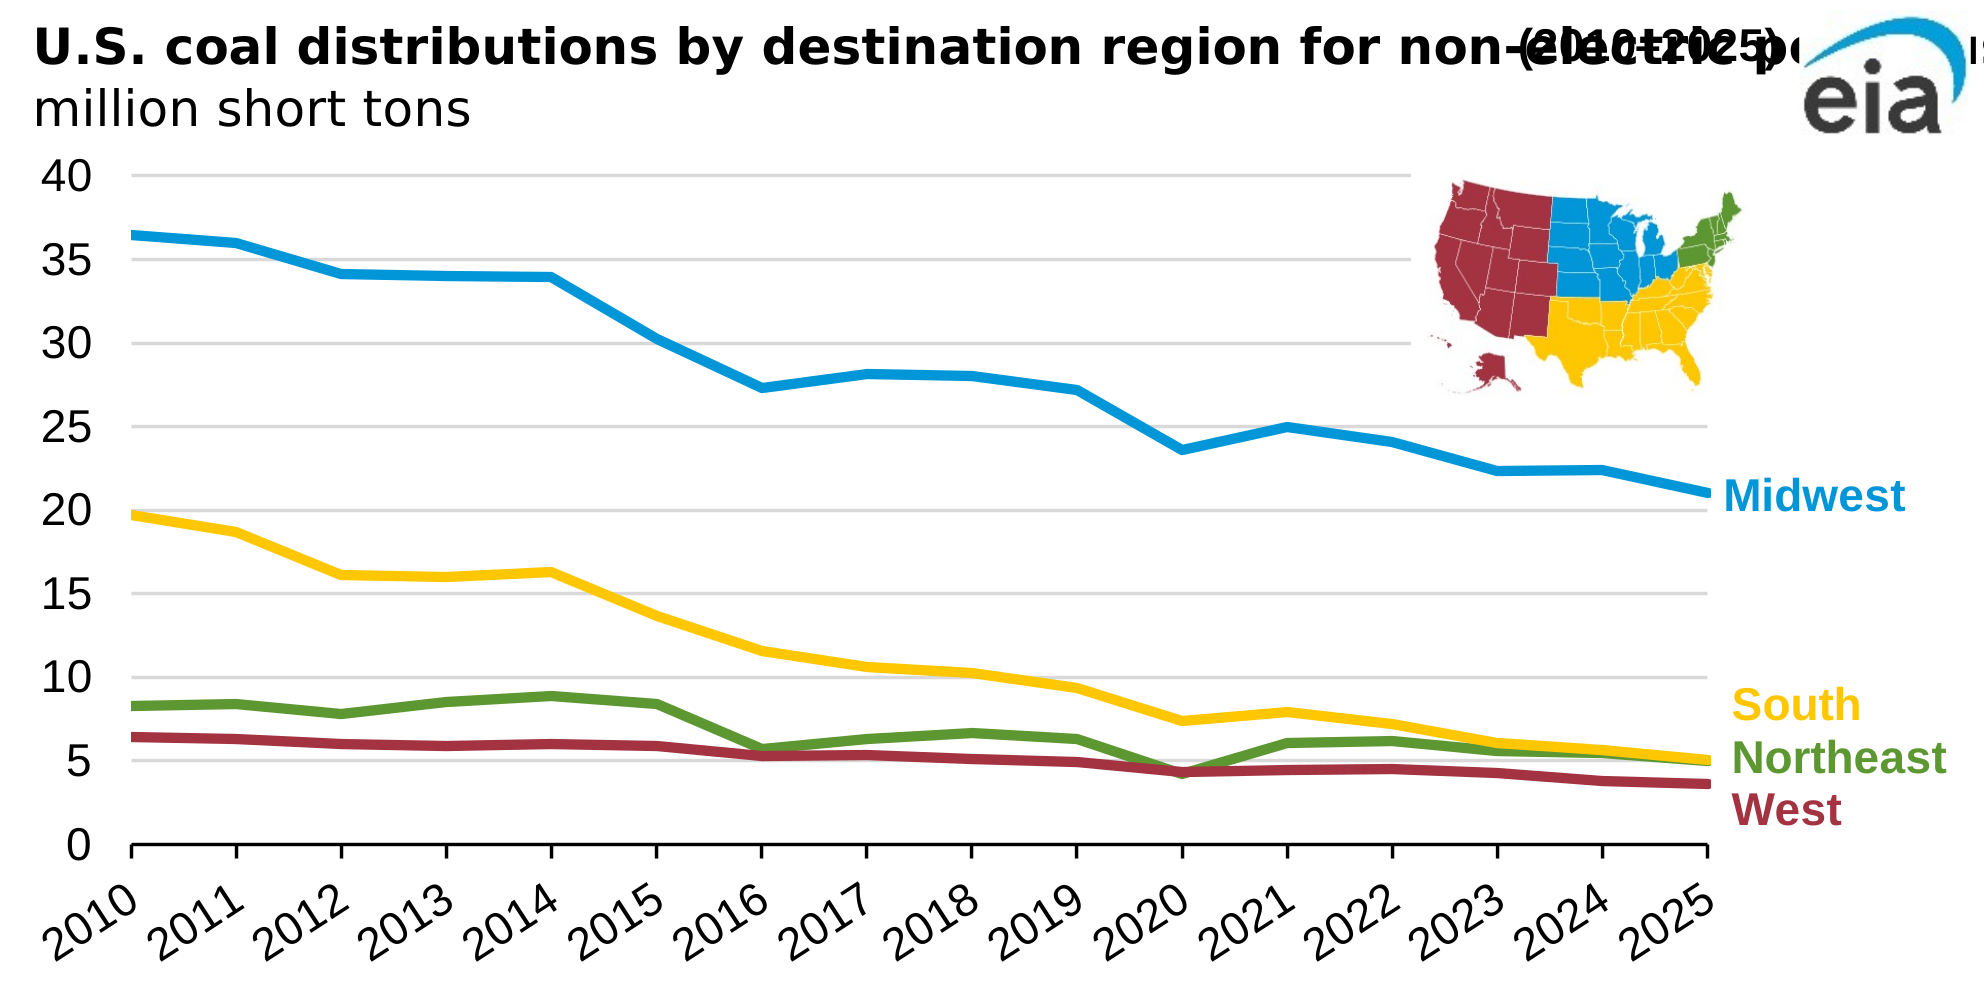
Data source: U.S. Energy Information Administration, Annual Coal Distribution Report and Quarterly Coal Distribution Report
Note: The 2025 data points are annualized using the four quarters of preliminary 2025 data from the Quarterly Coal Distribution Report. The Annual Coal Distribution Report provides detailed information about domestic coal distribution by, coal-origin state coal-destination state, consumer category, and method of transportation. It also summarizes foreign coal distribution by coal-producing state.
The volume of coal delivered in the United States for uses other than power generation—primarily, for manufacturing—decreased by about half in the last 15 years. Coal delivered for these purposes in the South decreased the most in percentage terms between 2010 and 2025, falling 75%, or 14.7 million short tons (MMst), according to our Annual Coal Distribution Report and Quarterly Coal Distribution Report. In 2010, the South received more than double the amount of coal received in the Northeast; by 2025 the two regions received about the same amount. Manufacturers’ increasing use of natural gas instead of coal and the closure of manufacturing plants using coal were major factors in this decline.
In-brief analysis
Apr 30, 2026
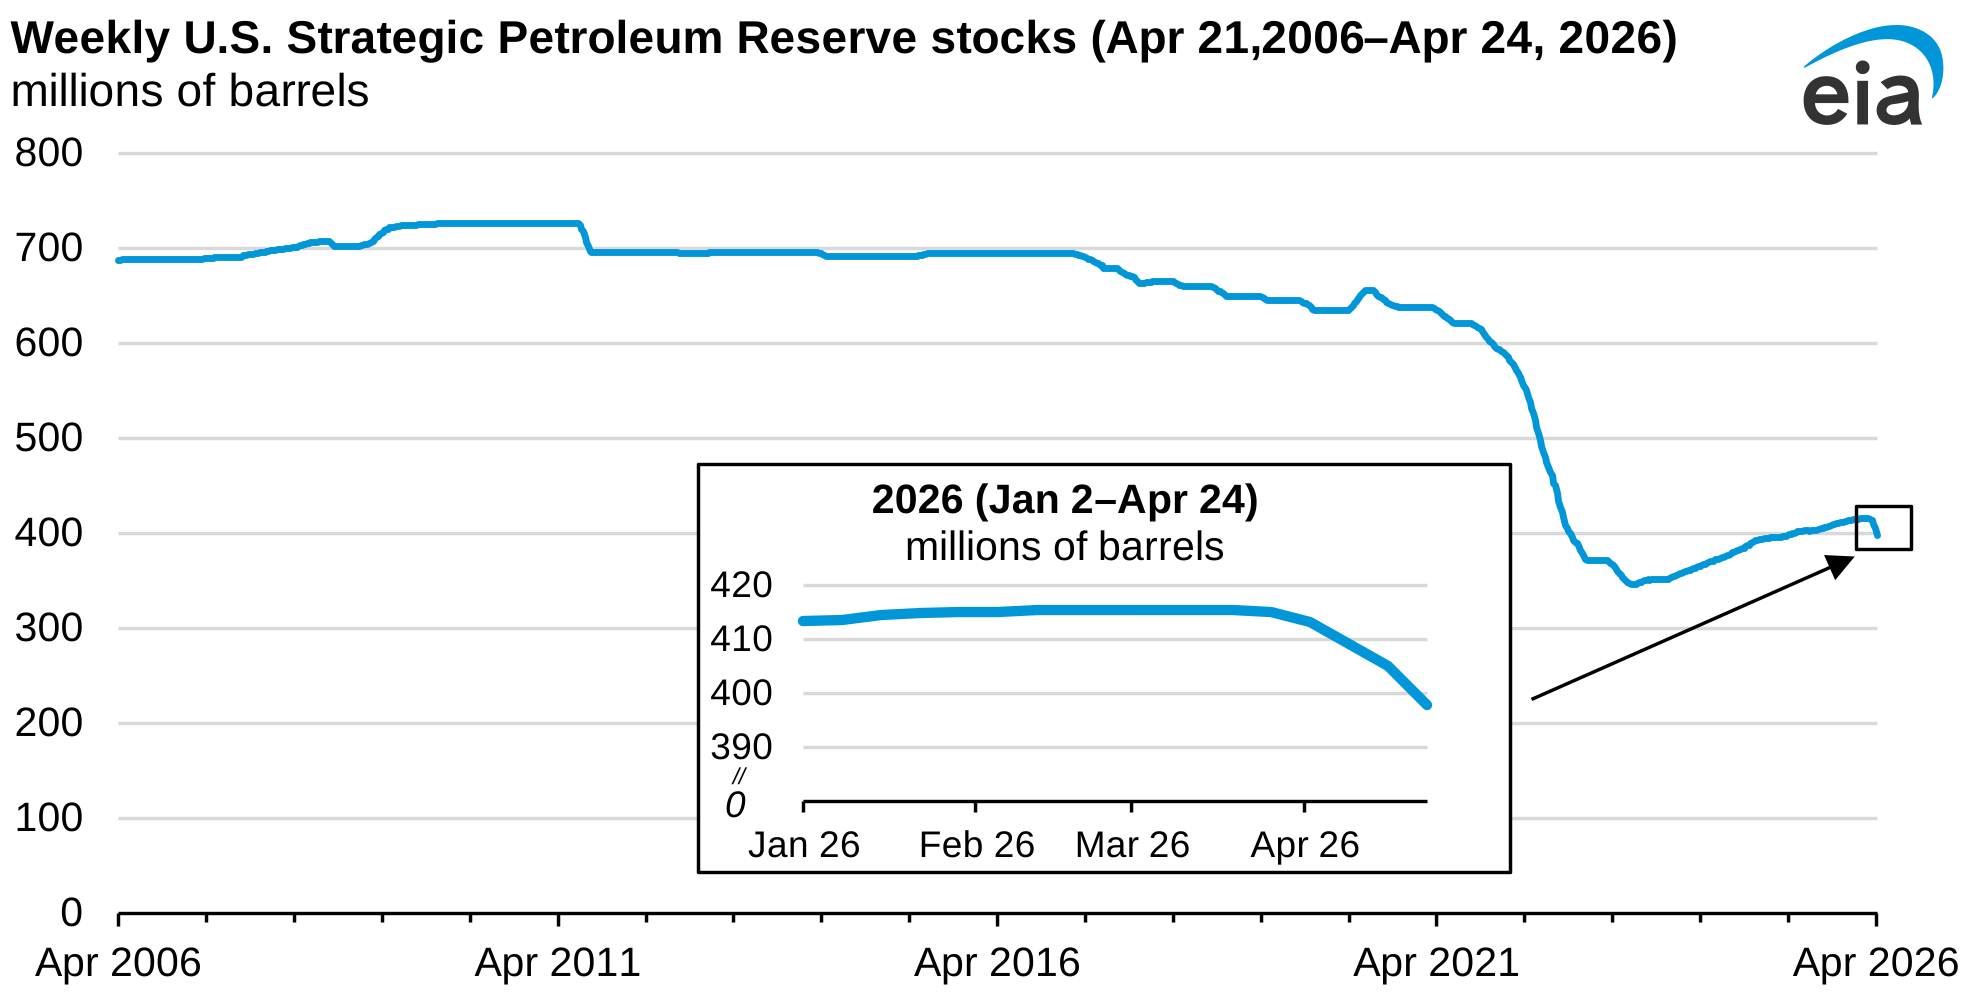
Between the week ending March 20 and the week ending April 24, the U.S. Department of Energy (DOE) released a total of 17.5 million barrels of crude oil from the U.S. Strategic Petroleum Reserve (SPR), according to data in our Weekly Petroleum Status Report. DOE released 7.1 million barrels in the week ending April 24, the most released since the week ending October 7, 2022. SPR stocks are currently 397.9 million barrels.
In-brief analysis
Apr 29, 2026
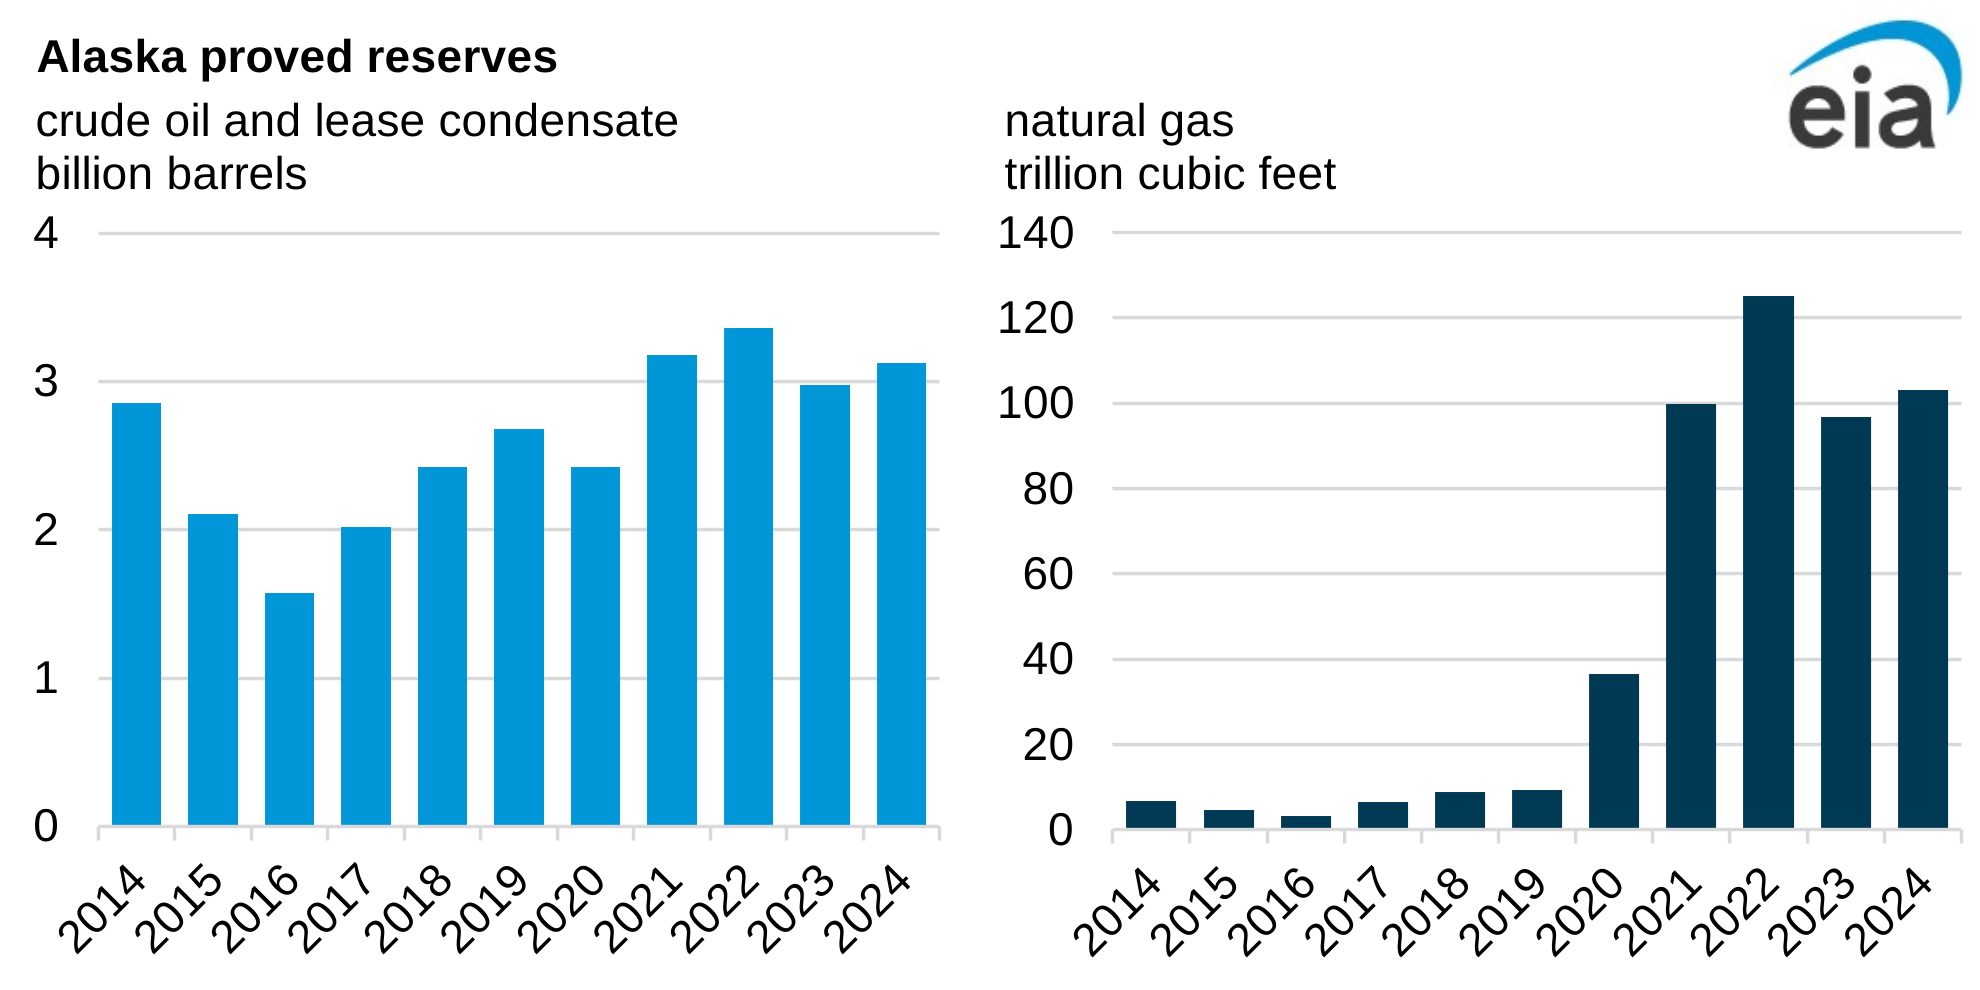
Oil and gas producers operating in Alaska reported increases in proved reserves in 2024 at a time when low prices triggered a decrease in nationwide proved reserves, according to our recently released U.S. Crude Oil and Natural Gas Proved Reserves, Year-End 2024 report. Alaska’s crude oil and lease condensate proved reserves increased 5%, and natural gas proved reserves increased nearly 7% in 2024.
In-brief analysis
Apr 28, 2026
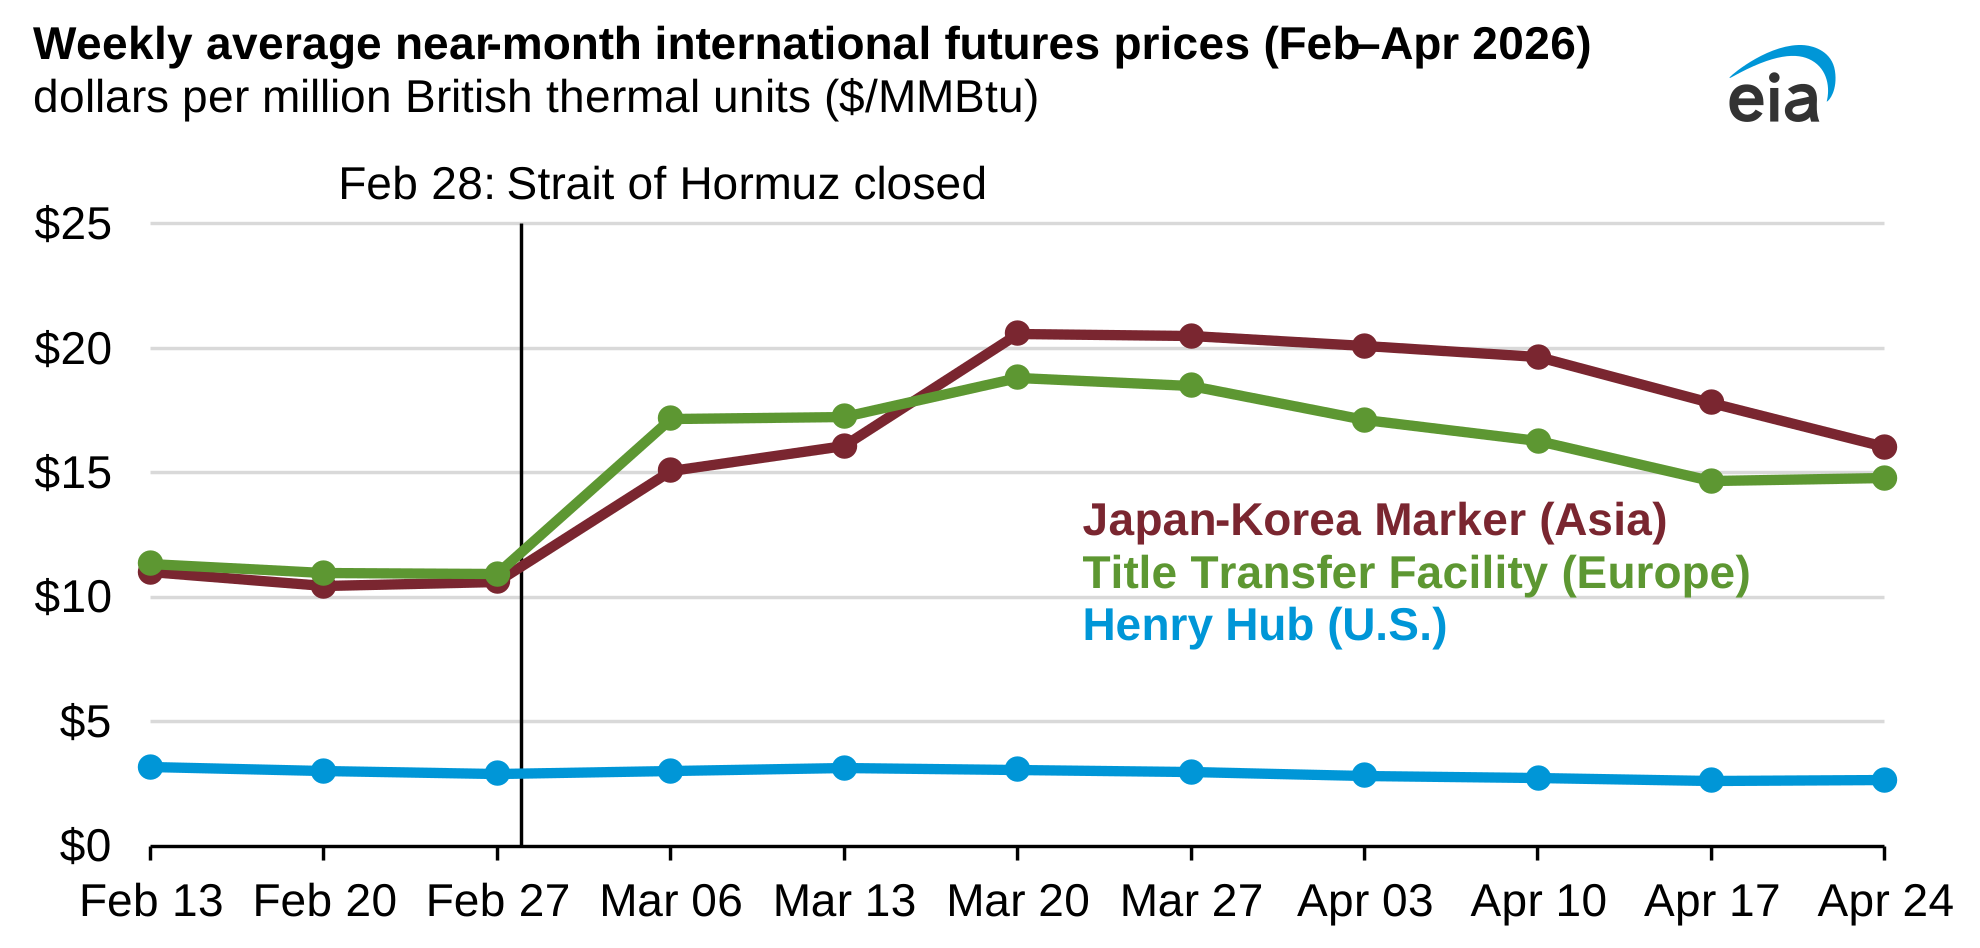
Data source: Bloomberg, L.P.
Note: Weekly average is for the week running Monday–Friday.
Prices for natural gas in Europe and Asia have diverged from those in the United States since the February 28 closure of the Strait of Hormuz.
In-depth analysis
Apr 27, 2026
This TIE was modified to address a correction in terminology and update a link.
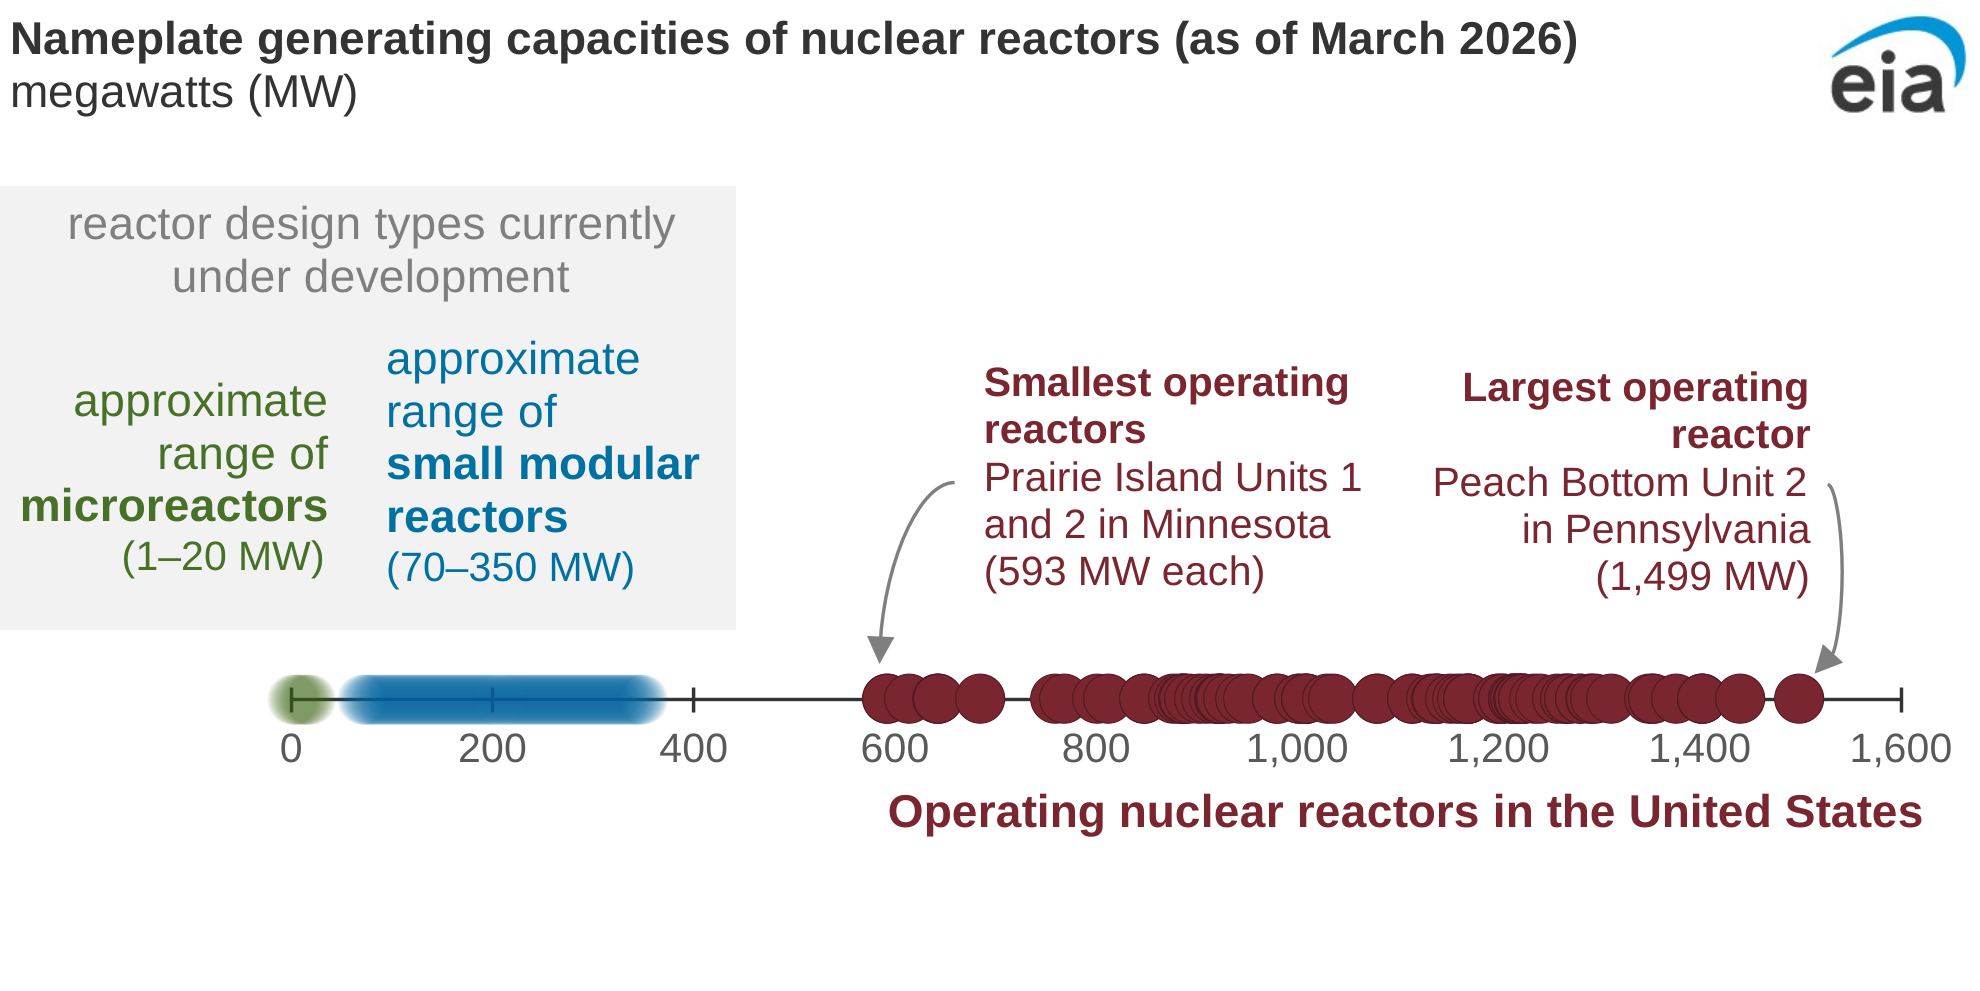
Electric utilities in the United States currently operate about 98 gigawatts (GW) of nuclear generating capacity, but very little nuclear capacity has been built in the last few decades. High capital costs and lengthy licensing and approval processes have limited the expansion of nuclear power. However, several companies are developing new small modular reactor (SMR) designs aimed at reducing capital costs and increasing siting flexibility, challenges associated with traditional nuclear power.
In-brief analysis
Apr 24, 2026
Data source: Intercontinental Exchange, Thomson Reuters
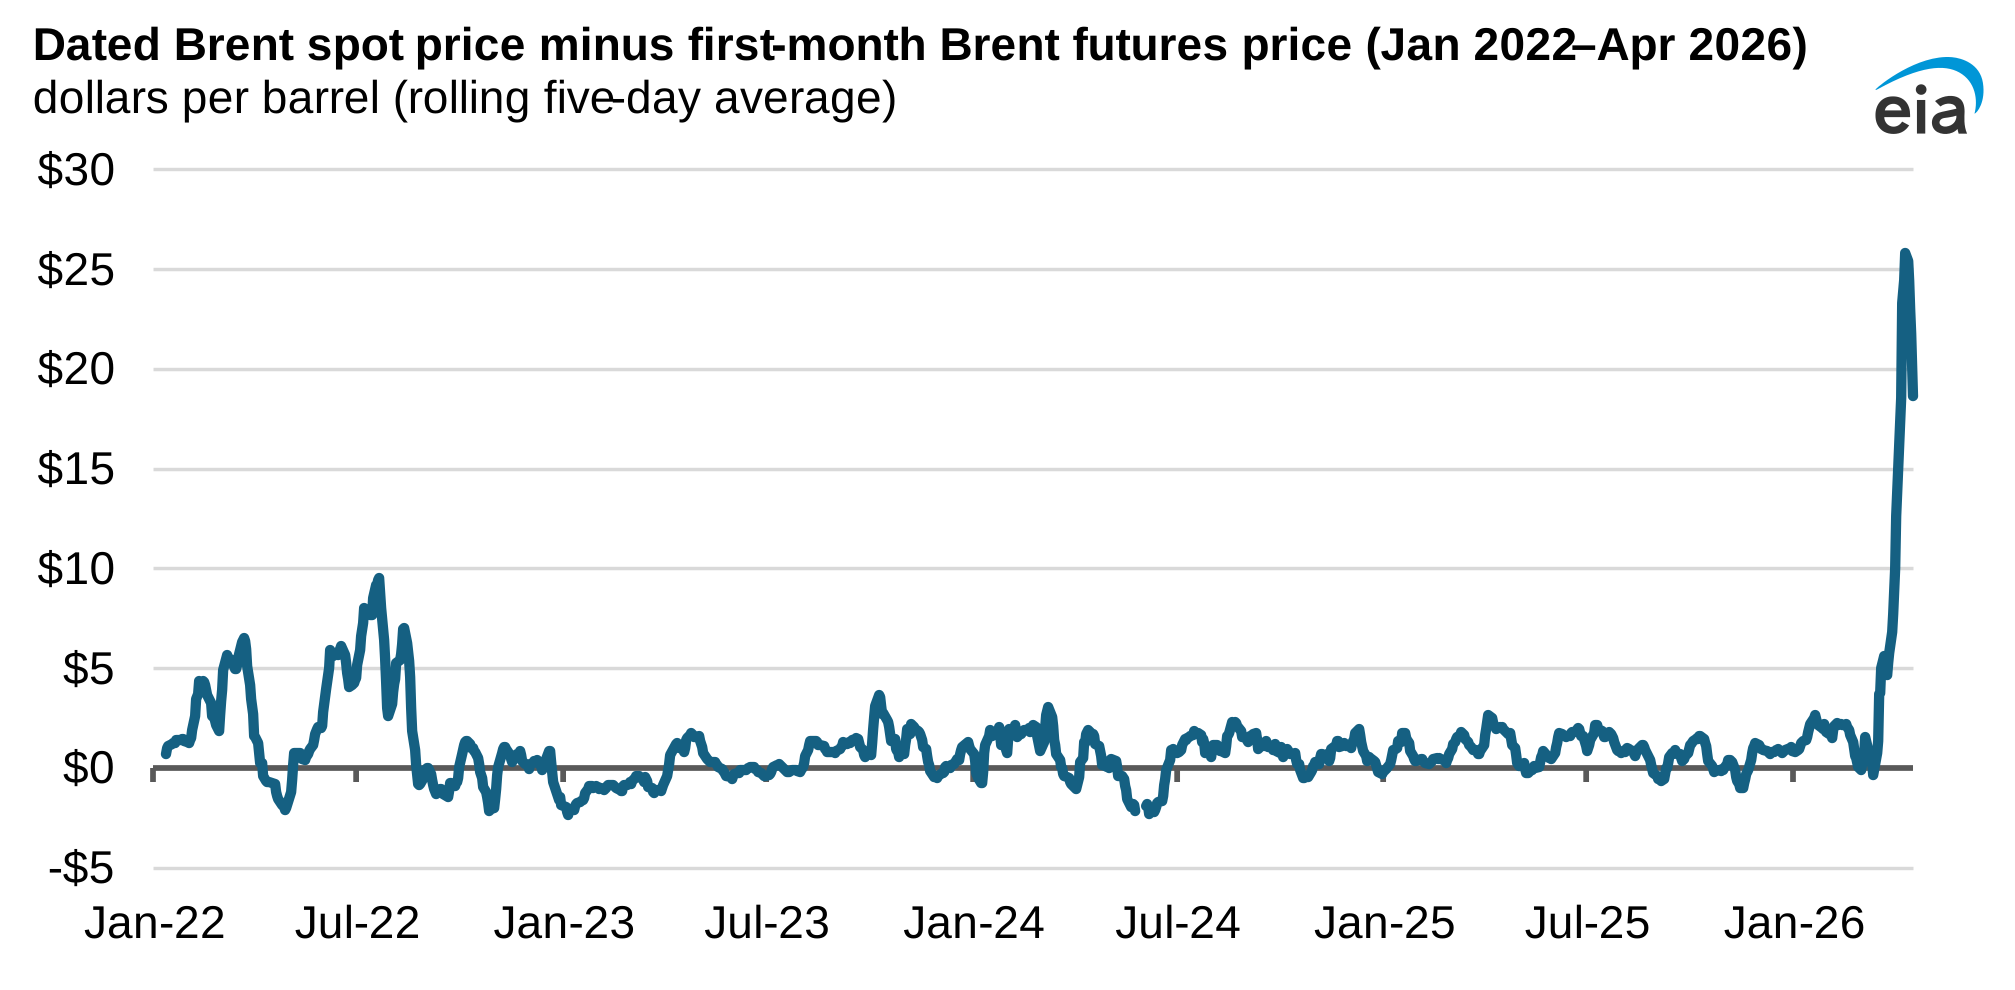
The Dated Brent spot price increased to a premium of more than $25 per barrel (b) compared with the front-month Brent futures contract in early April. Brent crude oil price benchmarks are widely used by commodities traders, financial market participants, economists, and others to assess changes in global petroleum prices more broadly.
In-brief analysis
Apr 23, 2026
The article has been changed to reflect Corpus Christi and Corpus Christi Liquefaction Stage 3 as one terminal, reflecting the co-location of these projects, although having different liquefaction train technologies.
Data source: U.S. Energy Information Administration, Liquefaction Capacity File; trade press
Note: Bcf/d=billion cubic feet per day; LNG=liquefied natural gas
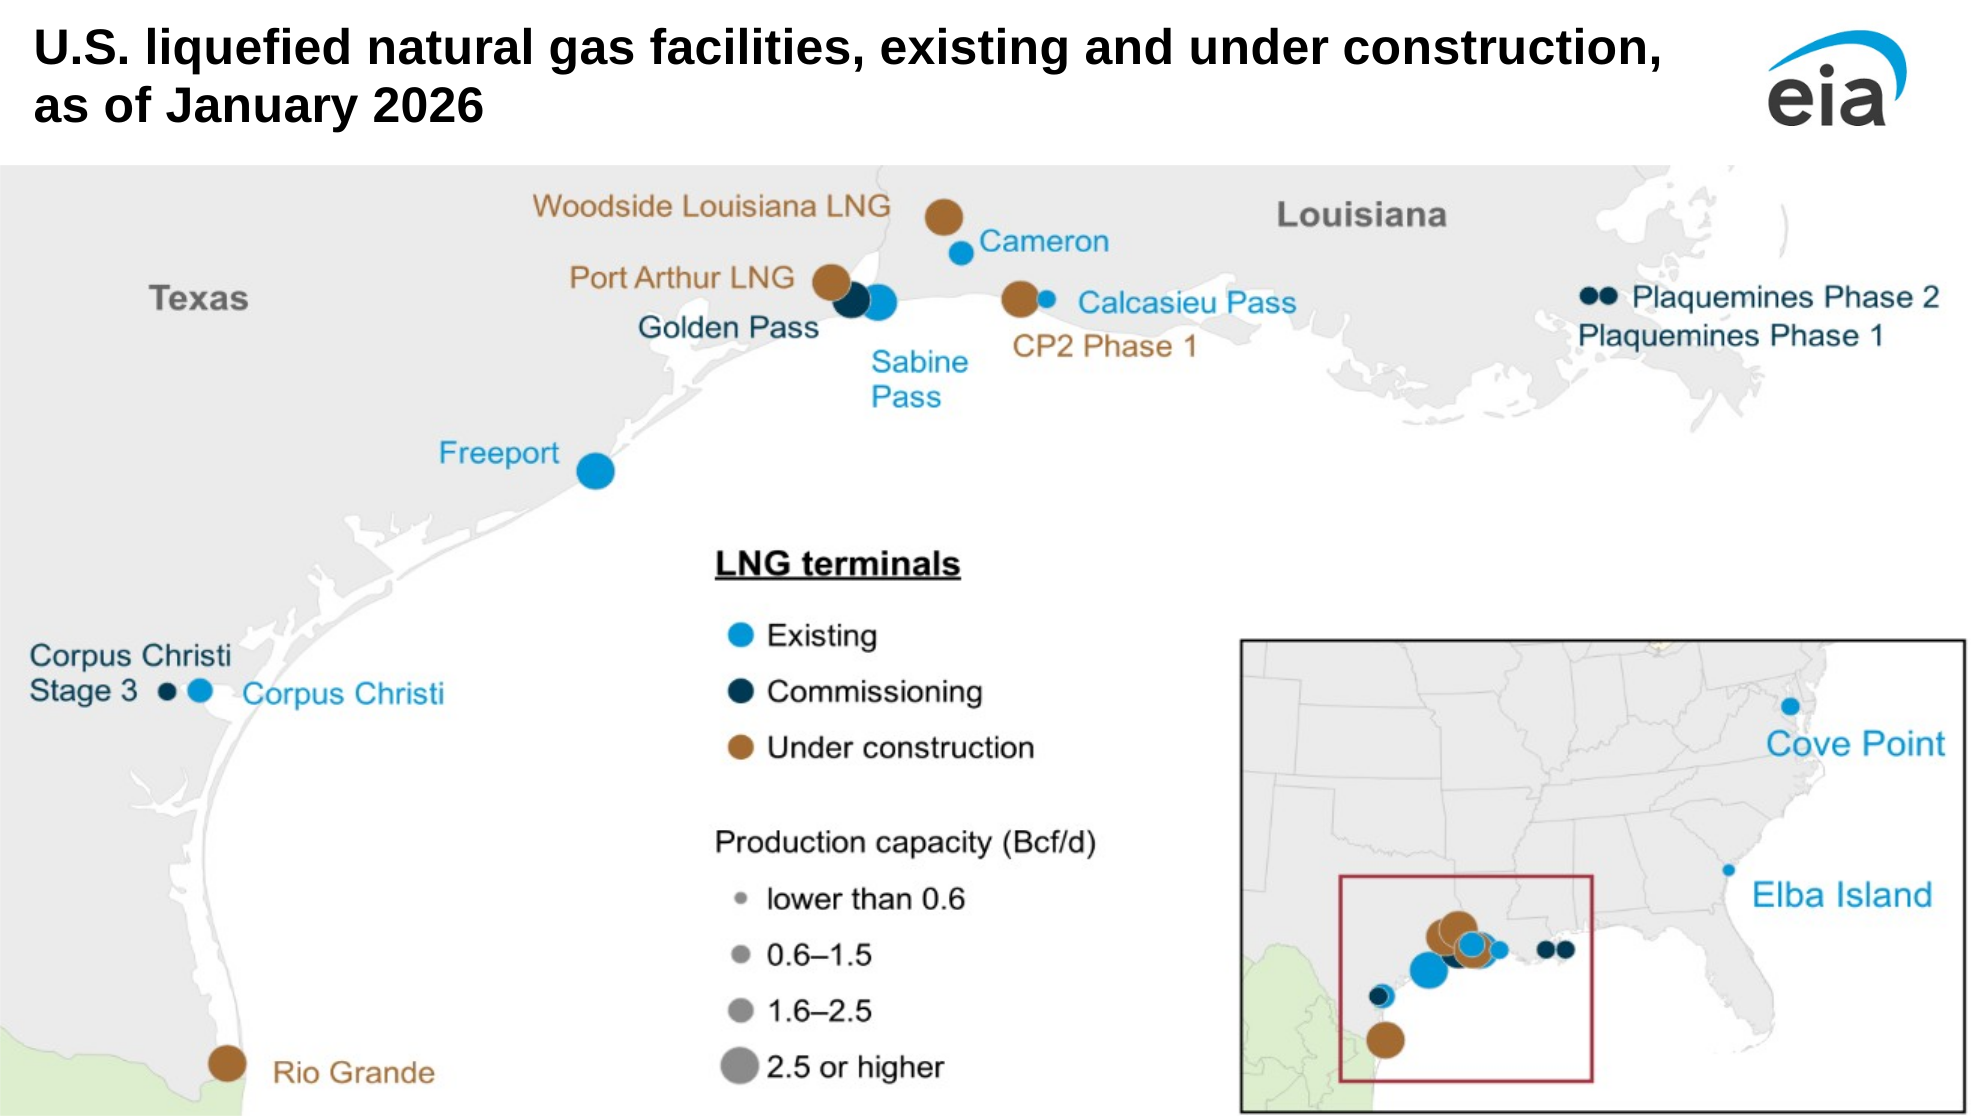
On April 22, 2026, Golden Pass LNG—the 9th liquefied natural gas (LNG) terminal in the United States—shipped its first cargo from Train 1, according to the project developer. The shipment left port 23 days after achieving first LNG production in March 2026. The terminal began shipping as geopolitical developments in the Strait of Hormuz have affected over 10 billion cubic feet per day (Bcf/d), or approximately 20%, of global supply. Golden Pass LNG is the only new U.S. LNG export terminal currently expected to begin LNG shipments in 2026.
In-brief analysis
Apr 21, 2026
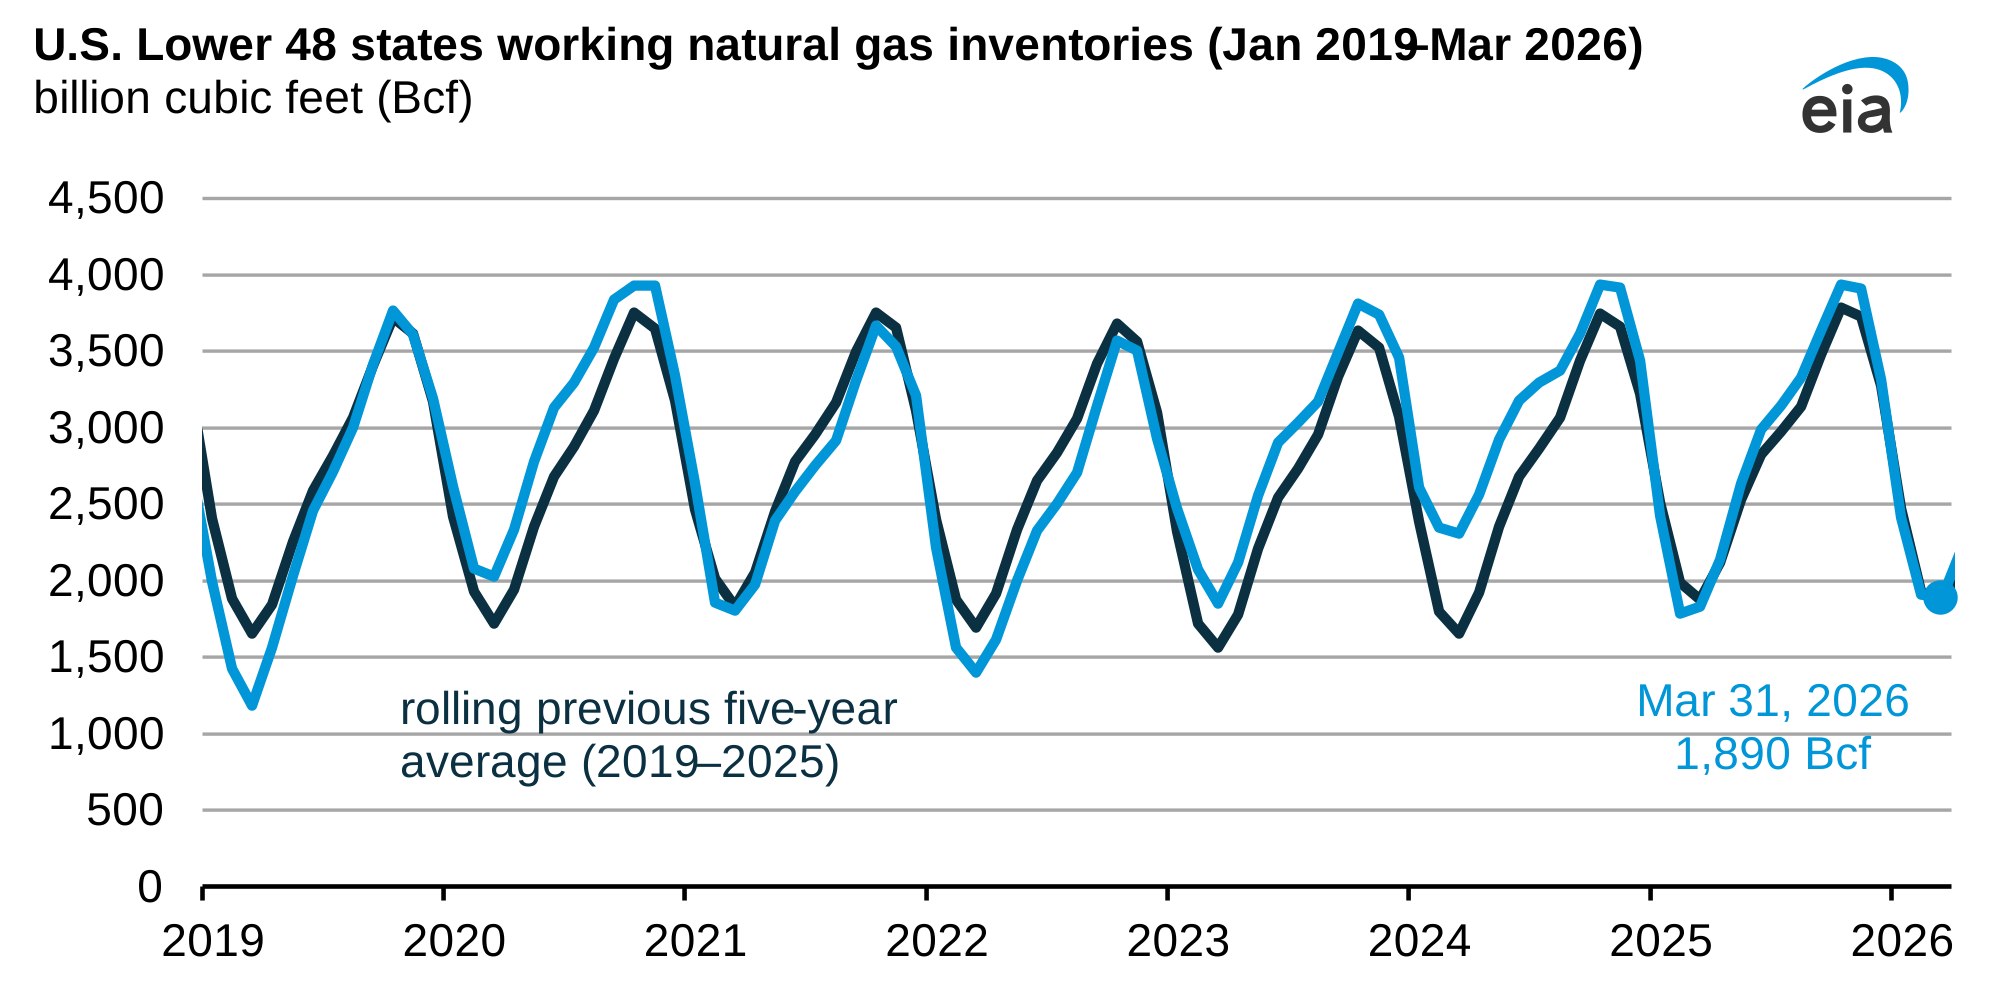
We estimate the Lower 48 U.S. states began this natural gas injection season (April–October) with 1,890 billion cubic feet (Bcf) of working natural gas in storage, based on interpolated data from our Weekly Natural Gas Storage Report. This level was 3% above the previous five-year (2021–25) average and 3% above last year’s end-of-season storage volume.