

To investigate the thermal tunability of the Si membrane metasurfaces, we first performed temperature-dependent optical characterization using a broadband mid-IR source integrated with the FTIR microscope and an electrically controlled heating stage, as illustrated in Fig. 1a. Our photonic device supports a sharp transmissive resonance, wherein a broad multipolar SLM interferes with a narrow q-BIC mode, achieved by oppositely tilting an aperture rod pair in a meta-unit (Fig. 1c). The arrayed tilted rods were patterned through 1 μm thick single-crystalline Si membranes by electron beam lithography and anisotropic dry etching, as detailed in the Methods section (Fig. 1b). Upon thermal stimulation, the intrinsic thermo-optical properties of crystalline Si facilitate controlled modulation of its complex refractive index35,36, introducing a pronounced spectral shift of the resonance peak, as depicted in Fig. 1d. By spectrally sweeping the transmissive resonance peaks across the fingerprint spectra, we detected the characteristic absorption bands of analytes, whether spatially separated from the metasurface in a non-contact configuration or directly interfaced for enhanced near-field interactions.
Fig. 1: Dynamically tunable Si membrane metasurfaces for mid-IR spectroscopy.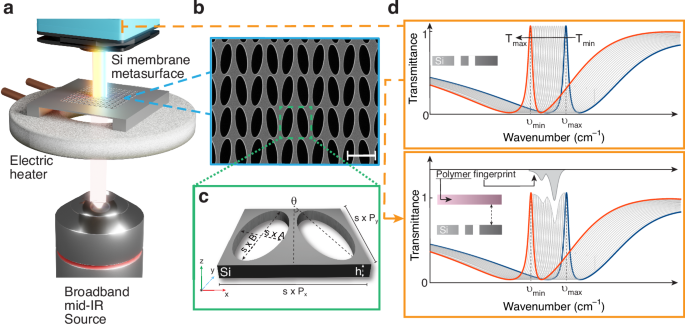 The alternative text for this image may have been generated using AI.
a Schematic of the optical characterization system in transmission mode, where a mid-IR source illuminates the metasurface placed on an electrically controlled heating stage and transmission spectra are collected as the temperature of the stage is varied, b Top-view SEM image of the fabricated Si membrane metasurface, illustrating the periodic perforations that form its lattice (scale bar = 5 μm), c Three-dimensional schematic of the meta-unit, highlighting the key geometric parameters, including the periodicities (Px, Py), membrane thickness (h), elliptical tilted rod apertures with major and minor axes (A, B), tilting angle (θ) and geometric scaling factor (s), d Temperature-dependent transmission spectra of the metasurface as a function of wavenumber (\({\boldsymbol{\nu }}\)). A continuous redshift in the resonance position is observed at a tuning rate of 0.06 cm−1 K−1, due to the temperature-dependent refractive index variation of the Si membranes. The dynamic resonance tunability enables the measurement of the characteristic fingerprints of the analytes, whether spatially separated from the metasurface in a non-contact configuration or directly interfaced for enhanced near-field interactions
To investigate the physical origins of the narrowband transmissive resonance, we employed finite-element simulations and eigenmode analysis. We first calculated the eigenfrequencies of a periodic array of single-elliptical-holes (monoatomic unit cell) along the \(\varGamma -X\) direction, in which a broad SLM and a high-Q guided mode coexist. Expanding the unit cell along x-direction to include two elliptical holes (diatomic unit cell) folds the Brillouin zone from Γ→X to Γ→X/2. The Brillouin zone folding (BZF) introduces a BIC mode near the SLM at the Γ-point, which was originally located at X in the monoatomic unit cell (see details in SI I.A). A schematic comparison of the Brillouin zones for the monoatomic and diatomic unit cells and the corresponding eigenfrequency dispersions are shown in Fig. 2a.
Fig. 2: Thermal tuning of q-BIC-CIT resonant modes-simulation results. The alternative text for this image may have been generated using AI.
a Brillouin-zone folding resulting from expansion of the unit cell from monoatomic to diatomic along the x-direction brings a mode from the X point to Γ, where it forms a bound state in the continuum in close proximity to the surface lattice mode. Eigenfrequency dispersion along Γ–X illustrates the folded mode, which evolves into a q-BIC under antisymmetric tilting of the elliptical apertures. Insets show the corresponding unit-cell geometries. On the right panel, Γ, X, Y, and M denote high-symmetry points of the reciprocal lattice (Brillouin zone) and are shown for schematic reference only. b The transmittance colormaps and the associated Q-factors show the overall effects of the temperature on the spectral shift and of the q-BIC-CIT modes supported by the Si membrane metasurfaces. c Numerically simulated transmittance spectra of the Si membrane metasurface with θ = 6° tilted elliptical rods supporting photonic analog of CIT resonances. Spectral resonance tuning was achieved by varying the metasurface temperature from 300 K to 700 K. d The electric (E)-field enhancement maps and displacement current density arrow profiles on a meta-unit surface show that the E-field enhancement profile remains the same for different temperatures. e The maximum E-field enhancement as a function of temperature. |E | / | E0| degrades at higher temperatures for all tilting rod angles, with a higher gradient at smaller tilting angles. f The resonance peak wavenumber shifts as a function of temperature, showing thermal tuning rates for each rod tilting angle. g The Q-factor of the resonance as a function of temperature
In our metasurface design, the unit cell becomes diatomic, and BZF occurs intrinsically when neighboring elliptical apertures are oppositely tilted. Moreover, the in-plane symmetry breaking converts the BZF-BIC into a q-BIC mode, enabling far-field access. At the design phase, we also investigated alternative perturbation schemes that can potentially support BZF-induced q-BIC modes in membrane metasurfaces; however, none of these approaches were as effective as our rod tilting approach (see details in SI I.B and Fig. S2).
Contrary to previously reported q-BIC modes12,13,14, our metasurface design supports a transmissive resonance. We investigated this unique photonic phenomenon using numerical simulations and the temporal coupled mode theory as detailed in SI I.C. and SI II. We first identified that the high-Q transmissive mode is a coupling-induced transparency (CIT) because it emerges when the q-BIC mode couples to the SLM mode upon spectral and spatial overlap. To further investigate the effect of spectral proximity between the SLM and the q-BIC on the CIT, we varied the unit cell period (Px), which spectrally shifts SLM and q-BIC modes at different rates (see details in SI I.C. and Fig. S3). Our results showed that the q-BIC-CIT mode gets distorted as the SLM and q-BIC modes spectrally separate, indicating the mode coupling effect. Moreover, when the simulated spectra were fitted to the CIT model derived based on the temporal coupled mode theory, we observed a strong agreement (see details in SI II.D. and Fig. S4).
To analyze the effects of thermal tuning on the q-BIC-CIT mode, we first performed numerical simulations using the temperature-dependent complex refractive index of Si35,36,37. Figure 2b shows transmittance maps as a function of rod tilting angle (θ = 0°–10°) at 300 K and 700 K. The filled circles in the plots mark the eigenmodes of the q-BIC, which align well with the CIT peak positions. The filling color of the circles indicates the Q-factor of the mode, which decreases with increasing tilt angle, \(\theta\), at both temperatures. The q-BIC-CIT mode properties are highly dependent on the geometric design parameters, where the tilt angle, \(\theta\), primarily controls radiative leakage, and thus the resonance amplitude and Q-factor, and the symmetry-preserving parameters (membrane thickness h, lattice periodicities Px, Py, and aperture dimensions a, b) tune the resonance wavelength and the mode coupling (see details in SI IV and Fig. S6).
Figure 2c shows simulated transmission spectra as the temperature varies from 300 K (room temperature, RT) to 700 K in 50 K increments for tilt angle θ = 6°. A total spectral shift of 25.6 cm−1, greater than the full width at half maximum (FWHM) of the resonance (11.4 cm−1), was achieved with a temperature difference of 400 K. In the elevated temperature range, the transmittance of the membrane metasurface exhibited a reduction (9% at 700 K compared to RT) due to the increased material losses. To elucidate the impact of temperature on the q-BIC-CIT resonance characteristics of the membrane metasurfaces, we plotted the electric (E) field enhancement and displacement current profiles for the minimum (300 K) and maximum (700 K) measured temperatures at the resonance. Figure 2d shows that the E-field enhancement (Eenh = |E | / | E0 | ) maintains a consistent profile at varying temperatures, with hotspots emerging at the tips of the elliptical apertures. The robustness of the q-BIC-CIT mechanism at elevated temperatures is further confirmed by the consistent phase response of the mode observed at varying temperatures (details in SI V and Fig.S7).
To further quantify the temperature-dependent q-BIC-CIT mode properties, we plotted the E-field enhancement, peak wavenumber, and Q-factor as a function of temperature for different rod tilting angles (θ = 2°, 4°, 6°, and 8°) in Fig. 2e, f, and g, respectively. The Eenh and Q-factor are higher for smaller rod tilting angles across the entire temperature range, a characteristic of q-BIC modes38,39,40. At high temperatures (T > 550 K), Eenh and Q-factor decrease consistently for all θ values, with a higher gradient for smaller θ. We provide a detailed quantitative analysis of temperature-dependent E-field enhancement in SI VII and Table S2. Moreover, to investigate the relative contributions of radiative and non-radiative damping to Q-factor reduction, we decomposed the temperature-dependent loss channels (see SI VI and Fig. S8). The results indicate that the reduction of the Q-factor at elevated temperatures is dominated by an increase in non-radiative damping, while the radiative loss channel remains comparatively insensitive to temperature and primarily controlled by the rod tilting angle. In addition, silicon oxidation in this temperature regime remains self-limiting and induces only a negligible resonance shift without measurably affecting the Q-factor (see SI VIII and Fig. S9).
As the temperature increases, a clear redshift in the resonance position is observed for all metasurface designs (Fig. 2f). The highest thermal resonance tunability rate was calculated to be 0.064 cm−1 K−1, for a rod tilting angle of θ = 2°.
Next, we measured the temperature-dependent resonance characteristics of fabricated Si membrane metasurfaces with varying rod tilting angles and compared them with the simulation results. Figure 3a shows the mid-IR transmittance spectra obtained from the unpatterned Si membranes for reference and fabricated metasurfaces with rod tilting angles θ = 6° and 0°. At θ = 6°, a temperature-tuned q-BIC-CIT mode is observed; however, at θ = 0° only the SLM is present as the q-BIC vanishes to BIC and the transparency window disappears. Figure 3b illustrates that all measured metasurfaces with varying rod tilting angles exhibit a consistent linear shift in their resonances across the examined temperature range (300–700 K). In strong agreement with the simulation results, the high-Q metasurface (θ = 2°) demonstrates the highest tunability rate at 0.06 cm−1 K−1, while the tunability rate of the SLM (θ = 0°) is 0.051 cm−1 K−1. We also tested the robustness of the temperature-dependent resonance response, finding that the temperature-induced resonance shift is identical in the heating and cooling cycles, and the spectral response does not significantly degrade after repeated (n = 20) thermal cycles (see details in SI IX and Fig. S10).
Fig. 3: Experimentally measured thermal tuning effects on the photonic q-BIC-CIT modes. The alternative text for this image may have been generated using AI.
a Temperature tunability characteristics of the Si membrane metasurfaces with θ = 6° (yellow lines) showing q-BIC-CIT mode and θ = 0° (violet lines) showing SLM, where q-BIC vanishes to BIC, both red shifting as the real part of the refractive index increases with increasing temperature. Black lines show transmission through the unpatterned membrane. b Measured resonance peak wavenumber as a function of temperature for different tilted rod angles. For all angles, the measured thermal tuning rate is Δv/ΔT ≈−0.05 cm−1 K-1. c Evolution of Q-factor as a function of rod tilting angle θ for simulation and experimental data, showing inverse quadratic correlation (Q-factor∝ θ−2) for different temperatures. d Wide-field IR microscope images of the UW-Madison mascot, Bucky Badger, patterned metasurface, measured by illuminating at 1430 cm−1 at 300 K and 500 K temperatures (Scale bar = 250 μm). As the temperature increases, the resonance peak shifts to lower wavenumbers, leading to a contrast inversion, as also indicated on the FTIR measured transmittance spectra. A similar contrast inversion effect is shown on a different uniformly patterned metasurface, where the bright to dark transition occurs at 1498 cm−1 as temperature increases (Scale bar = 100 μm)
Figure 3c shows the experimentally derived Q-factors from metasurfaces with varying rod tilting angles at the lowest (300 K) and highest (700 K) measured temperatures. The inverse quadratic relationship of the Q-factor with the asymmetry parameter (θ) indicates the q-BIC nature of the measured resonances at both temperatures41. Notably, at elevated temperatures (T > 550 K), we observed a more pronounced reduction in mode amplitudes and Q-factors in experimental spectra when compared with the simulation results. Our further investigation revealed that the standard simulation workflow fails to capture the resonantly enhanced light–matter interactions inside the silicon slab. Therefore, as the membrane temperature increases, absorption pathways in c-Si become more pronounced due to the resonant metasurface. Thus, the effective absorption scales with the local field intensity, as we discuss and demonstrate in SI X and Fig. S11.
To visualize the dynamic resonance tunability characteristics, in Fig. 3d, we show the mid-IR microscope images of a partially patterned metasurface in the shape of Bucky Badger, UW-Madison’s mascot. The Bucky metasurface images were captured at 1430 cm−1 illumination in transmission mode at two different temperatures (300 K and 500 K). Due to a dynamic redshift in the resonance peak upon temperature increase, metasurface patterned regions become more transmissive at the same illumination wavenumber (1430 cm−1) revealing a dark-to-bright contrast transition. This effect is also depicted in the transmittance spectra measured at the indicated red and blue star positions of the images at 300 K and 500 K. With only a 200 K temperature increase, a notable transmittance boost from 0.23 to 0.39 (68.2%) was measured. We also show an opposite bright-to-dark transition by probing the resonance peak of a uniformly patterned metasurface area of 400 µm × 400 µm at 1498 cm−1, which exhibits a 58.7% decrease in transmittance as a result of a 200 K temperature increase (illustrated in the lower segment of Fig. 3d).
We leveraged the temperature tunability of the Si membrane metasurfaces as dynamic narrow-band mid-IR filters to demonstrate non-contact chemical analysis of polymer films. Figure 4a depicts the transmission-mode optical imaging configuration, wherein the spectral responses of an array of metasurfaces were characterized while modulating the substrate temperature. An example of this chemical analysis is shown in Fig. 4b, where we employed an array of six metasurfaces with predetermined resonance wavenumbers assigned during fabrication. When a polymer film specimen is inserted into the optical path, the characteristic vibrational absorption signatures of the molecular constituents induce distinct transmission intensity variations across the metasurface array elements, each exhibiting different magnitudes of attenuation as their resonance frequencies are thermally tuned. In Fig. 4b, the frame color of each metasurface in the mid-IR image corresponds to the color of the spectral data points presented in the accompanying plot. Square and circular data points represent the transmittance values of each metasurface at varying temperatures in the absence and presence of a polystyrene film, respectively. By continuously sweeping the metasurface array temperature from 300 to 500 K, we acquired a continuous fingerprint spectrum of polystyrene, clearly resolving the 1450 cm−1 and 1492 cm−1 absorption bands associated with (C=C stretching) benzene ring vibrations, respectively. Similarly, we demonstrated detection of a thin PMMA film, resolving its characteristic carbonyl (C=O) stretching vibration at 1730 cm−1 (Fig. 4d). For both polymer species, our approach accurately determined the spectral position and FWHM of the absorption bands, with measured transmission modulation aligning closely with reference spectra obtained through conventional spectroscopy (gray dashed lines in Fig. 4b and d).
Fig. 4: Non-contact mode chemical analysis of polymer films positioned in the optical path using dynamically tunable metasurfaces. The alternative text for this image may have been generated using AI.
a Schematic illustration of the material analysis setup where a polymer film is placed at least 10 mm distant from the thermally tuned metasurface. b The maximum transmittance of six different metasurfaces was measured at varying temperatures from 300 to 500 K, with and without a polystyrene film (thickness = 38 μm). Each metasurface covers around 18 cm−1 spectral range upon a 200 K temperature sweep. Six metasurfaces were sufficient to capture absorption fingerprints of the polystyrene including modes at 1450 and 1492 cm−1 corresponding to C=C stretching vibrations. The colors of the data points correspond to the colored frames of the metasurfaces in the IR microscope image captured at 1450 cm−1. c The hyperspectral data visualization of a single metasurface showing temperature-dependent spectral shifts at three discrete temperatures, 300 K, 400 K, and 500 K. The left panel shows measured data with PMMA film, whereas the right panel depicts the bare metasurface. Spectral colormaps effectively demonstrate spectral homogeneity across the metasurface area, both in the presence and absence of the PMMA film. Corresponding to the PMMA C=O absorption band at 1730 cm−1, the resonance transmission of the metasurface decreases as it is thermally swept through the band. d The maximum transmittance of six metasurfaces, each with a different resonance wavenumber, are measured at varying temperatures from 300 to 500 K, with and without a PMMA film of 700 nm thickness. In (b) and (d), the gray dashed curves correspond to independently measured reference absorption spectra of the polystyrene and PMMA films, respectively
To characterize the spatial resonance characteristics of our thermally tunable metasurfaces, we used a hyperspectral imaging method. Figure 4c presents spectral cross-sections extracted from a hyperspectral image datacube of a single metasurface (area: 400 × 400 μm2) acquired with and without a PMMA film at discrete temperatures of 300, 400, and 500 K. Spatially resolved transmittance profiles within the metasurface element show the shift in resonance peak toward 1730 cm−1 upon temperature increase from 300 to 500 K. The spectral overlap of the metasurface resonance and the characteristic carbonyl absorption band of PMMA at 1730 cm−1 induces a transmission attenuation across the entire metasurface.
While Fig. 4c shows a single metasurface for clarity in data presentation, our optical system uses a mid-IR objective (0.3 NA) and a focal-plane detector, imaging a field of view of approximately 2 mm × 2 mm. Therefore, our imaging optics can integrate a large array of metasurfaces (e.g., 36 of area 200 µm × 200 µm) allowing parallel interrogation across a wider spectral range. Given that a single metasurface can be tuned across a ~ 23 cm−1 spectral range when heated from 300 K to 700 K, a 36-element metasurface array can cover a bandwidth of ~ 820 cm−1, providing multi-band monitoring across the fingerprint spectra in a single frame without mechanical scanning.
To ensure uniform temperature distribution and homogeneous fabrication process, we investigated spectral response uniformity both within a single metasurface and across an array of metasurfaces distributed over a large membrane area (~3 mm × 3 mm) (see SI XI and Fig. S12). Considering the expected fabrication imperfections and intrinsic mode degradation towards the metasurface edges, the spatial maps of resonance wavenumbers at 300 K and 500 K exhibit spatial uniformity, with standard deviations of σ ≈ 8.00 cm−1 and σ ≈ 10.55 cm−1, respectively. Moreover, the thermally induced resonance shift across the membrane remains comparable to the minimum resolvable spectral step (2 cm−1) of our optical system, indicating uniform temperature distribution across the membrane.
Next, we investigated the transient thermal response of the free-standing Si membranes to provide insight into the dynamic tuning speed of our photonic system. Owing to low thermal mass and high in-plane thermal conductivity of the membrane, thermal equilibration occurs at millisecond timescales, with smaller area membranes reaching the steady state thermal equilibrium faster than the larger ones, as shown by the numerical simulations (details in SI XII and Fig. S13).
To investigate the near-field light-matter interactions on the thermally modulated metasurfaces, we deposited PMMA thin films onto Si membrane metasurfaces. Leveraging the low material dissipation and high-Q resonances of the Si membrane metasurfaces, we previously demonstrated vibrational strong coupling (VSC) between the PMMA’s carbonyl (C=O) band and q-BIC and q-BIC-CIT resonance modes14,15. Here, we study coherent energy exchange dynamics and formation of hybrid light-matter states (polaritons) while dynamically sweeping the metasurface resonance mode through PMMA’s vibrational band. Figure 5a illustrates the hybrid polaritonic energy states, depicting lower polariton (LP) and upper polariton (UP), separated by the Rabi frequency (Ω) associated with VSC at two distinct metasurface resonance levels. Figure 5b presents the simulated and measured spectral maps showing VSC-associated anti-crossing behavior as the metasurface temperature gradually increases and q-BIC-CIT mode traverses the PMMA band. The measured transmittance spectra across a 200 K temperature gradient in Fig. 5c demonstrate that as the temperature increases and the q-BIC-CIT mode shifts to lower wavenumbers, the intensity of the UP gradually diminishes, while LP rises. We comprehensively characterized the polariton parameters in Fig. 5d, where temperature-dependent UP and LP peak wavenumber, transmittance amplitude, and linewidth data are presented. As the metasurface temperature increases and its resonance shifts to lower wavenumbers, LP couples more efficiently to the free space propagation than the UP, resulting in an enhanced LP transmission signal. Furthermore, we observed a systematic increase in polariton linewidths with temperature. Temperature-dependent measurements of the PMMA reference film between 300 and 500 K reveal negligible variation in the intrinsic vibrational FWHM of the C=O band (see SI XIII and Fig. S14). This suggests that the temperature-induced polariton linewidth broadening mainly results from increased material loss, phonon interactions, and scattering processes at elevated temperatures, contributing to a reduction in coherence lifetime of the hybrid states.
Fig. 5: Near-field vibrational strong coupling realized with dynamically tunable metasurfaces. The alternative text for this image may have been generated using AI.
a Upon coating the free-standing Si membrane metasurface with 50 nm thick PMMA, near-field light-matter interactions were studied. When the low-loss q-BIC-CIT mode spectrally overlaps with the PMMA’s absorption band, the vibrational strong coupling condition is satisfied, and hybrid light-matter states (polaritons) are generated. The schematic shows the upper (UP) and lower (LP) polariton states separated by the Rabi splitting (Ω) at two different resonance frequencies (blue and red lines) of the same metasurface achieved by temperature tuning. b Simulated and experimentally measured transmittance spectra of a PMMA-coated metasurface at varying temperatures from 300 to 500 K. The temperature-dependent transmittance maps show the Rabi splitting between the upper and lower polariton branches. The pronounced anti-crossing behavior captured by a single dynamically tunable metasurface confirms vibrational strong coupling over the entire temperature range. c Measured FTIR spectra demonstrating the transmittance variation of LP and UP as the metasurface resonance is swept through the PMMA vibrational band. d The upper (red) and lower (green) polariton peak wavenumber, maximum transmittance, and FWHM variations as a function of temperature measured from three different metasurfaces