
The Athletic has live coverage of the Hurricanes vs. Golden Knights in Game 5 of the Stanley Cup Final.
The Stanley Cup Final has served as the stage for epic goaltending duels over the years.
Colossal showdowns between Patrick Roy and Martin Brodeur in 2001 or Dominik Hasek and Ed Belfour in 1999 immediately spring to mind. More recently, in the salary-cap era, we’ve seen Tim Thomas versus Roberto Luongo in 2011, Jonathan Quick versus Henrik Lundqvist in 2014, and Andrei Vasilevskiy versus Carey Price in 2021.
This year’s Cup final will not be joining the list.
The Vegas Golden Knights and Carolina Hurricanes have thrilled us for four straight games to open the series, breaking records for comebacks and lead changes nightly. They’ve combined for the second-most goals ever through four games of a Cup final.
It’s fair to say the goalies are not having a good time.
On Tuesday night, Vegas’ Carter Hart became the first goalie in NHL history to allow four or more goals in each of the first four games of a Cup final. Carolina’s netminders haven’t fared much better. Frederik Andersen took the night off in Game 4 after allowing 12 goals through the first eight periods of the series, and Brandon Bussi won the first start of his playoff career despite posting an .857 save percentage.
Through four games, this is statistically the worst goaltended Stanley Cup Final in the salary-cap era.
Since 2006, no final has had a combined save percentage lower than .877, but this year’s is well below that at an almost unfathomable .855. To find a combined save percentage lower than that, you have to go back to 1973, before the last maskless goalie had retired from the NHL.
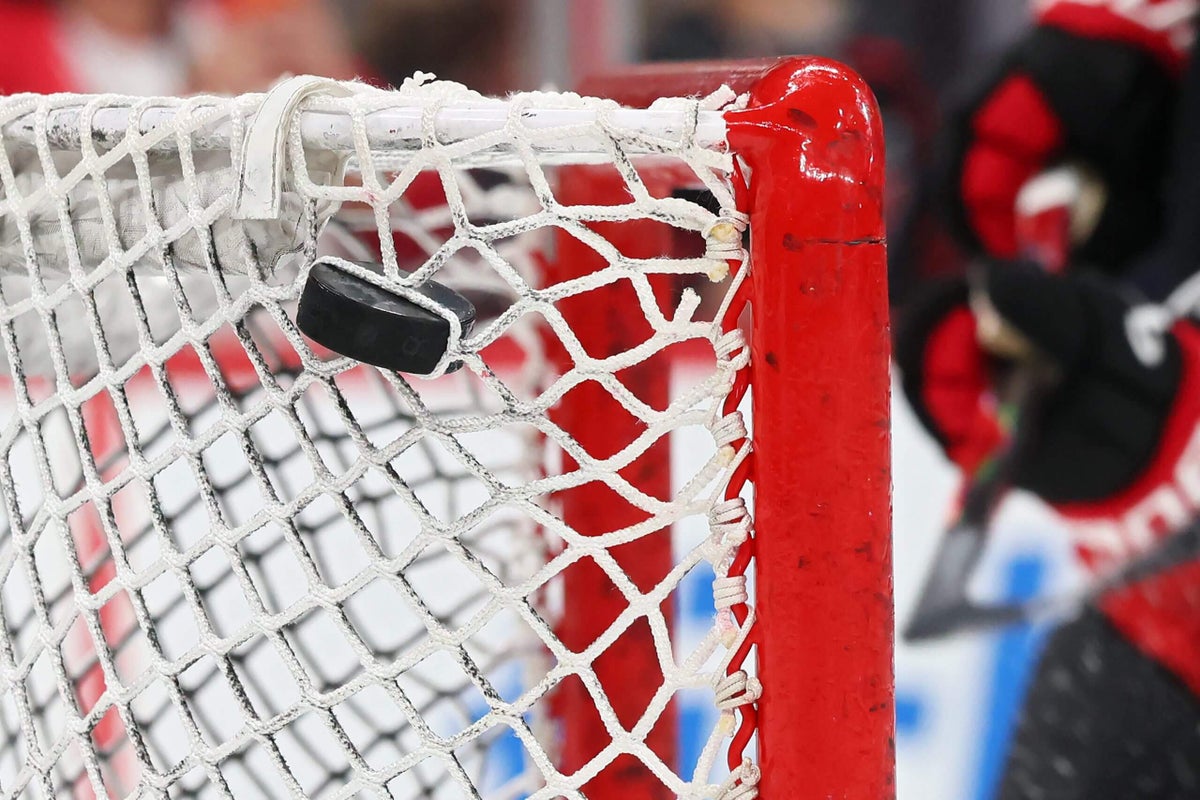
In this era of hockey, we’ve never seen pucks find the net at this high a rate with the Stanley Cup on the line.
Lowest combined Cup final save % (cap era)
YearWinning GoalieLosing GoalieCombined Save %
2010
Antti Niemi
Michael Leighton
.877
2007
J.S. Giguère
Ray Emery
.880
2023
Adin Hill
Sergei Bobrovsky
.882
2018
Braden Holtby
Marc-André Fleury
.887
2025
Sergei Bobrovsky
Stuart Skinner
.894
It’s one of the biggest reasons the games have felt so chaotic, unpredictable and stressful.
“The lead changes and everything has been stressful, to say the least,” Carolina forward Nikolaj Ehlers said Tuesday. “It shows how good both teams are, and when you let up just a little bit, teams are going to take advantage. So it’s stressful, but a lot of fun to be a part of.”
Few feelings test the nerves of a hockey player or coach like the feeling that any shot can go in. Late in games, as both teams have desperately clung to leads, that feeling has been unshakable — for everyone inside the building and watching at home.
The Hurricanes and Golden Knights have been defensive powerhouses — not just for this season, but also for years. In the regular season, they ranked first and third in shots allowed. In the playoffs, they’re both among the league leaders in nearly every defensive metric.
And yet, neither can hold on to a lead for the life of them.
It certainly doesn’t all fall on the goaltenders. Both teams have struggled to limit the other’s biggest offensive strengths. Vegas has regularly found players streaking behind the Carolina defense for breakaways and odd-man rushes. On the other end, the Golden Knights haven’t been able to corral Jordan Staal and others in front of their net.
“He’s killing us in front of the net, Staal,” Vegas coach John Tortorella said. “So we have got to do a better job around the blue (paint).”
Neither coach seems to have the answer to the defensive woes on both ends of the ice.
“I know in this final, during these games here, I have zero answers as far as the lead changes, going back and forth,” Tortorella said Monday. “We’re trying to play defense. They’re trying to play defense. Give the credit to the players, as far as some of the plays they’ve made, and some of the bounces that have gone to each team.”
There’s been no lack of defensive lapses or brilliant offensive plays. That being said, both teams have been shaky in the crease for most of this season.
The Hurricanes are trapped in what has felt like a decadelong search for consistent playoff goaltending. Andersen has often been injured over the last few regular seasons, and 2025-26 was the worst of his career. For the first time in 13 seasons, he finished with more losses than wins and a save percentage below .880.
Bussi, a waiver claim from Florida in October, was sensational early in the season. He won 25 of his first 29 starts but struggled down the stretch with an .865 save percentage and minus-6.85 GSAx in 12 starts after the Olympic break. That opened the door for Andersen to claim the starting role for the playoffs.
In Vegas, Adin Hill battled through an injury-plagued season in the first year of his six-year, $37.5 million contract and eventually lost the starting job to Hart when Tortorella took over behind the bench.
The Hurricanes ranked 26th in team save percentage in the regular season, and the Golden Knights finished directly behind them in 27th. The goaltending was much better through the first three rounds of the playoffs, but it shouldn’t be a massive surprise it hasn’t been a strength in the final.
There’s an argument they haven’t been as bad as the statistics suggest. Goaltending metrics can be tricky; they often reveal more about a goalie’s environment than the netminder himself. For example, the goalies in the last final with a save percentage worse than this one, back in 1973, were Ken Dryden and Tony Esposito.
In defense of this year’s goaltenders, they’ve faced a barrage of rush chances and point-blank looks. They’ve each made a handful of timely saves. Hart’s windmill glove save on Seth Jarvis just before Tomas Hertl’s game winner in Game 1 comes to mind. Bussi robbed Jack Eichel’s backdoor redirect before Staal’s winner in Game 4.
But there have also been plenty of key moments in which they’ve fallen short. Hertl’s goal in Game 1 was a backbreaker for Carolina after tying the score late. It wasn’t an easy save by any stretch, but it was a makeable save, the type that wins games in the Cup final, but Andersen couldn’t get his blocker on it. And in games 3 and 4, Hart became the first goalie in NHL history to allow goals on three consecutive shots in back-to-back Stanley Cup Final games. If he found a way to make just one of those stops, and stop the bleeding, we could be talking about a commanding series lead for Vegas.
For all of the excuses that can be made for the goalies, it’s tough to look past just how bad the numbers have been.
It’s part of a much larger trend. This season’s league-average save percentage of .896 is the lowest in 32 years. The NHL’s newer, more accurate process for tracking shots on goal has no doubt played a factor, but it’s not the only one. The average save percentage has declined for 10 straight seasons, as the league has continued to get younger, faster and more offensive.
Accounting for era is always key when comparing historical goalie statistics, as the standard for good goaltending varies drastically depending on the decade. But even within that context, comparing a given Stanley Cup Final save percentage with the league average of that regular season, this year’s is still the worst in 53 years.
It also stacks up similarly when using goals saved above expected metrics, which are designed to account for the quality of shots faced. Hart, Andersen and Bussi have combined to save 7.64 goals below expected, according to HockeyStats.com. That is the worst combined GSAx figure in a Cup final in 16 years, and the second worst since the stat was tracked in 2008.
Lowest combined Cup final GSAx
YearWinning GoalieLosing GoalieCombined GSAx
2010
Antti Niemi
Michael Leighton
-8.87
2018
Braden Holtby
Marc-André Fleury
-6.06
2025
Sergei Bobrovsky
Stuart Skinner
-3.61
2019
Jordan Binnington
Tuukka Rask
-2.14
2024
Sergei Bobrovsky
Stuart Skinner
-0.6
Expected goals weren’t tracked for the first two seasons of the salary-cap era, but they’re still the best barometer for goaltending excellence over that span. Over the last 18 years, we’ve seen some spectacularly goaltended finals.
The duel between Quick and Lundqvist in 2014 stands alone at the top. The two combined for a .926 save percentage and 8.52 GSAx over six epic games that featured five overtime periods. The 2008 duel between Chris Osgood and Marc-André Fleury was equally memorable, highlighted by a triple-overtime marathon with 83 combined saves.
Highest combined Cup final GSAx
YearWinning goalieLosing goalieCombined GSAx
2014
Jonathan Quick
Henrik Lundqvist
8.52
2008
Chris Osgood
Marc-André Fleury
6.61
2020
Andrei Vasilevskiy
Anton Khudobin
6.58
2011
Tim Thomas
Roberto Luongo
5.32
2016
Matt Murray
Martin Jones
4.45
We’ve also had some recent Stanley Cup Finals dominated by the goal scorers. The last three finals all rank in the bottom five in combined GSAx, suggesting the league’s shift toward speed and skill has outpaced adjustments to expected goal models by a bit.
Still, through only four games, this year’s final is on pace to be the worst in terms of GSAx, with only the 2010 barn burner between Chicago and Philadelphia below it. That year, Antti Niemi, Michael Leighton and Brian Boucher combined to stop 8.87 goals below expected over six games.
As this series has shown, things can change quickly in hockey. Perhaps Hart or Andersen can find the form that helped them backstop their teams through the first three rounds. Maybe Bussi can get hot and join Cam Ward in Hurricanes lore.
At this stage, if any of the goalies turn things around, it would almost certainly win their team a championship. To this point, they’ve only set the wrong types of records.