
Phenotypic diversity and trait interrelationships in the TARS collection
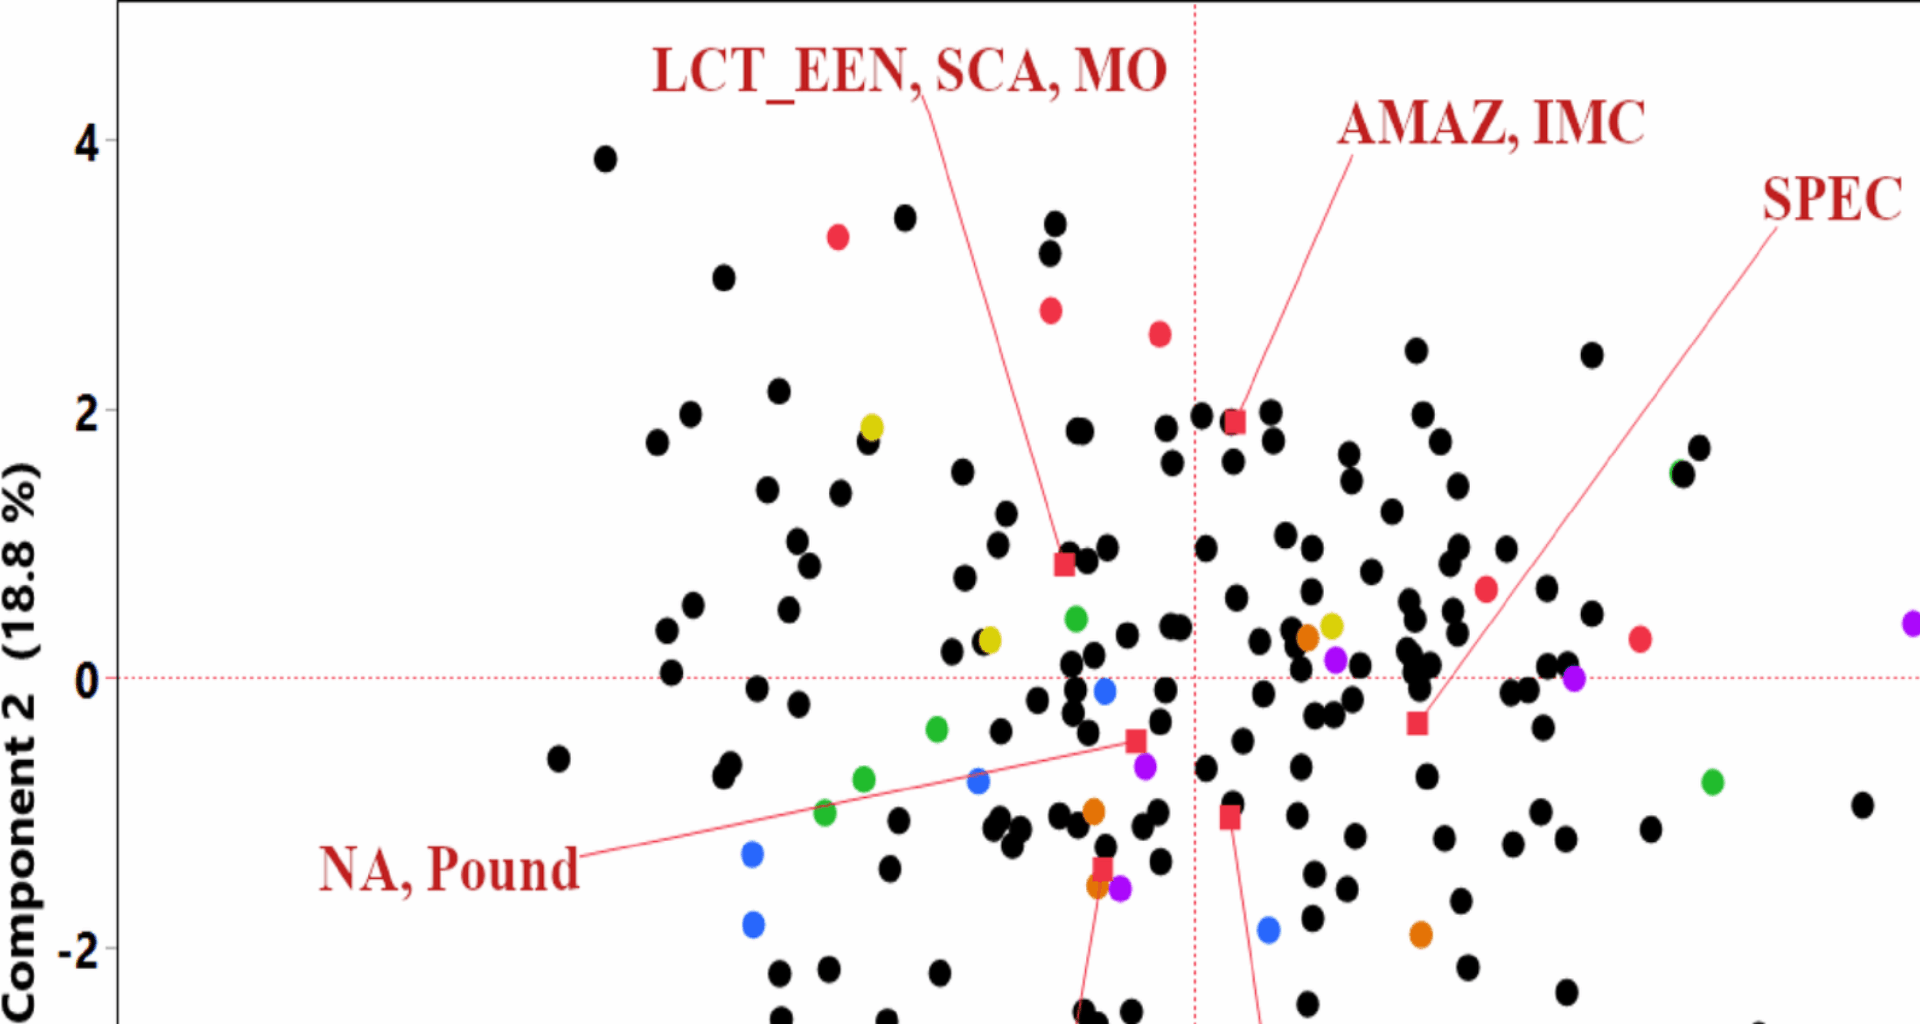
To further explore the structure within the phenotypic data and the relationships among traits for the 173 accessions evaluated in TARS, PCA and Hierarchical Clustering were performed using all measured horticultural traits. The PCA revealed that the first principal component (PC1) accounted for 47.2% of the total phenotypic variance, while the second principal component (PC2) explained an additional 18.8%, collectively representing 66.0% of the variation. Figure 1 displays the distribution of all 173 individual accessions (black dots) in the PCA space based on their phenotypic profiles. The red labels represent the K = 7 genetic structure groups defined by Bekele et al. [22] and are positioned at the mean coordinates of the 28 common accessions belonging to each respective group. The mean points for the accessions show some differentiation. For instance, the means for the “NA, Pound” and “PA” Bekele groups are positioned in the lower-left quadrant, while the mean for “AMAZ, IMC” is in the upper-right quadrant, “LCT, EEN, SCA, MO” is in the upper-left quadrant, and “SPEC,” and “CRIOLLO” are in the lower-right quadrant. This visualization helps to position these genetically defined subsets within the broader phenotypic landscape of the entire TARS collection.
The contributions of individual traits to these principal components are illustrated in the loading plot (Fig. S1). Traits such as pod width, pod length, pod weight, seed water content, and fresh seed weight loaded heavily on PC1, indicating their primary role in driving the main axis of variation. Both PC1 and PC2 influenced dry seed weight, pod index, and total pods, though their directional influence varied. PC2 predominantly influenced Yield (kg/tree/year), number of seeds, and infection rate. The number of infected pods showed a minimal impact, primarily along PC2.
Hierarchical clustering using Ward’s method, based on all phenotypic traits, grouped the 173 accessions into 13 distinct clusters (Fig. S2). This clustering reflects the overall phenotypic similarity among accessions. A corresponding hierarchical clustering of the traits themselves revealed their interrelationships across the dataset (Fig. S3). Notably, dry seed weight clustered closely with pod length. Fresh seed weight formed a cluster with seed water content, which was adjacent to a group containing pod weight and pod width. The number of infected pods and infection rate clustered together, and this pair was closely associated with pod index. Finally, total pods and Yield (kg/tree/year) formed a distinct group, which was linked to the number of seeds. These multivariate analyses provide insights into the underlying structure of phenotypic diversity and the correlational patterns among key horticultural traits in this cacao collection.
Fig. 1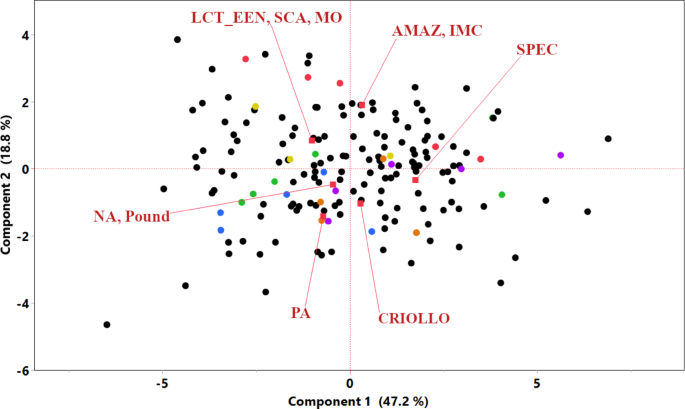
Principal component analysis of 173 cacao accessions based on all measured phenotypic traits. The plot displays the distribution of individual accessions along the first two principal components (PC1 and PC2). The 28 accessions with known genetic group assignments from Bekele et al. [22], are color-coded according to their respective group: AMAZ, IMC (red); CRIOLLO (orange); LCT_EEN, SCA, MO (yellow); NA, Pound (green); PA (blue); and SPEC (purple). The remaining 145 accessions are shown as black dots. Red vectors indicate the mean coordinates for each genetic group
To understand the interrelationships among the horticultural traits measured in Mayaguez, PR, 2007–2011, and to explore phenotypic consistencies with other studies, several correlation analyses were performed: Pearson’s correlation analysis among all traits measured in the TARS collection revealed numerous significant associations, visualized as a heatmap and scatter plots in Fig. 2 (detailed p-values and correlation coefficients are provided in Supplementary Data 1). Notably, a strong positive correlation was observed between ‘Yield’ and ‘Total pods’ (r = 0.83, p < 0.0001). ‘Yield’ also showed a significant negative correlation with ‘Infection rate’ (r = − 0.26, p = 0.0006). The ‘Number of infected pods’ was strongly positively correlated with ‘Infection rate’ (r = 0.70, p < 0.0001). Strong positive correlations (often r > 0.70, p < 0.0001) were prevalent among pod size-related traits, including ‘Pod length’, ‘Pod weight’, and ‘Pod width’. Other notable strong correlations included ‘Dry seed weight’ with ‘Pod index’ (r = − 0.95, p < 0.0001), ‘Fresh seed weight’ with ‘Pod weight’ (r = 0.99, p < 0.0001), and ‘Seed water content’ with ‘Pod weight’ (r = 0.97, p < 0.0001), suggesting that seed water content is a major contributor to pod weight. ‘Number of seeds’ per pod was positively correlated with the total ‘Dry seed weight’ per pod (r = 0.45, p < 0.0001); consequently, a higher number of seeds was also strongly and negatively correlated with ‘Pod index’ (r = − 0.50, p < 0.0001), as fewer of these productive pods were required to yield one kilogram of dry beans. ‘Pod weight’ showed a significant negative correlation with the ‘Number of infected pods’ (r = − 0.23, p = 0.0027). ‘Total pods’ exhibited significant negative correlations with ‘Dry seed weight’ (r = − 0.32, p < 0.0001), ‘Seed water content’ (r = − 0.46, p < 0.0001), ‘Pod weight’ (r = − 0.48, p < 0.0001), and ‘Infection rate’ (r = − 0.32, p < 0.0001), the latter suggesting that higher pod production be associated with a lower overall infection rate.
Fig. 2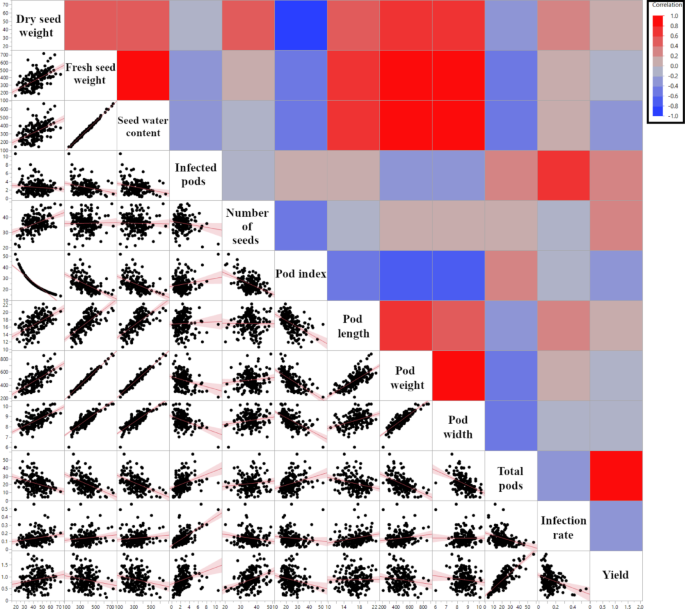
Pearson’s correlation matrix of horticultural traits from TARS cacao phenotype data. The upper triangle displays a heatmap of Pearson correlation coefficients (r), where red indicates positive correlations and blue indicates negative correlations. The lower triangle shows scatter plots for each pair of traits, with a fitted regression line. Trait names are indicated on the diagonal. Detailed correlation coefficients and p-values are provided in Supplementary Data 1
Comparative analyses of TARS traits with ICGT and Agrosavia collections
To explore potential associations between genetic structure and horticultural traits in a subset of the cacao collection [23], Pearson’s correlation coefficients were calculated. This analysis involved 28 accessions common to TARS study and the Bekele et al. [22] investigation. Membership coefficients for these accessions to the K = 7 genetic clusters defined by Bekele et al. [22] were correlated with their phenotypic trait values from the TARS evaluation. Several statistically significant correlations were identified (Fig. 3, detailed in Supplementary Data 1). Notably, a higher membership coefficient for the ‘AMAZ, IMC’ genetic cluster was positively correlated with both the Dry seed weight (r = 0.39, p = 0.041), Number of Seeds per pod (r = 0.59, p = 0.001) and overall Yield (kg/tree/year) (r = 0.50, p = 0.0065), while being negatively correlated with Pod Index (r = − 0.40, p = 0.0344). Membership in the ‘LCT, EEN, SCA, MO’ cluster showed a positive correlation with Total Pods per tree (r = 0.48, p = 0.0097), whereas membership in the ‘SPEC’ cluster was negatively correlated with this trait (r = − 0.48, p = 0.0101). The ‘CRIOLLO’ genetic group membership showed positive correlations with Fresh seed weight (r = 0.38, p = 0.0454), seed water content (r = 0.38, p = 0.0475), Pod Length (r = 0.43, p = 0.0231) and Infection Rate (r = 0.50, p = 0.0074), and negatively correlated with total pods (r = − 0.41, p = 0.0318) Stronger affiliation with the ‘GU’ (Guiana) group was associated with fewer Infected Pods (r = − 0.40, p = 0.034). This correlation was possible because the analysis used continuous membership coefficients; however, the ‘GU’ group is not shown in Figs. 2 and 3, as no accession had ‘GU’ as its highest assigned ancestry group. Interestingly, membership in the ‘PA’ (Parinari) group was strongly correlated with a higher (less efficient) Pod Index (r = 0.61, p = 0.0005) and negatively correlated with Dry Seed Weight (r = − 0.48, p = 0.0098). These correlations suggest linkages between the genetic background and the expression of these specific horticultural traits within this subset of 28 accessions evaluated in Puerto Rico.
Fig. 3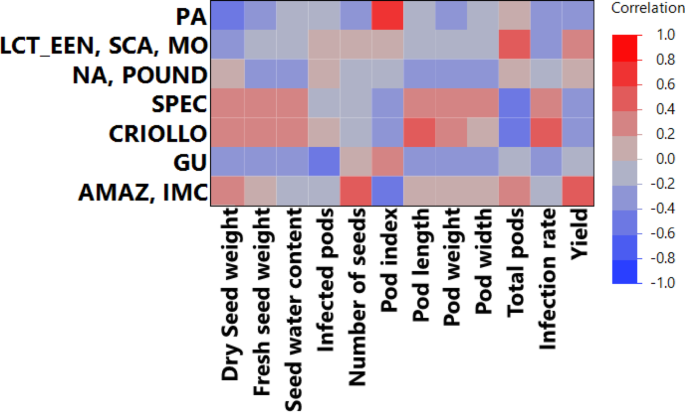
Correlation heatmap of genetic cluster membership and phenotypic traits. The heatmap displays Pearson’s correlation coefficients (r) between membership coefficients for 28 common accessions to the K = 7 genetic clusters defined by Bekele et al. [22] and the corresponding phenotypic traits evaluated in Puerto Rico. Red squares indicate positive correlations and blue squares indicate negative correlations, with color intensity corresponding to the magnitude of the correlation coefficient
A summary of the ANOVA results and post-hoc pairwise comparisons (p < 0.05) for traits showing statistically significant differences among genetic groups is provided in Fig. 4. For Dry Seed Weight, the ANOVA revealed a statistically significant difference among the genetic structure groups (F = 3.7625, p = 0.0130). Post-hoc comparisons indicated that the ‘AMAZ, IMC’ group had a significantly higher mean dry seed weight (50.10 g) than the ‘PA’ (30.64 g) and ‘LCT, EEN, SCA, MO’ (35.83 g) groups. For Pod Index, a significant difference was also found among the groups (F = 5.3806, p = 0.0022). The ‘PA’ group had a significantly higher (less efficient) mean pod index (33.12) compared to all other groups except ‘LCT, EEN, SCA, MO’. Regarding yield components, the mean number of Total Pods per tree differed significantly among the genetic groups (F = 2.9832, p = 0.0333). The ‘LCT, EEN, SCA, MO’ group had a significantly higher mean number of total pods (30.43) than the ‘CRIOLLO’ (15.25), ‘SPEC’ (15.08), and ‘NA, POUND’ (18.05) groups. Finally, Yield (kg/tree/year) also showed a statistically significant difference among the groups (F = 4.7307, p = 0.0044). The ‘AMAZ, IMC’ group exhibited the highest mean yield (1.258 kg/tree/year), which was significantly greater than the ‘PA’ (0.626 kg/tree/year) and ‘CRIOLLO’ (0.630 kg/tree/year) groups. Other horticultural traits evaluated did not show statistically significant variation across these genetic groups for this subset of 28 accessions and are therefore not depicted in Fig. 4 (detailed statistics in Supplementary Data 1). These characterizations provide insights into the phenotypic diversity associated with the genetic structure within this subset of the cacao collection.
Fig. 4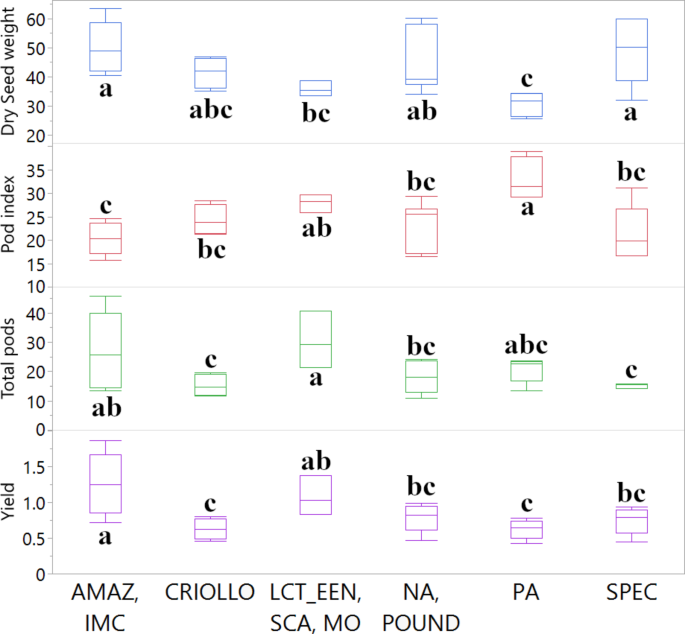
Comparison of key horticultural traits among 28 cacao accessions grouped by genetic clusters. Boxplots illustrate the distribution of Dry Seed weight (g), Pod index, Total pods (count), and Yield (kg/tree/year) for accessions assigned to the K = 7 genetic clusters. Other horticultural traits evaluated did not show statistically significant differences among these genetic groups in this subset of accessions. Boxes represent the interquartile range (IQR), the horizontal line within the box indicates the median, and whiskers extend to 1.5 times the IQR. Different letters above the boxes indicate statistically significant differences (p < 0.05) between mean values for the genetic groups, based on ANOVA and post-hoc Student’s t-tests
Spearman’s rank correlation was used to compare traits from the TARS study with those reported by Bekele et al. [22] for 27 overlapping cacao accessions evaluated at the ICGT. This analysis was chosen due to the inclusion of ranked and continuous data in the ICGT dataset. The correlation matrix is presented in Fig. S4 and Table 1, with full details available in Supplementary Data 1.
Evidence for trait stability across the two locations was observed. A significant positive correlation was found between ‘Number of seeds (TARS)’ and ‘Seed, number (ICGT)’ (ρ = 0.50, p = 0.0082), suggesting a degree of genetic control over this yield component. Similarly, ‘Dry weight (TARS)’ was strongly correlated with ‘Wet bean mass (ICGT)’ (ρ = 0.56, p = 0.0026), indicating consistency in the overall seed mass potential of these accessions.
The analysis also confirmed fundamental biological trade-offs. ‘Pod index (TARS)’, an inverse measure of efficiency, was strongly and negatively correlated with ‘Wet bean mass (ICGT)’ (ρ= −0.55, p = 0.0027). Conversely, ‘Total pods (TARS)’ showed a negative correlation with ‘Cotyledon mass (ICGT)’ (ρ= −0.48, p = 0.0118), demonstrating the classic inverse relationship between pod number and individual seed size.
Among the strongest relationships identified, ‘Pod length (TARS)’ was highly correlated with ‘Wet bean mass (ICGT)’ (ρ = 0.64, p = 0.0004), suggesting that the potential for longer pods is a strong indicator of the potential for heavier beans. Furthermore, an intriguing positive correlation was found between ‘Infection rate (TARS)’ and ‘Cotyledon mass (ICGT)’ (ρ = 0.44, p = 0.0205).
Table 1 Significant spearman’s rank correlations between phenotypic traits from the Puerto Rico (TARS) and international cocoa Genebank, Trinidad (ICGT) evaluations. The table lists significant (p < 0.05) spearman’s rank correlation coefficients (ρ) comparing traits measured in the 27 overlapping accessions from the TARS evaluation against traits from the ICGT dataset [22]. The corresponding p-value for each correlation is provided
Pearson’s correlation analysis was conducted between numerical traits from the TARS study and those reported by Osorio-Guarín et al. [7] for 20 overlapping accessions evaluated in Colombia. The correlation matrix is shown in Fig. 5, with TARS traits highlighted in green (full details in Supplementary Data 1). Notably, ‘Infection rate (TARS)’, primarily reflecting black pod rot incidence caused by Phytophthora spp. in Puerto Rico, showed strong positive correlations with disease metrics from the Agrosavia study. Specifically, it was correlated with ‘AUDPC flower cushion broom infected by WBD’ (r = 0.86, p < 0.0001) and ‘AUDPC deformed branches infected by WBD’ (r = 0.72, p = 0.0016). This result indicates that accessions susceptible to black pod rot in Puerto Rico were also susceptible to Witches’ Broom Disease (WBD) in Colombia. Other significant correlations included ‘Fresh seed weight (TARS)’ with ‘AUDPC flower cushion broom infected by WBD’ (r = 0.56, p = 0.025), ‘Total number of pods (TARS)’ with ‘AUDPC pods infected by WBD’ (r = 0.50, p = 0.024), and ‘Pod weight (TARS)’ with ‘AUDPC flower cushion broom infected by WBD’ (r = 0.56, p = 0.024).
Fig. 5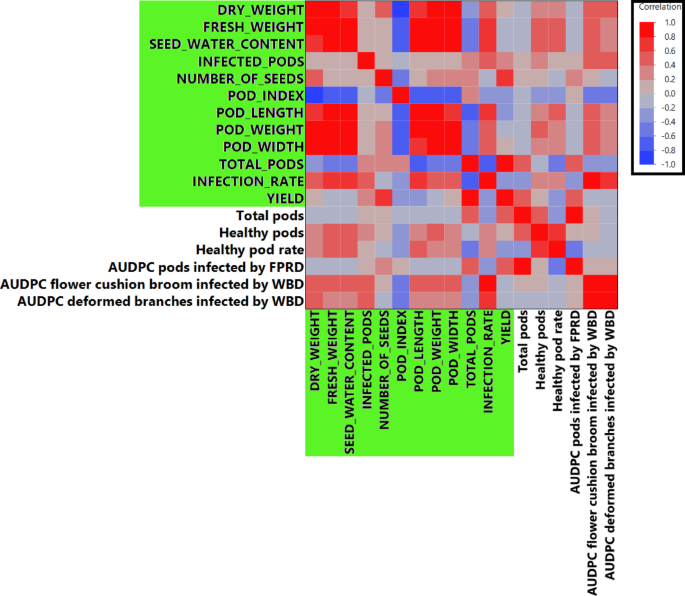
Comparative analysis using Pearson’s correlations of traits between the TARS evaluation dataset and the Agrosavia collection dataset for 20 overlapping cacao accessions. Traits from the TARS study are highlighted with a green background on the axes. Pearson correlation coefficients (r) are visualized by color intensity (red for positive, blue for negative). Detailed correlation coefficients and p-values are provided in Supplementary Data 1
Machine learning models predict Cacao yield from TARS phenotypic traits
To assess the utility of phenotypic traits for predicting cacao yield in the PR study, a model screening approach employing various ML algorithms was conducted using JMP Pro 17 with 5-fold cross-validation. The predictive performance and key contributing traits were evaluated in an iterative manner.
Initially, when all other measured phenotypic traits were used as predictors for ‘Yield’, a Neural Boosted model demonstrated superior performance, achieving an average R2 of 0.9985 across the 5 validation folds. Other models, such as Fit Stepwise (average R2 = 0.9571), Generalized Regression Lasso (average R2 = 0.9539), Boosted Tree (average R2 = 0.9332), and Fit Least Squares (average R2 = 0.9234), also performed well, while Bootstrap Forest, SVM-RBF, Decision Tree, and KNN models had average R2 values below 0.90. The best individual validation model from this iteration was a Neural Boosted model (Fold 1, R2 = 0.9994). For this model, ‘Total pods’ was the most influential predictor, with a total effect of 0.763, followed by ‘Pod index’ (total effect = 0.213) and ‘Dry weight’ (total effect = 0.054). Other traits had total effects of less than 0.002 (details in Supplementary Data 1). This near-perfect R-squared value is expected, as several key predictors (e.g., ‘Total pods’, ‘Pod index’) are mathematical components of the target variable ‘Yield’. The value of this analysis, therefore, lies not in prediction per se, but in confirming and ranking the hierarchy of these components through our iterative approach.
In a second iteration, ‘Total pods’ was removed from the set of predictor variables. The Neural Boosted algorithm remained the top-performing model, with an average validation R-squared of 0.9935 across 5 folds. The next best models were SVM-RBF (average R2 = 0.76) and Generalized Regression Lasso (average R2 = 0.7371). The best individual validation model in this iteration was a Neural Boosted model (Fold 3, R2 = 0.999). The primary predictor identified by this model was ‘Infection rate’, with a total effect of 0.722. Other important predictors included ‘Fresh seed weight’ (total effect = 0.469), ‘Infected pods’ (total effect = 0.274), ‘Seed water content’ (total effect = 0.259), and ‘Pod weight’ (total effect = 0.224) (Supplementary Data 1).
Finally, with both ‘Total pods’ and ‘Infection rate’ excluded as predictors, the Neural Boosted model still provided the best average predictive performance across 5 folds, though the average R-squared decreased to 0.5214. Bootstrap Forest (average R2 = 0.3606) and Fit Stepwise (average R2 = 0.3417) were the next best. The best individual validation model was again a Neural Boosted model (Fold 1), achieving an R2 of 0.6884. In this constrained model, ‘Pod weight’ emerged as the most significant predictor (total effect = 0.543), followed by ‘Infected pods’ (total effect = 0.217), ‘Number of seeds’ (total effect = 0.118), ‘Pod index’ (total effect = 0.091), and ‘Pod width’ (total effect = 0.09) (Supplementary Data 1). These iterative modeling experiments highlight the strong predictive capacity of phenotypic traits for cacao yield and reveal a hierarchy of trait importance.
Marker-trait association identifies loci on multiple chromosomes linked to key horticultural traits
To identify genetic markers associated with phenotypic variation observed in the accessions evaluated in TARS, SNP data from Bekele et al. [22] were integrated with the TARS phenotypic dataset for 27 common accessions. Utilizing 671 SNPs, a response screening analysis was conducted in JMP Pro 17. This analysis identified several SNPs significantly associated with key horticultural traits after applying a FDR correction (p < 0.01). For ‘Total pods’, three significant markers passed the significance threshold (Fig. 6a). These included the genetic marker TcSNP475, located within a putative zinc finger stress-associated protein gene (Tc05_t008610); TcSNP428, associated with a magnesium-protoporphyrin cyclase gene (Tc05v2_g011210); and TcSNP154, linked to a xyloglucan endotransglucosylase/hydrolase protein gene (Tc01v2_g018540). For ‘Infection rate’, a single marker, TcSNP508, was found to be significant (Fig. 6b) and is associated with a cysteine proteinase 15 A gene (Tc08v2_g002970). For ‘Yield’, two SNPs were significantly associated (Fig. 6c). One was again the genetic locus TcSNP475, reinforcing its link to overall productivity. The other significant marker was TcSNP483, located within a gene for an ATP synthase subunit (Tc03v2_g019660). No other SNPs reached this level of genome-wide significance for the other horticultural traits tested with this FDR threshold. The repeated association of the genetic marker TcSNP475 on chromosome 5 with both ‘Total pods’ and ‘Yield’ is particularly noteworthy. This locus is located within the gene Tc05_t008610, annotated as encoding a “Zinc finger A20 and AN1 domain-containing stress-associated protein 4”. This finding strongly points to this genomic region as a potential quantitative trait locus (QTL) influencing yield components in this subset of cacao germplasm, with a candidate gene potentially involved in stress response pathways.
Fig. 6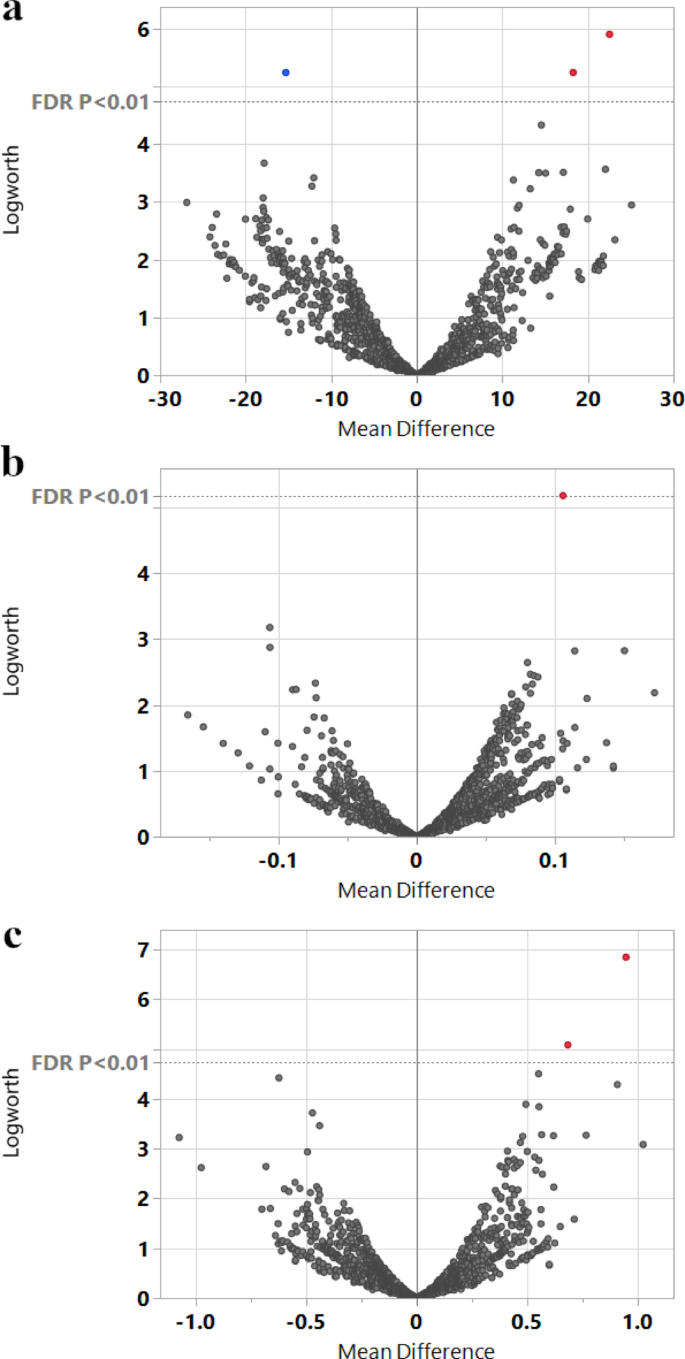
Volcano plots illustrating marker associations with key horticultural traits from the TARS cacao collection. Response screening analysis using genetic markers from the ICGT study as predictors for traits in 28 common accessions. In each plot, the x-axis represents the mean difference associated with each marker, the y-axis represents the Logworth score, and each point represents a single marker. The horizontal dashed line indicates the significance threshold (FDR p < 0.01). Points colored red or blue highlight the markers that surpassed this threshold. (a) Volcano plot for the ‘Total pods’ trait, highlighting three significant markers (the locus TcSNP475, and SNPs TcSNP428 and TcSNP154). (b) Volcano plot for the ‘Infection rate’ trait, highlighting one significant SNP (TcSNP508). (c) Volcano plot for the ‘Yield’ trait, highlighting two significant markers (the locus TcSNP475 and SNP TcSNP483)