
Paeonia lactiflora Pall., commonly known as the Chinese peony, is a perennial herbaceous plant belonging to the family Paeoniaceae. It is widely distributed across China, Korea, Japan, and eastern Russia and is one of the representative species of the genus Paeonia [1, 2]. Known for its strikingly beautiful flowers, P. lactiflora is often referred to as the “Prime Minister of Flowers,” a title that highlights its aesthetic appeal and profound cultural significance [3]. As early as the 6th century BCE, peonies were mentioned in The Book of Songs, China’s earliest collection of poetry, where they symbolized beauty and love, becoming a prominent motif in ancient literature and art [4]. Beyond its ornamental value, the P. lactiflora holds an irreplaceable role in traditional Chinese medicine (TCM), with its medicinal use traceable to Sheng Nong’s herbal classic, the first pharmacological text in China [5]. In Shanghan Lun (Treatise on Cold Damage Diseases) by Zhang Zhongjing, a classic TCM book, formulas containing P. lactiflora account for one-third of all prescriptions, underscoring the plant’s importance in traditional medicine [6]. The root of P. lactiflora is its primary medicinal component, which can be processed into two main forms: Bai Shao (Radix Paeoniae Alba) and Chi Shao (Paeoniae Radix Rubra). Modern pharmacological studies have revealed the chemical composition and bioactivity of P. lactiflora roots, which are rich in monoterpenes, glycosides, and flavonoids [7,8,9]. Among these, paeoniflorin, a key bioactive compound, has been demonstrated to possess significant analgesic, anti-inflammatory, and immunomodulatory effects [10,11,12]. These properties make P. lactiflora not only a vital resource in traditional medicine but also a promising candidate for modern drug development, providing invaluable resources for contemporary medical research.
The family Paeoniaceae is unique in the plant kingdom as it contains only one genus, Paeonia, comprising approximately 30 species [13]. Many species are cultivated extensively for their ornamental value due to their uniquely beautiful flowers [14]. To date, researchers and horticulturists have successfully developed over 8,000 cultivars, primarily derived from hybridization among more than 30 wild species, and this number continues to grow [15]. These abundant cultivars not only cater to the demands of the horticultural market but also serve as crucial resources for botanical and genetic research. However, despite the evident ornamental and medicinal value of peonies, the utilization of their genetic resources remains challenging [16]. To facilitate genome-assisted breeding and cultivar improvement, the development of high-quality reference genomes for wild peony species has become imperative. Although paeoniflorin is the primary bioactive compound in P. lactiflora, its biosynthetic pathway remains incompletely elucidated, and the associated key genes are yet to be identified [17]. Addressing these knowledge gaps requires the support of comprehensive and high-quality genomic data. In recent years, advances in genome sequencing technology have overcome many technical bottlenecks in constructing high-quality genomes [18, 19]. To date, several species within the family Paeoniaceae have had their genomes successfully sequenced, including P. ludlowii, P. ostii, and P. suffruticosa [20,21,22]. Building on these advancements, our laboratory conducted a whole-genome sequencing project for P. lactiflora. The results reveal that approximately 11.4 Gb of genomic sequences were anchored to five chromosomes, comprising 2,408 contigs. This high-quality genomic dataset establishes a solid foundation for studying the functional genes of P. lactiflora and advancing its genetic improvement, while also providing critical data for decoding the biosynthetic pathways of representative monoterpenes produced by P. lactiflora.
In modern life sciences, the acquisition and analysis of large-scale, complex data have consistently posed significant challenges [23, 24]. With the rapid expansion of bioinformatics technologies, the efficient storage, integration, and visualization of such data have become essential tasks for researchers. Online databases, known for their integrative and convenient nature, have become indispensable tools in life sciences research [25, 26]. For instance, online databases for Arctium lappa and Myrica rubra have greatly facilitated research and applications related to these species [27, 28]. Such successful models offer valuable insights for developing databases for other economically and medicinally important plants. To further explore the biosynthetic pathway of paeoniflorin and its ecological functions, we performed comprehensive multi-omics analyses—including transcriptomics, proteomics, and metabolomics—on the roots, stems, and leaves of P. lactiflora samples. By integrating multi-omics data with genomic information, we constructed a powerful P. lactiflora database. This database incorporates a genome browser, sequence alignment tools, homologous protein prediction, and primer design functionalities, providing researchers with an efficient platform for data retrieval. For example, 3-hydroxy-3-methyl glutaryl coenzyme A (HMG-CoA) reductase, which catalyzes the rate-limiting step of the mevalonate pathway by reducing HMG-CoA to mevalonic acid, serves as the pivotal enzyme in the mevalonate pathway [29]. Our database contains five distinct HMG-CoA reductase genes that can be effectively retrieved, demonstrating its practical utility for investigating the biosynthetic pathway of paeoniflorin.
As global demand for medicinal plant resources continues to rise, the dual ornamental and medicinal value of P. lactiflora has made its research increasingly prominent. The establishment of this database enables researchers to systematically study the genetic characteristics, gene expression, and functional proteins of peonies. This will accelerate the breeding of new cultivars and the application of functional genes. Additionally, these research outcomes will provide novel molecular targets and scientific foundations for modern drug development, further advancing the modernization of traditional Chinese medicine.
Utility and DiscussionContent
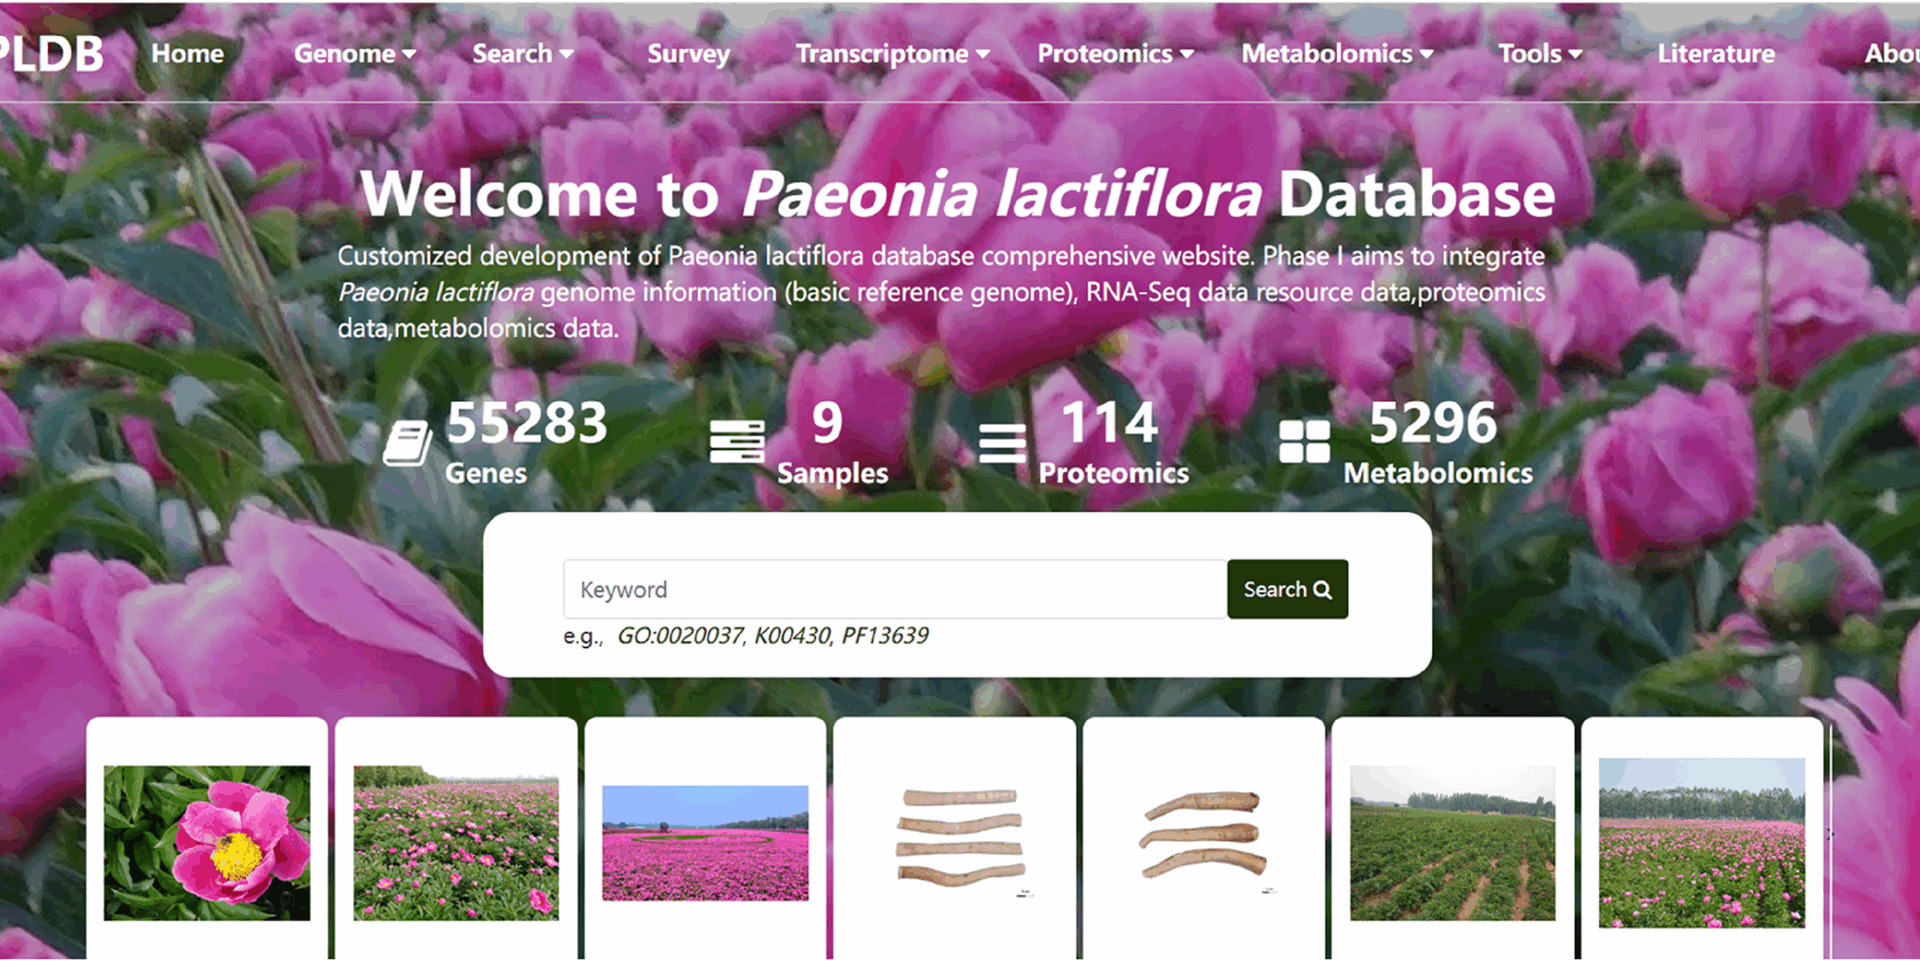
The P. lactiflora database encompasses nine functional modules, as shown in Fig. 1, which include Home, Genome, Search, Survey, Tools, Transcriptome, Metabolomics, Proteomics, and Literature. It hosts a total of 55,283 P. lactiflora protein-coding genes, 5,296 metabolite entries, 114 proteomics datasets, 130 pathway datasets, and various phylogenetic trees. Additionally, the database includes genome data from a closely related species of peony, along with chloroplast and mitochondrial data [30, 31]. For research purposes, users can access the Literature module, which contains 115 publications related to P. lactiflora studies (Fig. 2). With these resources, interested researchers can quickly retrieve and utilize the information they need by leveraging the database’s diverse functionalities.
Fig. 1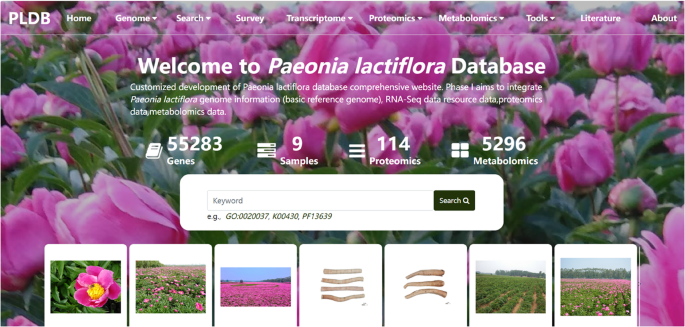
User interface of the P. lactiflora database homepage. This figure presents the primary landing page of the database, accessible at the provided URL. Key interface elements include: (1) The prominent navigation bar at the top, featuring the “Home” button for returning to this central hub; (2) The designated functional modules area, clearly demarcated and accessible from this page; (3) The overview section providing a concise summary of the database’s scope and content
Fig. 2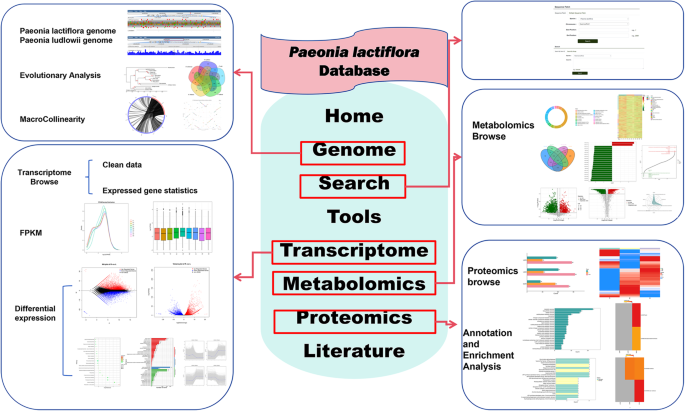
Schematic representation of functional modules within the P. lactiflora database. This diagram illustrates the core data categories and analytical tools offered by the database, organized into distinct modules (represented by labeled boxes). Arrows indicate logical relationships and data flow between modules. The content displayed within each module box exemplifies the type of information (e.g., datasets, visualizations) accessible to users
Survey
To determine the fundamental genomic characteristics of P. lactiflora and establish a reliable foundation for subsequent de novo genome sequencing and assembly, we performed a comprehensive genome survey analysis. This included the estimation of genome size, heterozygosity, repetitive sequence composition, and other relevant parameters. In the database, users can view our survey results under the “Survey” module, which contains detailed sequencing data. By clicking the “K-mer” icon in front of each survey entry, users can access the corresponding K-mer distribution plot.
Genome
This module contains the first high-quality chromosome-level draft genome assembly of P. lactiflora, obtained mainly from PacBio Revio sequencing. The assembled genome size is approximately 11.4 Gb, with a contig N50 of 13,854,769 bp, a GC content of 33.84%, and 80,384 protein-coding genes. In addition, for comparison, the module provides access to the genome of the closely related species P. ludlowii, which has an assembled genome size of 10.3 Gb [20].
Users can explore the genome by clicking on the “Genome” tab in the navigation bar. The genome list includes P. lactiflora, P. ludlowii, and various submodules such as JBrowse, evolutionary analysis, collinearity, chloroplast, and mitochondria (Fig. 3A). Within the P. lactiflora and P. ludlowii sections, users can view tables showing the chromosome locations of genes, their start and end positions, and protein annotations in databases like Gene Ontology (GO), InterPro Protein Families Database (InterPro), Non-Redundant Protein Database (NR), Swiss-Prot Protein Sequence Database (Swiss-Prot), and Translation of EMBL (TrEMBL). Gene IDs in the tables are clickable, linking to dedicated pages with detailed information about each gene. Similarly, protein database IDs are also clickable, directing users to corresponding entries in external databases for easier data retrieval (Fig. 3B). This database uses the JBrowse1.12.3 genome visualization tool to display the genomes of P. lactiflora and the closely related species, P. ludlowii. Users can select specific chromosomal regions for detailed browsing (Fig. 3C). To compare gene arrangements and conserved relationships between the two genomes, the database uses Circos plots for MicroCollinearity, with interactive inner lines that link to detailed pages. To showcase collinearity over larger regions, such as chromosomes or extensive segments, a MacroCollinearity module is included, with clickable data points for further exploration. The Genome module also features an Evolutionary Analysis submodule (Fig. 3D and E). Here, users can explore the Gene Family Cluster section, which includes species clustering statistics, classification charts of gene family clustering, and Venn diagrams of shared and unique gene families. The Phylogenetic Analysis section provides phylogenetic trees of species, while the Divergence Time section offers evolutionary trees depicting species divergence times and gene family expansion or contraction. The Positive Selection section displays bar charts and scatter plots for GO and KEGG classifications and enrichment analysis. The chloroplast section includes circular genome maps of P. lactiflora and some related species, while the mitochondrial section presents the mitochondrial genome map of P. lactiflora.
Fig. 3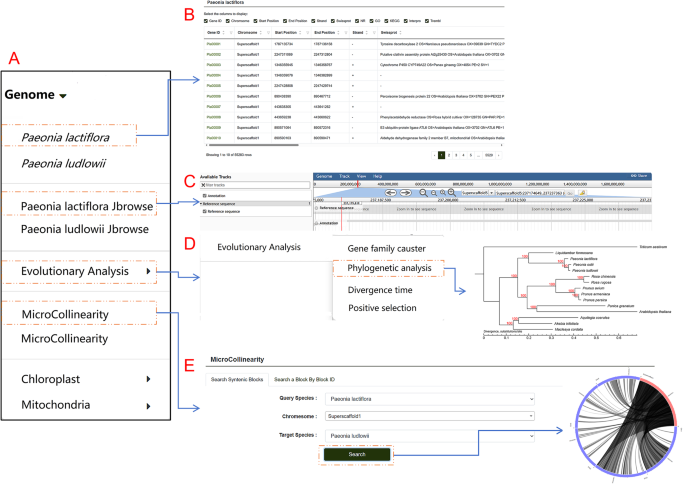
Detailed view of the Genome module architecture and functionalities. This figure provides an in-depth exploration of the Genome module’s structure and capabilities. A The layout and structure of individual submodules within the gene module. B-E. Key functionalities, including “Paeonia lactiflora”, “Paeonia lactiflora JBrowse”, “Evolutionary Analysis”, and “MicroCollinearity”
Transcriptome
This module includes RNA-Seq datasets from different tissues of P. lactiflora. By hovering the mouse over this module, users can access submodules such as Transcriptome Browse, Fragments Per Kilobase of transcript per Million mapped reads (FPKM), Differential Expression Analysis, KEGG Pathway, and more (Fig. 4A). When users open the Transcriptome Browse submodule, they can view the basic data of each transcriptome group, which includes two fundamental tables—Clean Data and Expressed Gene Statistics—as well as the Expression Dataset table (Fig. 4B). The Clean Data table provides information such as Clean Reads and GC content for the samples used in the experiment. The Expressed Gene Statistics table displays the number and proportion of genes corresponding to different FPKM ranges in each sample. The Expression Dataset table presents the expression levels of genes in various tissue samples. In the FPKM submodule, the number of genes and their isoforms with different FPKM values are summarized. Above the table, users can find visualizations such as FPKM density distribution plots and box plots for different samples (Fig. 4C). In the Differential Expression Analysis submodule (Fig. 4D), users can explore MA plots, volcano plots, clustered heatmaps of differentially expressed genes, and log10(FPKM + 1) line plots for any pair of sample comparisons, based on their needs. The Transcriptome Module also includes a search function that allows users to search for genes using IDs from databases like GO (Fig. 4E). In the KEGG Pathway Enrichment submodule (Fig. 4F), enriched pathway diagrams are presented in a web format. By clicking on the name of an enriched pathway, users can view the KEGG enrichment results of differentially expressed isoforms for the respective comparison group (Fig. 5A). Clicking on the number of genes in the pathway allows users to view the specific genes involved (Fig. 5B). Gene IDs are clickable, providing further detailed information. Additionally, within the enriched pathway webpage, clicking on the pathway name redirects users to a detailed pathway description table. Protein IDs in this table are also active, linking to their respective detailed description pages.
Fig. 4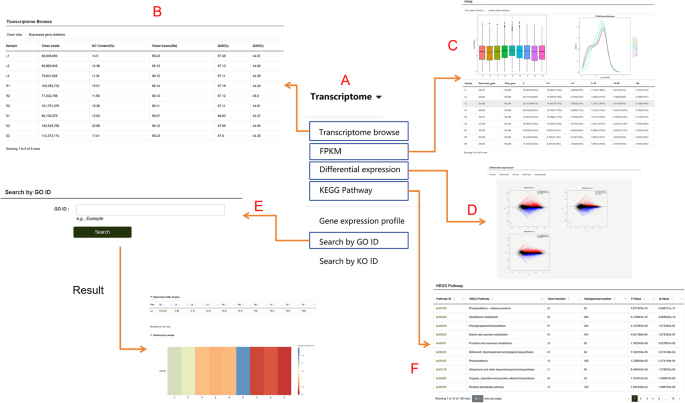
Features of the “Transcriptome” module. A An overview of the submodules contained within the transcriptome module. B-E. Detailed descriptions of the “Transcriptome Browse,” “FPKM,” “Differential Expression,” “KEGG Pathway,” and “Search by GO ID” submodules
Fig. 5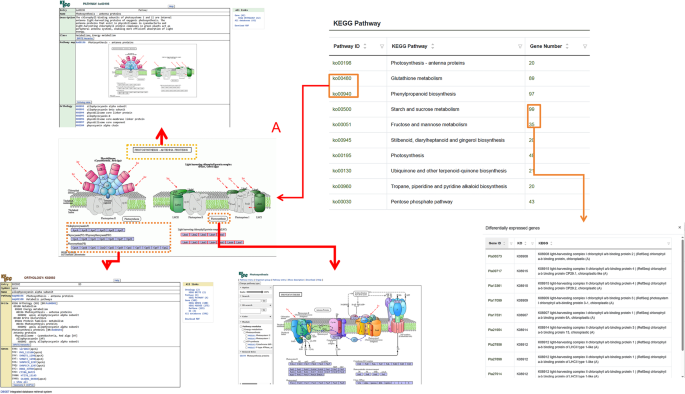
Implementation architecture of KEGG pathway hyperlink integration in the P. lactiflora database. A Dynamic URL generation schema for pathway identifiers. This panel demonstrates the structured parameterization of KEGG pathway access URLs, where each pathway ID is programmatically embedded into the KEGG API call template. B Gene-pathway association interface with bidirectional linkage. The left subpanel displays the interactive gene count element (highlighted) serving as a data gateway. Upon user initiation (click event), the system dynamically renders the corresponding gene catalog view (right subpanel), which enumerates all annotated genes participating in the selected biochemical pathway, complete with hyperlinks to individual gene records
Metabolome
In the Metabolome module, users can access metabolite data obtained in this study (Fig. 6A). For ease of viewing, the metabolites are separated into two tables based on positive and negative ion modes. Each table includes detailed information such as metabolite names, classifications, molecular weights, and more (Fig. 6B). Users can select the specific content they wish to view by clicking the checkbox in front of the corresponding label at the top. Clicking on the index in front of each metabolite in the table redirects users to the overview page for that metabolite, where all relevant information is displayed. Additionally, this module provides visualizations such as a donut chart of metabolite classifications and an overall sample clustering chart (Fig. 6C). The module also includes a Differential Analysis submodule, where users can explore information about differential metabolites (Fig. 6D). This primarily includes comparative data on differential metabolites across the root, stem, and leaf tissues. The interface also features KEGG annotations for differential metabolites, allowing users to view related pathways and metabolites. Furthermore, the submodule incorporates dynamic distribution charts of metabolite content differences, volcano plots of differential metabolites, and Venn diagrams of differentially expressed metabolites. These tools provide comprehensive visual and analytical insights into the metabolite data.
Fig. 6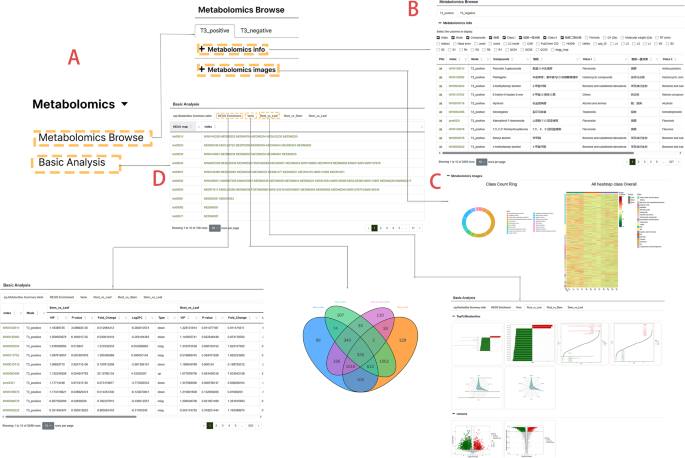
Insights into the “Metabolome” module. A A comprehensive overview of the metabolome module. B The metabolome data table, showcasing detailed information. C Visual representations, including a donut chart of metabolite categories and a sample clustering plot. D Results table for basic metabolome analysis and its associated features
Proteome
The Proteome module contains all protein data resulted from this study (Fig. 7A). The protein data table includes details such as protein ID, sequence, molecular weight (Mw, kDa), coding gene, peptide count, pathway information, and database IDs (Fig. 7B). By clicking on each database ID, users are redirected to the respective protein page within that database. This module also features a Quantitative Information section, which records tables of differential proteins and their quantitative information. Users can explore respective protein data across root, stem, and leaf tissues (Fig. 7C). Additionally, the interface includes visualizations such as differential protein statistics charts and quantitative heatmaps of differential expression proteins (DEP plots). Under the Proteome module, the Annotation and Enrichment Analysis submodule allows researchers to view various visual representations, including bar charts for GO annotations, heatmaps for GO enrichment, bar charts for subcellular localization (SL) annotations, heatmaps for SL enrichment, and bar charts for Pfam annotations. These features provide detailed insights into protein functions and their biological significance.
Fig. 7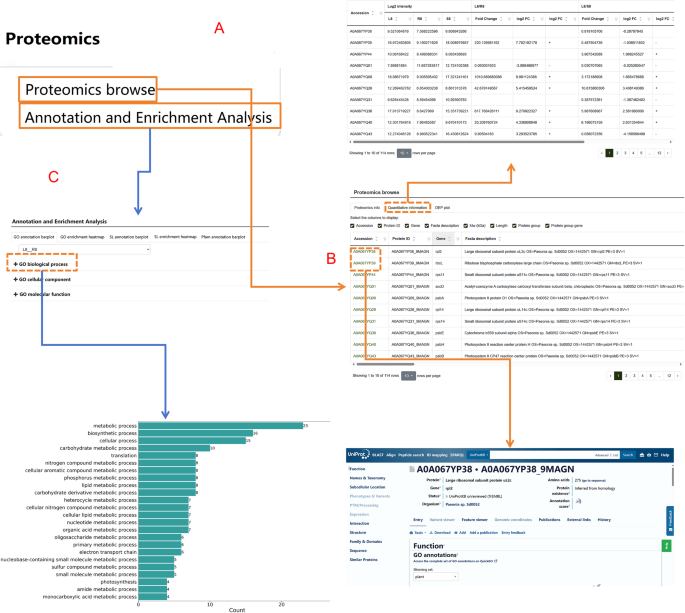
Functional highlights of the “Proteome” module. A Overview of the proteome module and its subcategories. B Information table of proteins measured in P. lactiflora and their respective functions. C Comparative analysis of proteomic data across different samples
Search
On the Gene Search page, users can search for genes by entering a specific gene ID or a range of IDs (Fig. 8A). The search results display detailed information such as the start position, chromosome location, and protein annotation data from various databases for the queried gene. In addition, users can download nucleotide sequences of specified regions through the “Sequence Fetch” feature within the search module (Fig. 8B). By entering the start and end positions in the search box and clicking “Download,” users can retrieve all sequences within the specified range. For downloading multiple sequences, the Multiple Sequence Fetch feature is available (Fig. 8C). Users can input all desired regions into the “Region” search box and download multiple sequences simultaneously. This search tool supports both the search and download of genes from P. lactiflora as well as P. ludlowii.
Fig. 8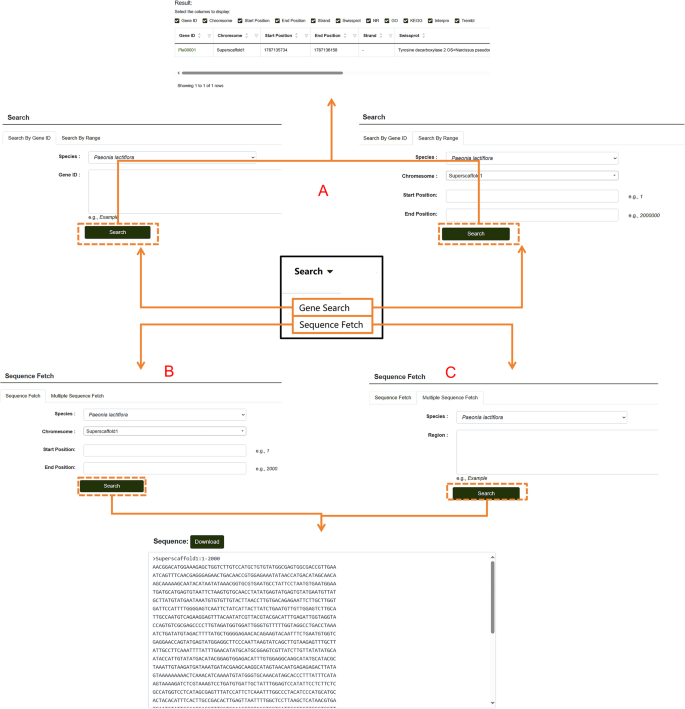
Database Search module. A Steps for searching individual genes within the database. B Guide to downloading single-sequence data from the P. lactiflora genomic database. C Instructions for downloading multiple sequence segments from the P. lactiflora genomic database
Tools
In the Tools module, the “BLAST” (Basic Local Alignment Search Tool) allows for nucleotide and protein sequence alignment. Users can click on “BLAST” and select options such as “Blastn Gene,” “Blastn Genome,” or “Blastp” based on their needs. Protein sequences or nucleotide sequences in FASTA format can be entered into the search box (the query format can be adjusted under “type of query”). By clicking the “Search” button below, users can obtain alignment results and download the sequences as needed (Fig. 9).
Fig. 9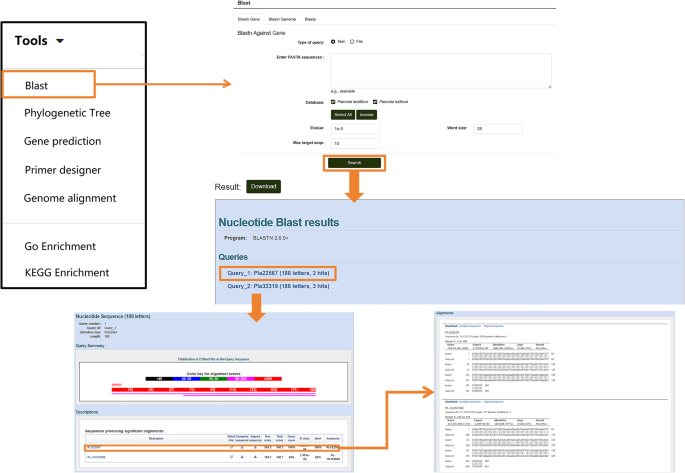
Nucleotide and Protein Sequence Alignment Tools in the “Tools” module. Details of the sequence alignment features available for nucleotide and protein sequences
Users can also click on “Phylogenetic Tree” to perform multiple sequence alignment analyses for nucleotide or protein sequences (Fig. 10A). After entering the desired sequences and running the tool, the module generates a phylogenetic tree using the maximum likelihood method directly from the alignment results. This tool is not limited to P. lactiflora-related sequences in the database; users can input sequences from other species into the search box to generate phylogenetic trees following the same steps. Results can also be downloaded. For homologous protein prediction, users can select the “Gene Prediction” option (Fig. 10B). Nucleotide and protein sequences can be entered into separate search boxes. Users can customize the model, algorithm, and other settings based on their needs, then click “Run” to obtain the results. This tool, like the others, is not restricted to sequences within the database. If users need to amplify a specific sequence, the database provides a “Primer Designer” tool (Fig. 11). On this page, users can manually input a sequence range or a specific sequence and adjust relevant parameters according to their requirements. Clicking “Search” initiates the primer design process.
Fig. 10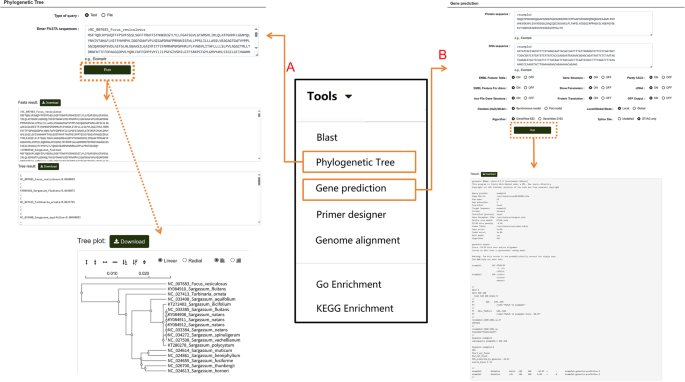
Multi-Sequence Alignment and Homologous Protein Prediction Tools in the “Tools” module. A Workflow and results of multi-sequence alignment analysis for nucleotide or protein sequences. B Steps and results for predicting homologous proteins
Fig. 11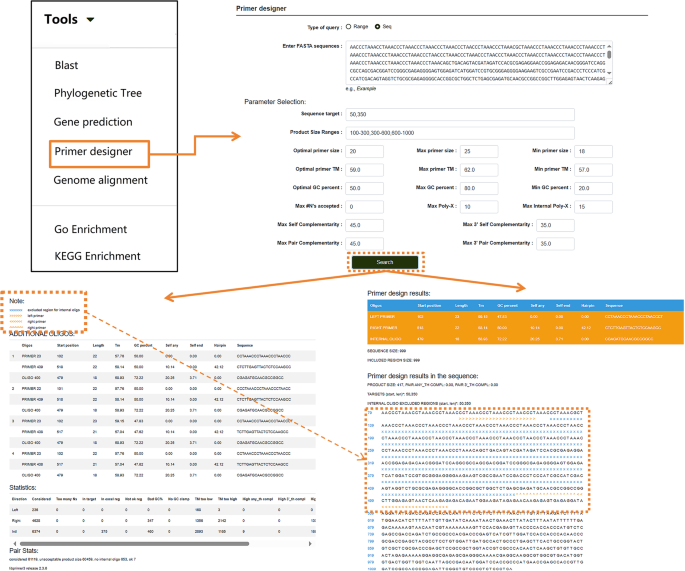
Primer design function under the “Tools” module. Arrows within the image indicate the step-by-step workflow
The database also supports large-scale genome analysis. Users can click “Genome Alignment” in the navigation bar, input gene sequences or FASTA format files into two search boxes, and click “Run” to obtain results for gene collinearity analysis (Fig. 12A). This module also supports the alignment of target sequences from other species, enabling flexible analysis tasks. To study the biosynthetic pathways of secondary metabolites, the database provides GO/KEGG enrichment analysis tools (Fig. 12B). Users can input gene IDs into the data box and click “Run.” The GO/KEGG results are presented in both tabular and graphical formats, providing clear and accessible data on the results page. Additionally, gene IDs obtained from other modules can be entered into this tool to analyze them in two protein databases, further expanding the analytical capabilities of the database.
Fig. 12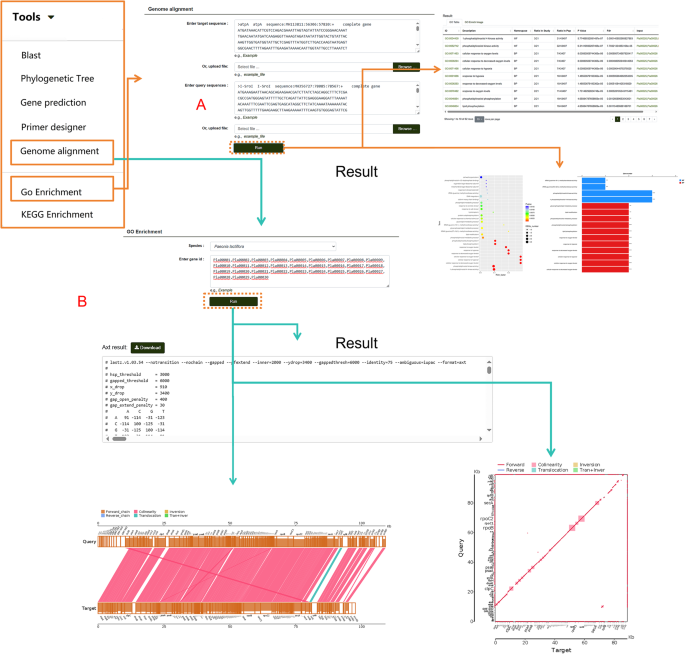
Genome Comparison and GO Enrichment Analysis Tools. A Demonstration of genome comparison tools and their corresponding results. B Features and output of GO enrichment analysis, including visual and tabular results