
U.S. corn growers are the most productive farmers in the world, but even highly productive farms can lose ground globally when they are forced to compete from a higher cost position. A new analysis prepared for the National Corn Growers Association by Kynetec compares what farmers in the U.S. and Brazil pay for major seed and crop protection inputs. The findings show that U.S. growers often pay more than their Brazilian competitors, a difference that matters for farm profitability, the global competitiveness of U.S. agriculture, rural economies, and the long-term strength of U.S. agriculture.
U.S. growers regularly pay more than Brazilian competitors for major seed and crop protection inputs.
U.S. farmers face elevated input prices when controlling for exchange rates.
The largest price premiums are found in corn seed, fungicides, herbicides, and some insecticides; the premiums are substantial enough to affect farm profitability and long-term competitiveness.
These price gaps remain broadly consistent across farm-size categories within both countries, suggesting that the differences are not limited to a particular segment of producers.
Differences in product availability, product mix, and market structure contribute to the input-cost gap. Brazilian markets include a larger share of lower-cost single active ingredients, generic products, and products supplied explained by manufacturers outside the major global R&D firms, while the U.S. markets are more heavily weighted toward premium premixes and products from large global manufacturers. However, significant price differences remain even when comparable products are examined.
Input costs are part of a broader competitiveness challenge that also includes production systems, infrastructure, land costs, logistics, and market access.
Greater transparency from input providers can help identify where cost differences reflect added value and where opportunities may exist to reduce unnecessary costs. A better understanding of the drivers of cost differences can help inform discussions among growers, suppliers, policymakers, and regulators.
U.S. farmers are increasingly interested in how their prices for key crop inputs compares with costs faced by major global competitors, especially Brazil. Yet comparing farm input costs across countries is not simple. Farmers in the U.S. and Brazil operate under different agronomic conditions, regulatory systems, tax structures, pest pressures, logistics networks, product markets, and average farm sizes, all of which can affect production and input purchasing decisions. Although Brazilian farms are generally larger on average, the analysis found that the relative price differences observed between U.S. and Brazilian growers remained largely consistent across farm-size categories within each country. The analysis does not assume every product or production system is directly comparable, but it provides a stronger basis for understanding broad cost differences across major input categories.
Publicly available benchmarks can show what farmers spend per acre or per bushel, but those figures often do not capture differences in product formulations, application rates, taxes, currency effects, or the technologies embedded in seed and crop protection products or the prices, or implied unit prices paid for those products. NCGA partnered with Kynetec to help reduce those comparability challenges. Kynetec maintains a comprehensive global input-price database built from direct farmer-panel data collected from thousands of growers, providing a more detailed and grounded view of what producers in each country are actually paying than is available through public data sets alone. This analysis is focused on seed and pesticide products; fertilizer is notably not evaluated in this report because the Kynetec data available on fertilizer pricing is less robust.
The analysis considers both corn and soybeans, reflecting the central role these crops play in the agricultural economies of both countries. The U.S. is the world’s largest corn producer, while Brazil is the largest soybean producer. In both countries, many farmers grow both corn and soybeans, but the relationship between the crops differs. In the U.S., corn and soybeans are generally grown as alternative crops on the same acres, with only one crop produced each year. In Brazil, however, a large majority of the corn crop follows soybeans, allowing both crops to be produced on the same land within a single annual cycle. These differences in crop rotation and production systems affect how farmers invest in seed, crop protection products, machinery, and land, making direct crop-by-crop cost comparisons more challenging. As a result, evaluating both crops together provides a more complete picture of the relative cost competitiveness of U.S. and Brazilian agriculture.
The Kynetec analysis shows a consistent pattern: U.S. farmers often pay more than Brazilian farmers for comparable seed and crop protection inputs for both corn and soybeans. The size of the gap varies by crop, input category, product type, and year, but the broader finding is clear: Input-cost differences are large enough to matter for farm margins and long-term viability. The analysis does not assume products are identical across countries but focuses on comparable inputs to identify broad cost
differences.
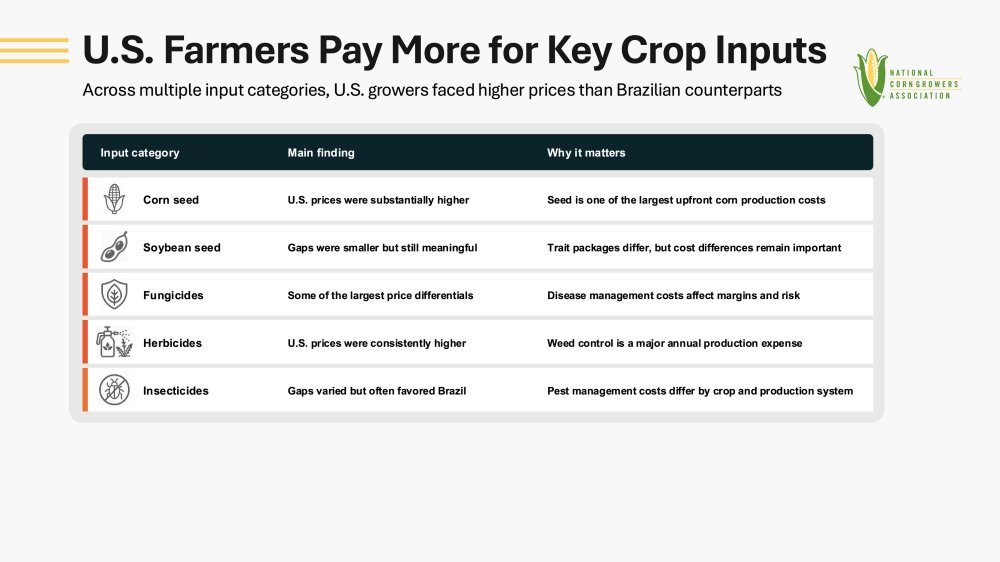
Corn seed prices were substantially higher in the United States vs. Brazil over the recent five-year period. Across all corn seed comparisons, U.S. prices were considerably higher, averaging a 68% premium over Brazil from 2023 to 2025 when both summer and winter corn are included. The gap remained substantial even against Brazil’s higher-cost summer corn, with U.S. prices 63% higher than summer corn and 74% higher than winter corn. Seed traits and production systems differ between countries, but a notable gap remains even when comparing widely used trait packages. Manufacturer-level comparisons show the difference is not limited to a single company or product line; major brands show sizable U.S. price premiums as well.
Soybean seed gaps are smaller overall but still important. The price gap for soybean seed is smaller than the gap for corn seed, but it still matters for farm budgets. Overall, soybean seed prices were higher in the United States, with a 24% U.S. premium on average from 2023 to 2025. One important caveat is that soybean seeds are not identical across the two countries. In Brazil, most soybean varieties include both herbicide and insect resistance, while U.S. farmers more commonly use herbicide-only varieties. Even so, the premium for herbicide-resistant soybean seed was larger to the broader soybean seed gap, despite much of the Brazilian seed included insect resistance. That makes the comparison especially noteworthy and reinforces that farmers are paying not just for seed, but for the traits, pest-management tools, and risk protection built into their production systems.
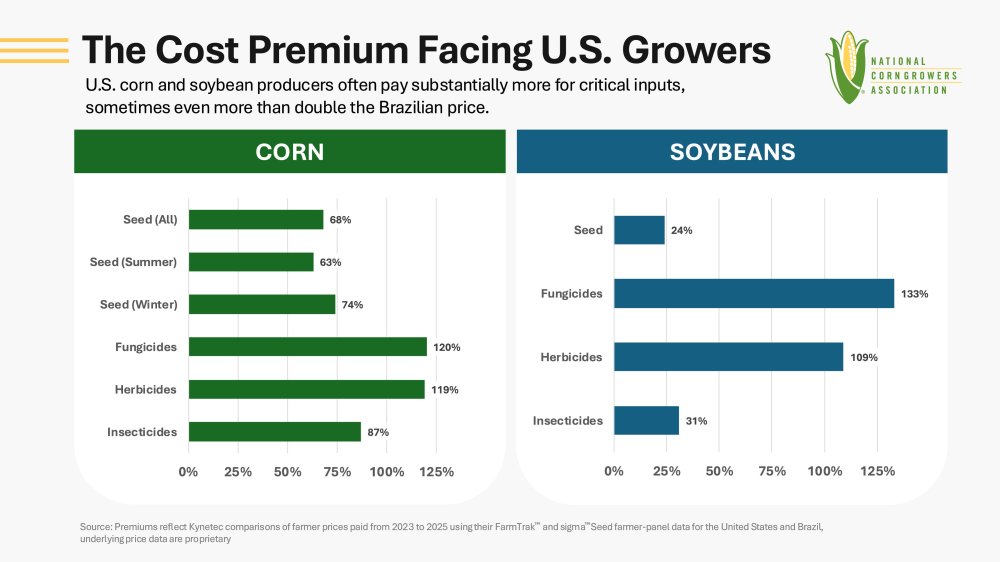
Fungicides show some of the largest price differences. Kynetec’s crop protection comparisons show very large U.S. price premiums for fungicides in both corn and soybeans, with some comparisons showing U.S. prices more than double Brazilian levels depending on the crop, product category, active ingredient, and year. Part of that difference reflects the different structure of the two markets. In Brazil, the top five global R&D manufacturers account for less than half of the fungicide supply for both crops, compared with roughly three-quarters or more of the market in the U.S. Products from global R&D manufacturers generally carry a higher value per unit than products from other manufacturers, including generics or older active ingredients. Brazil also uses a larger share of lower-cost fungicide treatments, while U.S. growers more often use higher-cost, multi-molecule formulations. Even when the comparison is narrowed to single active ingredients used in both countries, notable price differences remain.
Product mix and market structure help explain part of the observed cost differences. Across several crop protection categories, Brazilian growers rely more heavily on lower-cost single active ingredients, generic products, and products supplied by manufacturers outside the major global R&D firms. U.S. growers, by contrast, are more likely to use premium premixes and products from large global manufacturers. These differences in product mix contribute to higher average prices paid by U.S. growers, particularly in fungicides and herbicides. Regulatory differences between the two countries likely contribute to these market outcomes by influencing the speed of generic product approvals, the duration of brand-name pricing power, and the viability of domestic manufacturing.
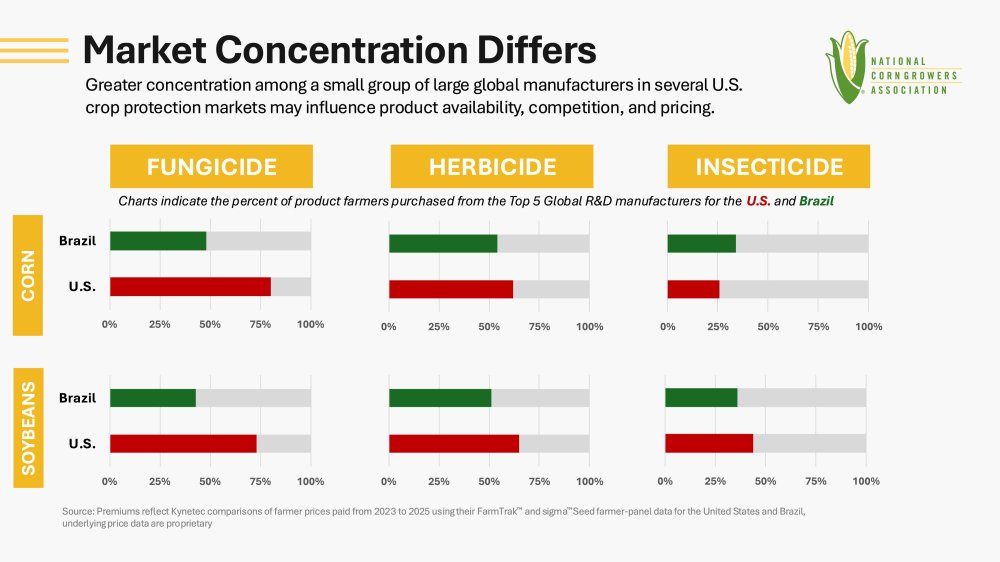
The fungicide market provides the clearest example. In Brazil, less than half of fungicide volume comes from the five largest global R&D manufacturers, compared with roughly three-quarters or more in the United States. Products supplied by these manufacturers command substantially higher prices in both countries, while lower-cost generic products and older active ingredients account for a larger share of the Brazilian market. As a result, more than 40% of fungicide treatments in Brazil fall into lower-price categories, compared with less than 10% in the United States.
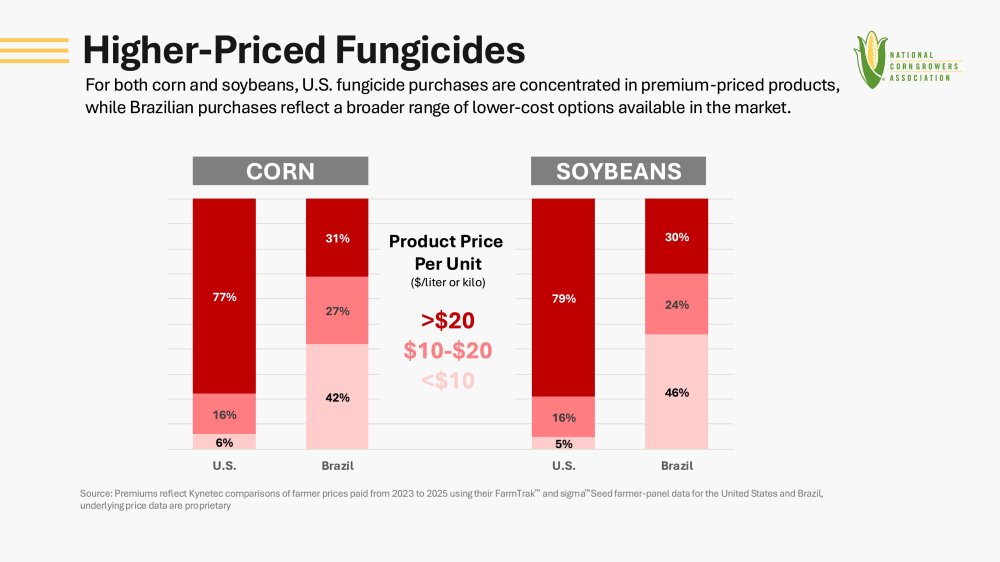
These market-structure differences do not fully explain the U.S.-Brazil price gap. Kynetec’s molecule-level comparisons show that price differences often remain even when comparing similar active ingredients used in both countries. The findings suggest that both product mix and underlying pricing differences contribute to the higher costs paid by U.S. growers.
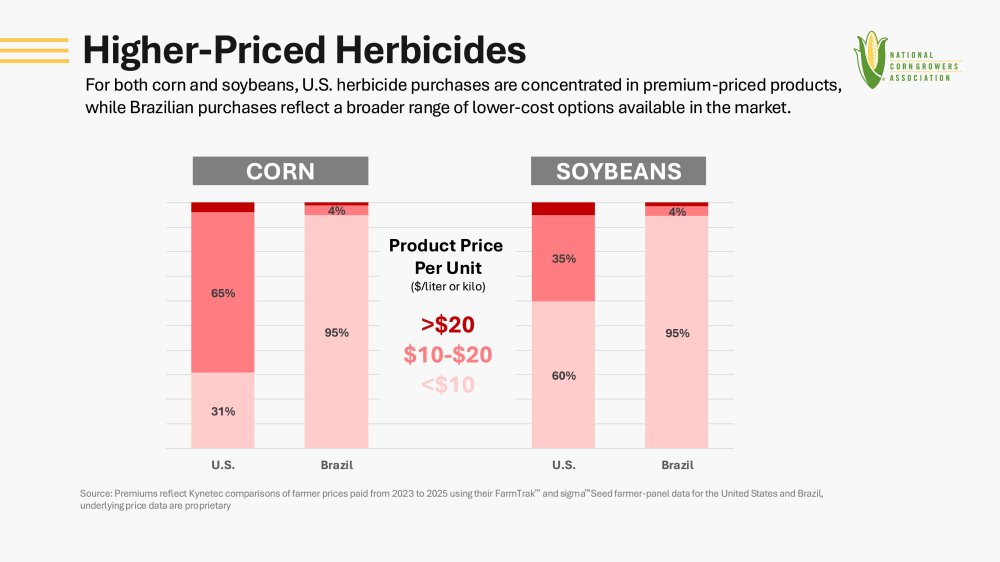
Herbicide prices were consistently higher in the United States. Across corn and soybeans, Kynetec reports that U.S. herbicide prices were higher than Brazilian prices, with many comparisons showing U.S. prices near double Brazil’s levels. The herbicide market structure is more similar across the two countries than the fungicide market, but important differences remain. The top five global R&D manufacturers lead in both markets and hold a somewhat larger share in the U.S. than in Brazil. Their products carry a premium in both countries, but that premium is much larger in the U.S., reflecting a greater share of more complex formulations. Brazil relies more heavily on lower-cost active ingredients, while U.S. growers use some of those same molecules alongside more expensive formulations. Widely used active ingredients in both countries, including glufosinate, 2,4-D, atrazine, mesotrione, and S-metolachlor, followed the overall trend of higher U.S. prices. Even glyphosate, a more commoditized active ingredient used broadly in both markets, tracked more closely than other herbicides but still cost U.S. growers about 35% more than Brazilian growers in 2025.
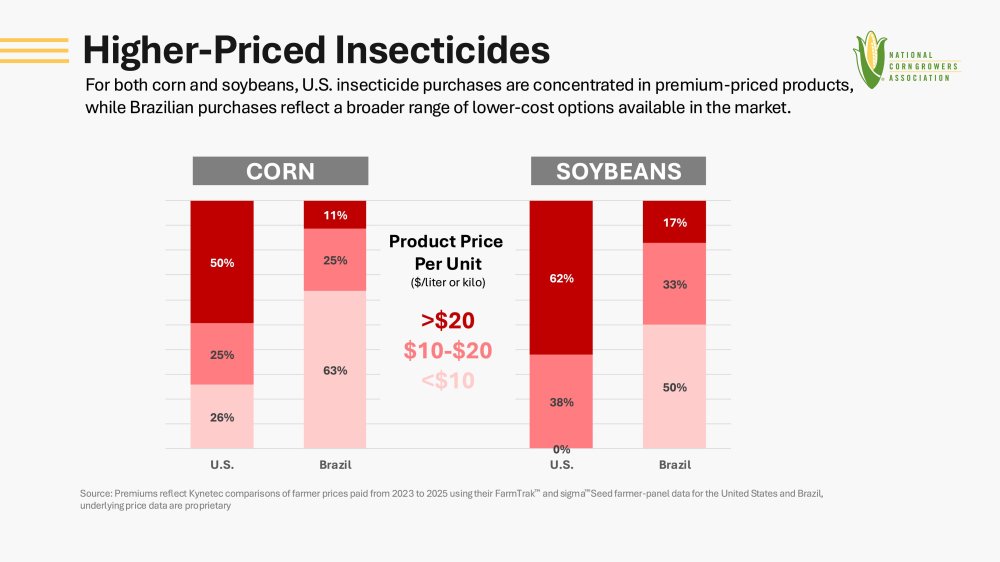
Insecticide gaps varied by crop but often favored Brazil. Kynetec’s results show that U.S. corn insecticide prices were materially higher than Brazilian prices, averaging 87% higher from 2023 to 2025. The soybean insecticide gap was smaller, averaging 31% over the same period, but still meaningful. Molecule-level comparisons reinforce the general finding that Brazilian growers often pay less for the same or similar active ingredients. Unlike some other crop protection categories, local manufacturers dominate the insecticide market in both countries. Products from global R&D manufacturers carry a premium over local or generic alternative in both markets, but that relative premium is more similar across the U.S. and Brazil than other categories. The larger difference is in product mix: Brazil uses a higher share of lower-cost molecules, including roughly 60% of corn insecticide treatments and 50% of soybean insecticide treatments, while U.S. growers more often use different molecules or more expensive premixes.
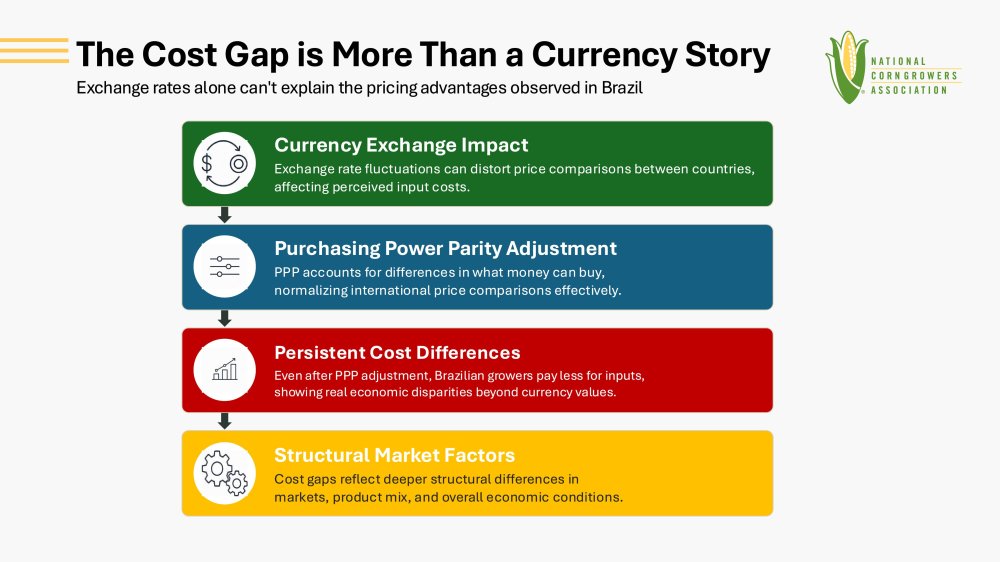
Currency differences do not fully explain the cost gap. Kynetec also adjusted the data to account for differences in currency and purchasing power. In plain terms, this helps answer a key question: are Brazilian prices lower simply because of exchange rates, or do growers still pay less after accounting for what money buys in each country? The purchasing power parity findings indicate that Brazilian growers still have a meaningful advantage, on average, for many input categories after accounting for purchasing power, suggesting the price gap reflects underlying differences in market structure, product mix available, and cost conditions, not currency alone. This reinforces the central finding that cost differences between the U.S. and Brazil are rooted in the structure of input markets and production systems, not just exchange-rate movements.
These differences are not just statistical. Even accounting for differences in product mix and production systems, the consistency of the gaps indicates that underlying cost differences – driven by market structure, product availability, and cost conditions – still matter for farm-level outcomes. They directly affect farm margins, risk management decisions, and long-term viability. The remaining sections explore what is driving these differences, and what they mean for U.S. growers moving forward.
For growers, this is not just about paying more for inputs, it’s about what those higher costs mean for margins, risk management, and the ability to stay competitive year after year. These implications describe how cost differences are affecting growers today. The next section outlines potential steps to address them.
Margin pressure is becoming a structural pressure on farm viability. Higher input prices matter most when commodity prices are weak. When U.S. growers face sustained premiums for seed and crop protection products, they have less room to absorb lower corn prices, higher interest rates, cash rent increases, or weather-related yield losses. Over time, that pressure reduces financial resilience and limits the ability to invest in new technologies, conservation practices, and productivity.
Input-cost transparency should be part of the broader conversation about cost structure and market function. The Kynetec analysis provides new insight into what growers are experiencing on the ground and strengthens the foundation for discussions with policymakers, regulators, suppliers, and farmers. The goal is to better understand why cost differences exist – where they reflect real value, and where there may be opportunities to reduce unnecessary costs.
Brazil’s logistics improvements are changing the export equation. U.S. agriculture has long benefited from an efficient transportation system, but Brazil is closing part of the gap through continued investments in rail, barge, highway, and port infrastructure. As Brazil lowers its cost to move grain and expands export capacity, disadvantages to the U.S. grower in the former of higher costs to grow the same global commodity threatens the U.S. position that much more.
Farm policy should reflect the full cost of staying competitive. Farmers are managing rising costs across nearly every part of their operation, including seed, crop protection, fertilizer, transportation, interest, and land. If the goal is to keep U.S. farms competitive and financially resilient, input costs need to be part of broader discussions about farm programs, crop insurance, conservation, trade, biofuels, infrastructure, competition, and regulation. Additionally, the recent use of the countervailing duty process by ag input providers only amplifies the problem of high input costs. The interests of farmers, and more broadly, of all American citizens, should be a consideration when these decisions are being made.
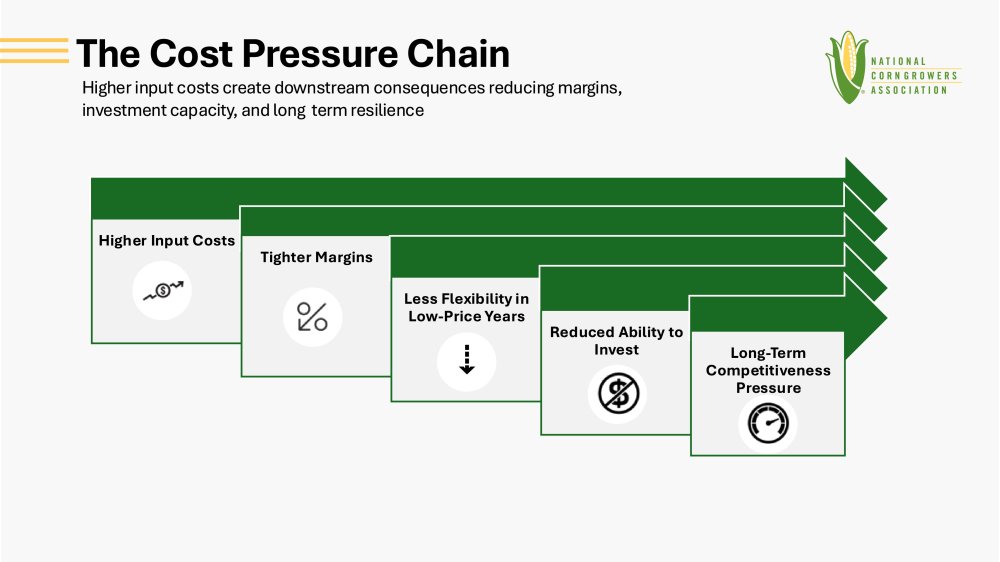
The findings in this report point to a clear conclusion: sustained high input costs for U.S. growers are a threat to their ability to continue competing globally. While growing markets for U.S. corn is a top priority for NCGA, the cost side of the balance sheet cannot be ignored when examining what corn growers need to improve the current economic outlook.
Improve input market transparency and competition. Greater transparency is a critical first step toward understanding where price differences reflect real value, and where they may reflect limited competition or structural inefficiencies. Better information can support more informed decisions by growers, policymakers, and market participants, and help ensure that input markets are working in a competitive and efficient way.
Support access to competitive products and technologies. Differences in product availability, including access to generic or lower-cost alternatives, can influence cost structures across countries. Policies that maintain strong safety and stewardship standards while enabling timely access to competitive inputs can help reduce unnecessary cost pressures and improve producer choice.
Ensure farm policy reflects the realities of the modern cost environment. U.S. farmers are managing cost pressures across their entire operation including inputs and land. Farm safety net programs, including commodities, crop insurance, conservation, and trade policy all can play a role in helping producers manage risks and respond to disasters and economic hardships. As costs remain elevated, federal policy discussions should reflect the cumulative impact of these pressures on farm viability and global competitiveness.
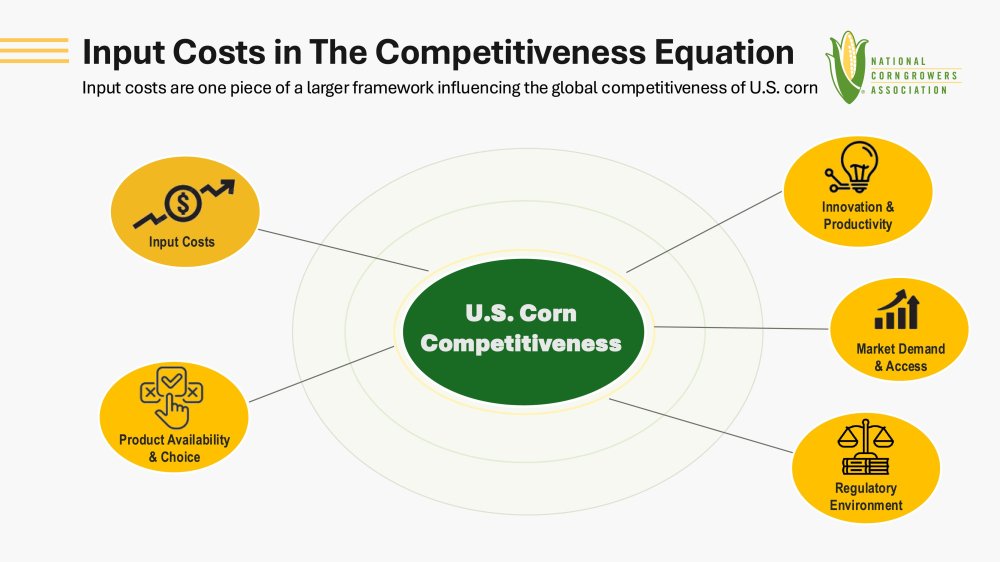
The Kynetec analysis sends a clear warning: U.S. corn growers remain among the most productive and innovative farmers in the world, but persistent cost disadvantages are challenging their ability to compete globally. The findings show that U.S. growers often pay more than Brazilian competitors for key seed and crop protection inputs, with the largest gaps occurring in corn seed, fungicides, and herbicides. These differences are not explained by exchange rates alone and remain broadly consistent across farm-size categories. Product availability, product mix, and market structure explain part of the gap, but meaningful price differences often remain even when comparable products are examined.
The goal of this analysis is not to suggest that every product or production system is directly comparable across countries. Rather, it is to better understand the cost environment facing U.S. growers and identify where meaningful differences exist. The findings show that higher costs for key seed and crop protection inputs are not isolated to a single product, company, or category. Instead, they reflect a broader pattern that warrants greater attention from growers, industry stakeholders, policymakers, and regulators.
For NCGA, these findings underscore the importance of improving transparency, strengthening market opportunities, investing in infrastructure, and ensuring that public policy reflects the realities of today’s cost environment. U.S. farmers can compete and continue to lead globally but maintaining that position will require continued attention to the factors that influence both costs and demand. As global competitors continue to invest, adapt, and expand, preserving U.S. leadership will require more than productivity alone – it will require an economic environment that allows growers to compete on a level playing field.
Bottom line: U.S. farmers remain among the most productive in the world, but productivity alone cannot overcome a persistent cost disadvantage. Long-term competitiveness requires both productivity and a cost structure that allows
growers to compete globally.
Source: Kynetec analysis prepared for the National Corn Growers Association, using FarmTrak™ and sigma™Seed farmer-panel data for the United States and Brazil.
The analysis compares what growers in the United States and Brazil pay for key crop inputs, including seeds, fungicides, herbicides, and insecticides, across corn and soybeans. The study period covers 2023 to 2025, with trend analysis spanning the last five years. Seed prices are compared in U.S. dollars per pound, converted from per-bag pricing. Crop protection inputs are compared in U.S. dollars per liter or kilogram of product, with active-ingredient-level comparisons where possible. Taxes are excluded. Purchasing power parity analysis is used to help separate currency effects from underlying market differences.