

Growth of Mn atomic bilayer on Ag(111)
Figure 1a represents the STM topographic overview of 1.0 ± 0.1 atomic layers of Mn deposited onto Ag(111) surface at 200 K. On the contrary to the pseudomorphic growth of monolayer (ML) Mn with fcc stacking45, the double layer (DL) Mn appears with periodic reconstruction lines (DL MnR) as a relief of uniaxial strain, forming three rotationally symmetric domains. It is noted that surface reconstruction lines from uniaxial strain relief have been reported on the bcc(110)-like structure when bcc materials are epitaxially grown on top of fcc(111) substrates for matching crystalline orientation and reducing lattice misfit46,47,48,49,50. In addition to DL MnR, there is also pseudomorphic strained area of DL Mn (DL MnS) as marked by the black arrow in Fig. 1b, c displays the zoom-in image acquired from Fig. 1a (white square frame), and the corresponding tunneling conductance (\({{{\rm{d}}}}I/{{{\rm{d}}}}U\)) maps reveal that the appearance of reconstruction lines depends strongly on bias voltages, e.g., Fig. 1d (−0.6 eV) and Fig. 1e (+0.6 eV), suggesting different electronic contributions as a consequence of distinct local atomic arrangement (see Supplementary Fig. S1).
Fig. 1: Topographic overview of ML and DL Mn on Ag(111).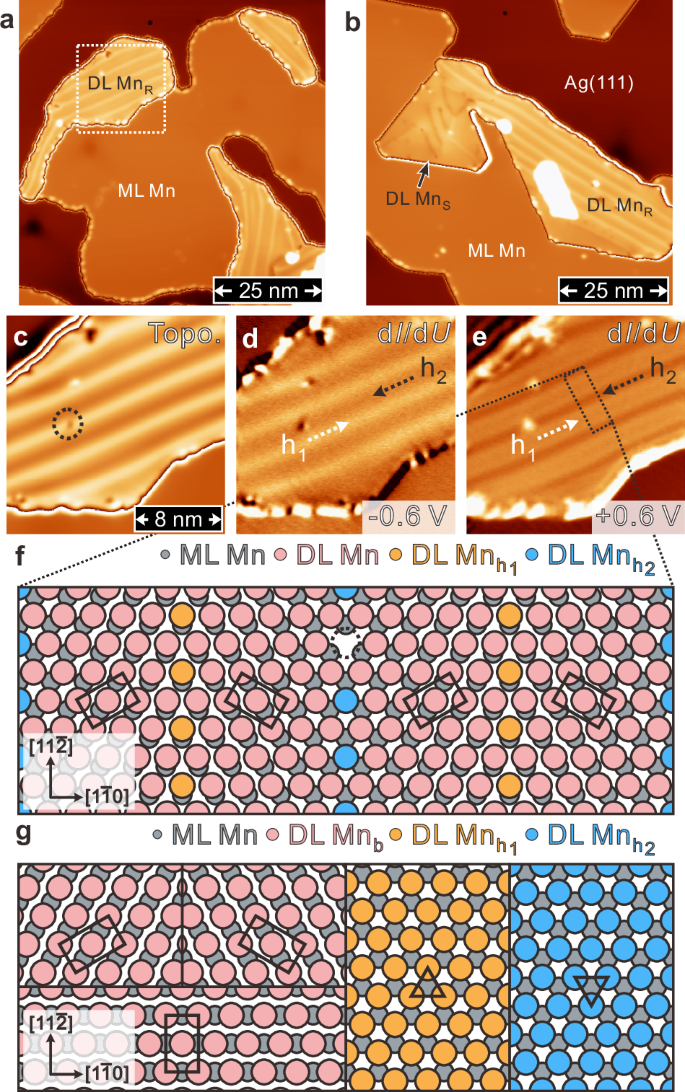
a STM topographic overview of 1.0 ± 0.1 atomic layer of Mn deposited onto Ag(111) surface, where ML Mn is pseudomorphically grown and DL Mn can be not only reconstructed (DL MnR) with three rotationally symmetric domains, but also pseudomorphically strained (DL MnS) as indicated by the black arrow in (b) (scan parameters: \(U=+ 1.0\) V, \(I=1.0\) nA). c Zoom-in topography from the white square frame in (a) and corresponding \({dI}/{dU}\) maps at U = −0.6 and +0.6 V have been shown in (d, e), respectively. f The DL MnR structure model in which the DL Mn is compressed about 9 % along [\(1\bar{1}0\)] direction on top of the pseudomorphic ML Mn, resulting in local bcc(110)-like areas (black rectangles) separated by reconstruction lines (orange, blue) on atomic hollow sites. Black dashed empty circle in (c) marks a surface defect, presumably single atomic vacancy as depicted in (f). g Bridge and hollow site stackings of DL MnS.
To mimic the feature of surface reconstruction lines in DL MnR, the atomic structure model composed of an uniaxially compressed Mn top layer above the pseudomorphic Mn bottom layer has been constructed in Fig. 1f, where 11 Mn atom distances (top layer) have been placed over 10 Mn atomic separations (bottom layer) along the [\(1\bar{1}0\)] direction (see Supplementary Fig. S2). This ratio turns out having about 9% uniaxial compression, leading to the bcc(110)-like areas (black rectangles) mirrored symmetrically in between alternating fcc- and hcp-like stacking lines. The deduced period of reconstruction lines is 2.89 nm from Fig. 1f, which is in line with 2.9 ± 0.1 nm from Fig. 1c measured experimentally. Note that both period and direction of reconstruction lines might deviate slightly from the ideal structure model in Fig. 1f, reflecting a manifestation of atomic strain relaxation varied locally. Fig. 1g displays the structure models of DL MnS, where bridge- and hollow-site stackings have been illustrated. It is also denoted that atomic resolution images on top surface layer of DL MnR and DL MnS provide additional support on the structure models of Fig. 1f, g49,50(see Supplementary Fig. S3).
SP-STM on the reconstructed Mn bilayer
After recognizing the growth of DL MnR and DL MnS on Ag(111), SP-STM measurements have been performed to map out real-space magnetic spin structures with atomic resolution37,38,39,51 (see Supplementary Fig. S4). As shown in Fig. 2a, magnetic periodic stripes are observed on the DL MnR by using a bulk Cr tip and they appear with an angle of about 60° relative to the reconstruction lines along the symmetry-equivalent [\(11\bar{2}\)] direction. Fig. 2b presents the topographic line profile measured from the black dashed line of Fig. 2a and the period of magnetic stripes about 0.85 ± 0.1 nm has been extracted from the DL MnR. Note that magnetic stripes on the DL MnR exist for three rotationally symmetric domains and they all have a period of about 0.85 ± 0.1 nm (see Supplementary Fig. S5). In addition to the bulk Cr tip, the same period as well as a phase shift of magnetic stripes have been identified by using Fe coated W tip under an external magnetic field. This supports a noncollinear spin spiral (SS) state that also exhibits the stripe-like magnetic contrast as reported on the ML and DL Mn films on refractory W substrates37,38,39 (see Supplementary Fig. S6).
Fig. 2: Cycloidal SS revealed on DL MnR/Ag(111).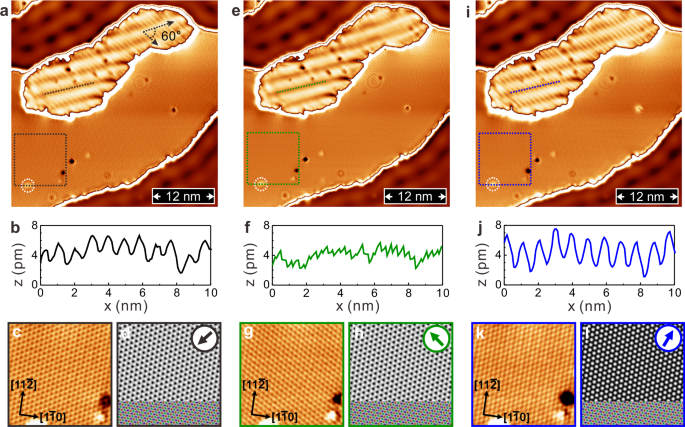
a SP-STM topographic image on DL MnR, where cycloidal SS, i.e., periodic stripe-like pattern, appears with an angle about 60° to reconstruction lines. b The cycloidal SS period about 0.85 ± 0.1 nm has been extracted from topographic line profile (black dashed line in a). c, d ML Mn Néel state (black square frame from a) together with simulated SP-STM image determine the in-plane tip magnetization direction (black arrow in d). e Magnetic contrast of cycloidal SS on DL MnR nearly vanishes after changing to the second in-plane tip magnetization, which can be supported by line profile in (f). The corresponding in-plane tip direction can be deduced from ML Mn Néel state in (g) and SP-STM simulation in (h). i The cycloidal SS appears again on DL MnR with the third in-plane tip magnetization, which can be verified by line profile in (j). Through ML Mn Néel state in (k) and SP-STM simulation in (l), the third in-plane tip magnetization can thus be characterized. (scan parameters for a, e, i: U = +10 mV, I = 1.0 nA).
Apart from the SS of DL MnR, the 120° AFM Néel spin structure of ML Mn has also been revealed in Fig. 2c, which reproduces the results reported by Gao et al.45. Note that Fig. 2c is acquired from the black square frame in Fig. 2a, where a landmark can be referred to the white dashed circle of single atomic defect. Since the atomic spins of 120° Néel state of ML Mn align on the surface in-plane direction45, it can serve as a magnetic reference to calibrate the in-plane direction of tip magnetization (see Supplementary Fig. S7). By combining experimental and simulated SP-STM images on the ML Mn of Fig. 2c, d, the in-plane tip magnetization of Fig. 2a has been deduced in the inset of Fig. 2d (black arrow). Aside from the in-plane tip magnetization, one should not rule out the existence of an out-of-plane tip component (see Discussion for details).
Fig. 2e shows the SP-STM image at the same location as in Fig. 2a, but with the second direction of in-plane tip magnetization obtained by applying a small voltage pulse to the bulk Cr tip at a distant sample position. Interestingly, there is an absence of magnetic SS contrast on the DL MnR with this second in-plane tip magnetization direction, which can be further supported by the topographic line profile (green dashed line from Fig. 2e) in Fig. 2f. While the magnetic SS disappears on the DL MnR in Fig. 2e, the Néel state spin contrast remains observed on the ML Mn (see zoom-in image in Fig. 2g). Through an atom-by-atom comparison between Fig. 2g and the simulated SP-STM image of Fig. 2h, the second direction of in-plane tip magnetization can be identified in the inset of Fig. 2h (green arrow) (see Supplementary Fig. S8).
Moreover, Fig. 2i demonstrates the return of magnetic SS contrast on the DL MnR by exploiting the third in-plane tip magnetization prepared through the voltage pulse method described above. On top of that, the topographic line profile in Fig. 2j (blue dashed line from Fig. 2i) restores the periodic modulation of about 0.85 ± 0.1 nm of magnetic SS on the DL MnR. According to the observed contrast on the Néel state of ML Mn in Fig. 2k (blue square frame from Fig. 2i) and the resultant SP-STM simulation image of Fig. 2l, the third direction of in-plane tip magnetization can be derived in the inset (blue arrow). Note that the subtraction analyses of two antiparallel magnetic tip configurations52,53 have been applied to verify the magnetic signals on DL MnR (see Supplementary Fig. S9). It is also worth mentioning that the sharp step edge and the atomically-resolved Néel state of ML Mn indicate the absence of considerable tip shape change after a small voltage pulse. As a result of SP-STM measurements on the magnetic SS of DL MnR with three different in-plane tip magnetizations, the propagation direction of the SS lies in the rotation plane of atomic spin, leading to a cycloidal SS that is unexpected from the weak interfacial DMI for atomic Mn bilayer on Ag(111).
SP-STM on the pseudomorphic Mn bilayer
Besides uncovering the cycloidal SS state of DL MnR, we have also employed SP-STM to atomically resolve the magnetic spin texture on DL MnS. Fig. 3a shows the magnetic image on DL MnS obtained by SP-STM with a bulk Cr tip, where a rectangular spin lattice consisting of two periodic stripes has been revealed on each of three rotationally symmetric domains. It is worth mentioning that such rectangular spin lattice can not be observed on DL MnS with a nonmagnetic tip, insinuating its magnetic origin. Other than that, Fig. 3b represents the Néel state with an AFM domain wall on ML Mn45 (black dashed rectangular from Fig. 3a), which can be combined with the simulated SP-STM image in Fig. 3c to determine the in-plane tip magnetization direction as the black arrow sketched in the inset (see Supplementary Fig. S10). Note that the potential contribution of out-of-plane tip component has been examined (see Discussion for details). Fig. 3d represents the topographic line profiles of two periodic stripes from the rectangular spin lattice at the bottom domain of DL MnS, i.e., black and gray lines in Fig. 3a, the resultant periods are 0.7 ± 0.05 nm and 0.5 ± 0.05 nm along high symmetry [\(11\bar{2}\)] and [\(1\bar{1}0\)] axes, respectively. Note that these two periods are equivalent to those extracted from the other two rotational domains (see Supplementary Fig. S11).
Fig. 3: Magnetic superposition state uncovered on DL MnS/Ag(111).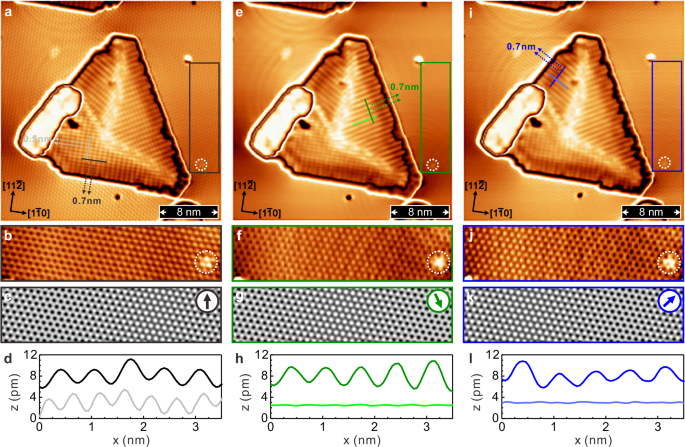
a SP-STM topographic image on the DL MnS, where rectangular spin lattice on each of three rotationally symmetic domains has been revealed. By comparing the ML-Mn Néel state in b (black rectangle frame from a) with simulated SP-STM image in (c), in-plane tip magnetization direction can be deduced (black arrow in c). The rectangular spin lattice consisting of two magnetic periods of 0.7 ± 0.05 nm and 0.5 ± 0.05 nm can be extracted from topographic line profiles (black and gray lines from a) in (d). e SP-STM topography with the second in-plane tip magnetization that can be derived from ML-Mn Néel state in (f) and SP-STM simulation in (g). By using second in-plane tip magnetization, only magnetic stripe with the period of 0.7 ± 0.05 nm has been resolved in upper right domain, which can be verified by line profiles in (h). i Only magnetic stripe with the period of 0.7 ± 0.05 nm has been observed in upper left domain by the third in-plane tip magnetization that can be identified from ML Mn Néel state in (j) together with SP-STM simulation in (k). Topographic lines profiles in (l) support the presence of 0.7 ± 0.05 nm magnetic stripe in upper left domain. (scan parameters for a, e, i: U = +10 mV, I = 1.0 nA).
By means of a small voltage pulse onto the Cr tip as aforementioned, the magnetic image of Fig. 3e with the second in-plane tip magnetization has been obtained. Based on the change of magnetic spin contrast on ML Mn of Fig. 3f, i.e., acquired from green square frame of Fig. 3e, as well as the comparison with SP-STM simulation in Fig. 3g (see Supplementary Fig. S10), the second in-plane tip magnetization has been deduced as the green arrow depicted in Fig. 3g. Instead of rectangular spin lattice formed by two periodic stripes, interestingly, there is only one stripe contrast left with a period of 0.7 ± 0.05 nm in the upper right domain of Fig. 3e, which is distinct from the other two domains (upper left and bottom). This observation can also be confirmed by the line profiles in Fig. 3h: there is a periodic modulation from the green line, but not the case of light green line. Note that green and light green lines are measured directly from the upper right domain in Fig. 3e. Furthermore, by repeating the same tip treatment again, Fig. 3i displays the magnetic image resolved by the third in-plane tip magnetization, which can be inferred from the zoom-in magnetic image of ML Mn in Fig. 3j together with the corresponding SP-STM simulation in Fig. 3k (see Supplementary Fig. S10). With the third in-plane tip magnetization (blue arrow in the inset of Fig. 3k), one can observe that the upper left domain has only one periodic stripe of 0.7 ± 0.05 nm(Fig. 3i), which can be further corroborated by the line profiles (blue and light blue lines in Fig. 3i) plotted in Fig. 3l. Note that concentric ring-like structures on ML Mn in Fig. 3a, e and i arise from the Ar-ion nanocavities buried underneath Ag(111) after the sample sputtering and annealing processes, leading to the standing wave patterns, i.e., so called Friedel oscillations, on the sample surface53,54,55.
Since the identical period has also been observed for the 0.7 ± 0.05 nm magnetic stripe by an out-of-plane magnetized tip, the magnetic spin structure of SS might thus be anticipated (see Supplementary Fig. S6). The magnetic stripe period of 0.5 ± 0.05 nm matches twice the atomic spacing along [\(11\bar{2}\)] of DL MnS/Ag(111), implying a local AFM state locked onto the atomic lattice. Most importantly, one can clearly see the coexistence of these two magnetic stripes from a series of SP-STM measurements with different in-plane tip directions in Fig. 3a, e, i. Taking these observations into account, we could therefore arrive at a 3D spin configuration on the basis of magnetic SS superposed with atomic row-wise AFM order on the DL MnS/Ag(111).
First-principles calculations
In order to understand the magnetic properties of Mn bilayers on Ag(111) and to explain the experimental SP-STM results on the pseudomorphic and the reconstructed areas, we have performed DFT calculations (see “Methods”, Supplementary Table 1 and Note 1). Since the unit cell of the reconstructed Mn bilayer (Fig. 1f) is computationally not feasible within DFT, in particular, since noncollinear spin states need to be explored, we have considered a pseudomorphic Mn bilayer in which the Mn atoms of the top layer are in either bridge or fcc hollow site stacking (cf. Fig. 1g). Note that these two types of stackings appear locally within the surface reconstruction (Fig. 1f and Fig. 4). Because of the small influence of the Ag substrate (see Supplementary Note 2), fcc and hcp stacking at the hollow site are very similar (see Supplementary Table 1), which is why only the fcc stacking is presented here. We begin with the SS states because they represent the fundamental solutions of the Heisenberg model on a periodic lattice and thus allow us to scan a large part of the magnetic phase space.
Fig. 4: Local domains of the reconstruction.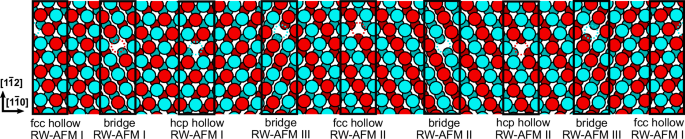
Sketch of the RW-AFM state within the model of DL MnR. Blue and red circles denote Mn atoms with opposite spin directions. The structural domains of fcc hollow, hcp hollow and brigde site each splits into different magnetic sub-domains, which are named below the sketch. Dashed circles are used to show the nearest-neighbor spin alignment between top and bottom layer Mn atoms.
Bridge site stacking of the Mn bilayer
First, we discuss the energy dispersion of homogeneous SSs obtained via DFT for the DL Mn in bridge site stacking on Ag(111) (Fig. 5a). A SS is characterized by a wave vector q from the 2D Brillouin zone (2D-BZ) along which it propagates. The normalized spin moment at site Ri is given for a flat SS by \({{{{\bf{s}}}}}_{i}({{{\bf{q}}}})={\hat{{{{\bf{e}}}}}}_{1}\cos ({{{{\bf{R}}}}}_{i}\cdot {{{\bf{q}}}})+{\hat{{{{\bf{e}}}}}}_{2}\sin ({{{{\bf{R}}}}}_{i}\cdot {{{\bf{q}}}})\) where the orthonormal vectors \({\hat{{{{\bf{e}}}}}}_{1}\) and \({\hat{{{{\bf{e}}}}}}_{2}\) span the rotation plane of spins. The SS vectors q were chosen along each unique high symmetry path in reciprocal space, which is larger than that of the hexagonal 2D-BZ because the second magnetic layer partially breaks its symmetries (Fig. 5c). At the high symmetry points we obtain collinear magnetic states: the FM state at the \(\overline{\Gamma}\) point, the layered AFM state with FM alignment of the magnetic moments within top and bottom layer and AFM alignment between the two layers at the \(\overline{{\Gamma }^{{\prime} }}\) point, and the row-wise AFM (RW-AFM) I and II states at the \(\overline{{{{{\rm{M}}}}}^{{\prime} }}\) and \(\overline{{{{\rm{M}}}}}\) points, respectively.
Fig. 5: Energy dispersion of SSs for DL Mn in bridge site stacking on Ag(111).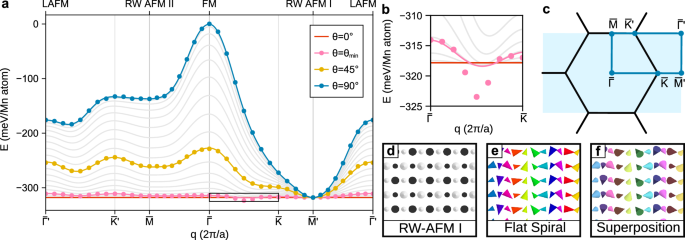
a Energy dispersion of a SS in the bridge site stacking of DL Mn on Ag(111) surface. The SSs are superimposed with the RW-AFM I state with a superposition angle θ (cf. Equation (1)). The dots represent DFT data and the lines are interpolations with the atomistic spin model that is parameterized with the energies of superposition angles of both 45° (yellow) and 90° (blue). For \({\theta }_{\min }\approx\) 14.2° (pink), an energetic minimum between the \(\overline{\Gamma }\) and the \(\overline{{\rm{K}}}\) point is predicted. b Zoomed in region marked by the black box in panel a. Gray lines are interpolations in steps of Δθ = 5°. c Symmetry zone and high symmetry path used for SS calculations. d–f Spin states for θ = 0° and an antiferromagnetic coupling between the layers (RW-AFM I), the flat spiral with θ = 90° and the q-vector of the energetic minimum, and a superposition of both with θ = 45°, respectively. Large (small) cones represent the magnetic moments of the top (bottom) Mn layer. Colors denote in-plane magnetization directions. Black and white cones denote moments pointing down- or upwards along the out-of-plane direction.
In both the RW-AFM I and II state, the top and bottom Mn layers exhibit the RW-AFM state. However, in the RW-AFM I state there is a net AFM coupling between the magnetic moments of the two Mn layers (Fig. 5d). The RW-AFM I state can occur for both local fcc hollow and bridge site stacking (left edge of Fig. 4). In the RW-AFM II state, the net coupling between the Mn layers is FM (c.f. central part of Fig. 4 for fcc hollow and bridge site stackings). Due to the surface reconstruction of the Mn bilayer, there is a shift between the RW-AFM order in the top and bottom Mn layers such that locally RW-AFM I and II states arise (Fig. 4). Note that for the bridge site stacking there is a third possibility, denoted as RW-AFM III state, with a balanced FM and AFM exchange coupling between Mn atoms of the two layers (cf. Fig. 4).
The energy minimum of the dispersion (Fig. 5a) for flat spin spirals (θ = 90°, blue curve), i.e., the energetically lowest SS state, is found for bridge site stacking at the \(\overline{{{{{\rm{M}}}}}^{{\prime} }}\)-point corresponding to the RW-AFM I state (Fig. 5d). In contrast, the RW-AFM II state (\(\overline{{{{\rm{M}}}}}\) point) is energetically very unfavorable (Fig. 5a). The RW-AFM III state is also energetically much higher (see Supplementary Table 1). The favoring of the RW-AFM I state can be explained based on an AFM nearest-neighbor exchange coupling. The magnetic moments of Mn atoms in top and bottom layers are 3.2 and 3.0 μB, respectively, in the RW-AFM I state and vary little for spin spirals with q. The similar size of the bottom Mn moment shows that the hybridization with the Ag surface is quite weak (see also Supplementary Figs. S12, S13 and Note 2).
In the SP-STM results of DL MnS, a rectangular spin lattice has been observed from a longer stripe period of 0.7 ± 0.05 nm superposed with a shorter stripe period of 0.5 ± 0.05 nm (Fig. 3). Therefore, we have studied magnetic superposition states (Fig. 5f) which can be constructed from a flat spin spiral (Fig. 5e) and the RW-AFM I state (Fig. 5d). These superposition states represent conical AFM SSs39 with a spin at site i given by
$${{{{\bf{s}}}}}_{i}^{{{\rm{super}}}}({{{\bf{q}}}},{\theta }_{i})=\cos ({\theta }_{i})\cdot {{{{\bf{s}}}}}_{i}^{{{\rm{AFM}}}}+\sin ({\theta }_{i})\cdot {{{{\bf{s}}}}}_{i}({{{\bf{q}}}})$$
(1)
where \({{{{\bf{s}}}}}_{i}^{{{\rm{AFM}}}}\) denotes the spin at site i in the RW-AFM I state and the superposition angle θi determines the mixing. Note that the spin orientation of the RW-AFM I state is chosen perpendicular to the rotation plane of the SS (Fig. 5d, e). We assumed a uniform superposition angle θi = θ for all lattice sites. For a superposition angle of θ = 45°, the SS energy dispersion was calculated via DFT (yellow symbols in Fig. 5a). Based on the two DFT energy dispersions for θ = 90° and θ = 45°, a parameterization of an atomistic spin model including higher-order exchange interactions has been obtained (see “Methods”, Supplementary Table 2 and Note 3).
This spin model predicts a conical SS minimum for an opening angle of θ ≈ 14.2° (see Fig. 5b). DFT calculations of the conical SS dispersion for θ = 14.2° (magenta symbols in Fig. 5a, b) confirm this minimum. Note that the SS part of this superposition state exhibits a period of λb = 0.857 nm that is consistent with the experimental period of 0.85 ± 0.1 nm of the cycloidal SS observed on the DL MnR (Fig. 2).
Hollow site stacking of the Mn bilayer
We have further studied the hollow site stacking of the top Mn layer, which also occurs locally in the reconstruction (Fig. 4). Three superposition states of the RW-AFM I state (Fig. 6a) and a flat spin spiral (Fig. 6b) are found in our DFT calculations as energetic minima with very similar total energy (see Supplementary Figs. S14, S15, Table 3 and Note 4). The superposition state with a spin spiral direction consistent with the experiments is displayed in Fig. 6c, similar to that found for the bridge-site stacking, but exhibits a spin spiral period of λh = 0.686 nm. As shown in Eq. (1), the created superposition state can be described by a superposition angle θ. For a fixed value of q, the energy from the parametrized atomistic spin model becomes
$${E}_{{{{\bf{q}}}}}(\theta )=({J}_{{{\rm{eff}}}}+{B}_{{{\rm{eff}}},1}){\cos }^{2}(\theta )+{B}_{{{\rm{eff}}},2}{\cos }^{4}(\theta )+{\mbox{const.}},$$
(2)
with the effective pairwise (Heisenberg) exchange constant \(\,{J}_{{{\rm{eff}}}}\) and the effective higher-order exchange constants \({B}_{{{\rm{eff}}},1}\) and \({B}_{{{\rm{eff}}},2}\). A superposition state (\(0^\circ < \theta < 90^\circ\)) can only be stabilized by higher-order interactions since the pairwise exchange favors either the RW-AFM I or the spin spiral state (cf. Fig. 6d and Eq. (2)). The DFT total energies along the path (blue symbols in Fig. 6d) can be well described by Eq. (2). In the superposition state at the energy minimum, both the RW-AFM I and the flat spin spiral state mix evenly with an effective mixing angle of \(\theta=45^\circ\).
Fig. 6: DFT ground state for DL Mn in hollow-site stacking on Ag(111).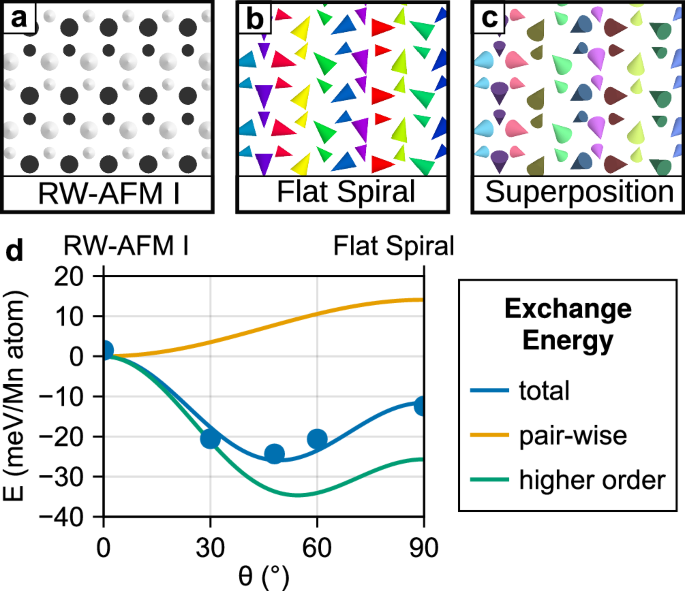
a Schematic of magnetic moments in the row-wise antiferromagnet with antiferromagnetic coupling between the layers (RW-AFM I). b Flat spin spiral. c Superposition of spin spirals and RW-AFM I state, which forms a local energetic minimum. d Energy of a superpositions with superposition angle θ between the RW-AFM I (θ = 0°) and the flat spin spiral (θ = 90°). Dots are DFT total energies and lines are the interpolation of an effective atomistic model. Blue is the total energy, yellow is the contribution of pairwise exchange and green is the contribution of higher order exchange.
Influence of SOC on the Mn bilayer
SOC is a weak effect in Mn and Ag due to their small nuclear charge. Therefore, SOC is not expected to play an essential role for the magnetic ground state in Mn/Ag(111), in contrast to DMI-driven spin spirals observed in Mn monolayers on heavy metal substrates with high SOC constants such as W37,38. However, SOC determines the orientation of the spin structure with respect to the atomic lattice. To investigate this aspect, we have calculated the energy contribution of SOC within DFT in first-order perturbation theory56 for a flat SS with the same q vector as the energetic minimum found for DL Mn on Ag(111) with different tilting angle ϕ of the rotation axis (Fig. 7). Due to symmetry the plane of rotation must always include the q vector. Different examples of such rotation planes are given in Fig. 7a with either clockwise or counter-clockwise rotation sense. Note that spin rotations in a plane perpendicular to q, which are possible in bulk systems with broken inversion symmetry57, only gave negligibly small energy contributions in DFT consistent with calculations for an Fe bilayer on Cu(111)48.
Fig. 7: Influence of DMI on spin spiral states.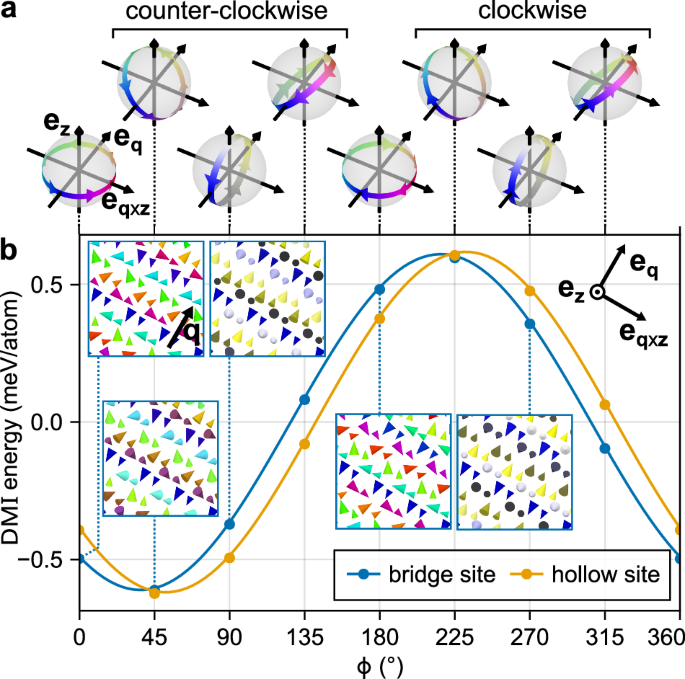
a Projection of the magnetic moments of a SS onto a sphere of unit magnetization. The arrows show the sense of rotation when moving along the direction of the q vector. Different rotation planes are illustrated. b SOC energy of a flat SS dependent on the tilting angle ϕ of the rotation axis. The displayed SSs are the energetic minima for the bridge and hollow sites, i.e., from Fig. 5e (yellow) and Fig. 6b (blue), respectively. Symbols show DFT energies and the line is the interpolation with the DMI. Insets show spin structures.
The calculated energy contributions to SSs due to SOC for both bridge and hollow site stackings are displayed in Fig. 7b. Independent of the atomic stacking, a tilting angle near 45° with a counter-clockwise sense of rotation is energetically preferred by about 0.5 meV/Mn atom. The interpolation (solid lines in Fig. 7b) shows that the SOC energy contribution can be described by the DMI
$${E}_{{{\rm{DMI}}}}=-{\sum}_{{ij}}{{{{\bf{D}}}}}_{{ij}}\cdot \left({{{{\bf{s}}}}}_{i}\times {{{{\bf{s}}}}}_{j}\right)$$
(3)
To check the influence of the magnetocrystalline anisotropy energy, which also results from SOC, we have performed self-consistent calculations of the energetically favorable RW-AFM I state in each stacking (see “Methods” and Supplementary Note 5). All obtained values are very small (see Supplementary Table 4). Therefore, the orientation of the magnetic superposition state is mainly dominated by DMI.