
Key Takeaways
A typical American couple needs about $1.16 million saved to retire comfortably, but this amount varies widely by state.
Housing costs are the largest factor behind retiree expenses, about 27% of a couple’s budget.
Couples in which both partners earned their own Social Security benefit need about $300,000 less saved than couples leaning on one earner’s record plus a spousal benefit.
The person you retire with matters. But from a financial standpoint, where you retire may matter even more.
A typical American couple age 65 or older needs about $1.16 million saved to retire comfortably, according to a new Investopedia analysis of federal data. That national average covers a wide geographic spread. Across all 50 states and Washington, D.C., Investopedia’s analysis found the nest egg a couple needs ranges from about $800,000 in the cheapest state to about $1.33 million in the priciest, a swing of more than $500,000.
Split two ways, the national average works out to roughly $579,000 a person, about 35% less than the $898,000 a single retiree needs. Two retirees share the rent or mortgage, utilities, and other bills, and they collect two Social Security checks instead of one. That makes a big difference between couples and singles—but where they live makes an even bigger one.
What a Typical Couple’s Retirement Really Costs
The typical couple age 65 or older spends about $84,000 a year, well above the roughly $60,000 a solo retiree spends. That $84,000 covers the discretionary extras of a comfortable retirement—travel, dining out, entertainment—not a stripped-down budget.
A couple’s spending is the same in our model, no matter how they earn their benefits. What “typical” describes is the income side: an average mix of Social Security benefits among U.S. retirees in 2024, with some couples drawing two full benefits and others leaning on one earner’s record.
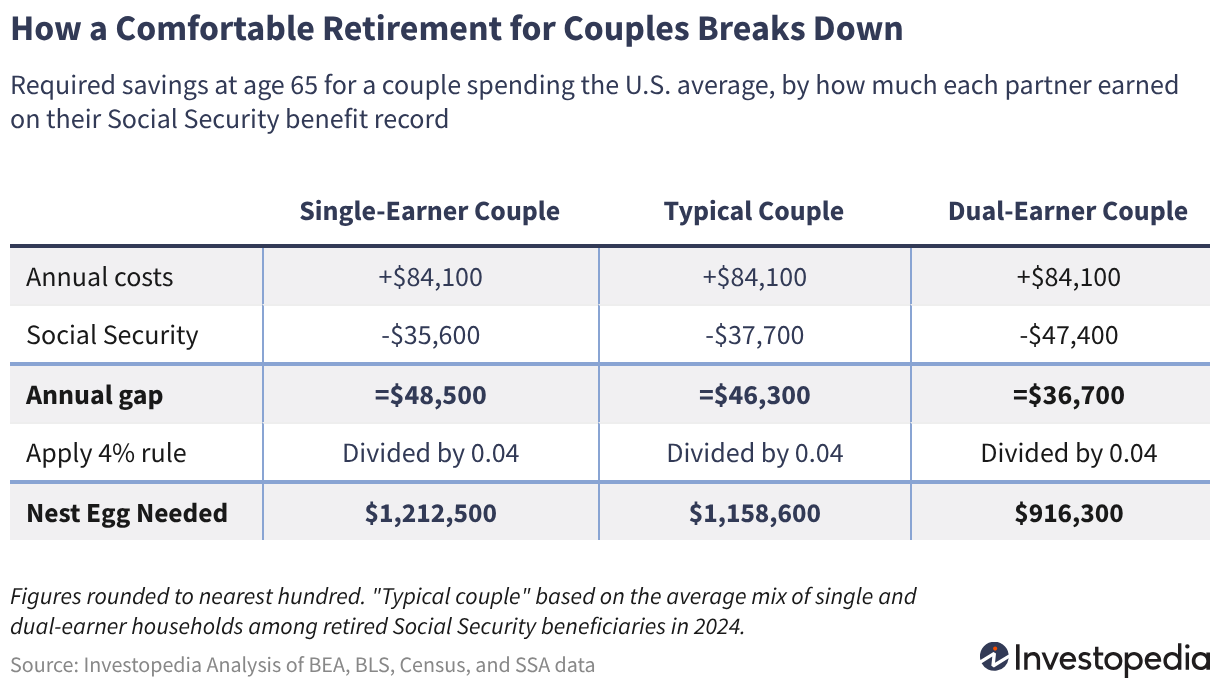
Their combined Social Security benefits average about $37,700 a year, which would cover about 45% of their typical spending. That leaves a gap of around $46,000 to cover from savings.
Run that gap through the 4% rule—the conventional guideline that you can safely draw 4% of a nest egg each year—and a typical couple needs about $1.16 million. That’s well below the $1.46 million Americans told Northwestern Mutual this year they’d need for a comfortable retirement.
How close to that figure you’ll need to be depends on whether one or both members of the couple earned full beneficiary status for Social Security. A dual-earner couple—in which both partners draw a full benefit based on their own earned wages—would collect about $47,400 a year and needs only about $916,000 saved, not much more than a single retiree.
But a single-earner couple leans on one partner’s record plus a spousal benefit. They’d collect about $35,600 and therefore need a larger nest egg of roughly $1.21 million in the U.S.
 The Most and Least Expensive States for Couples
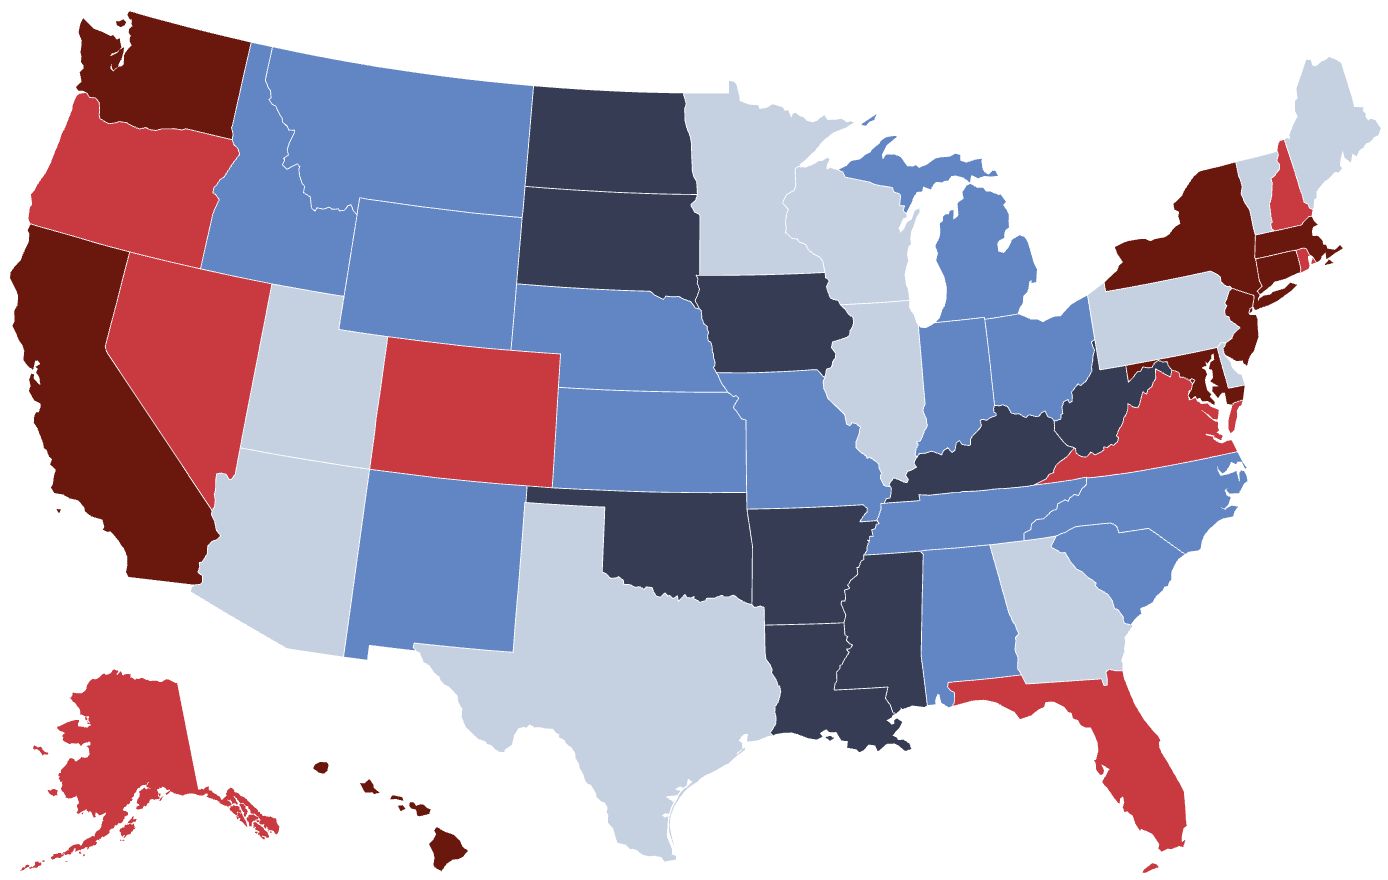
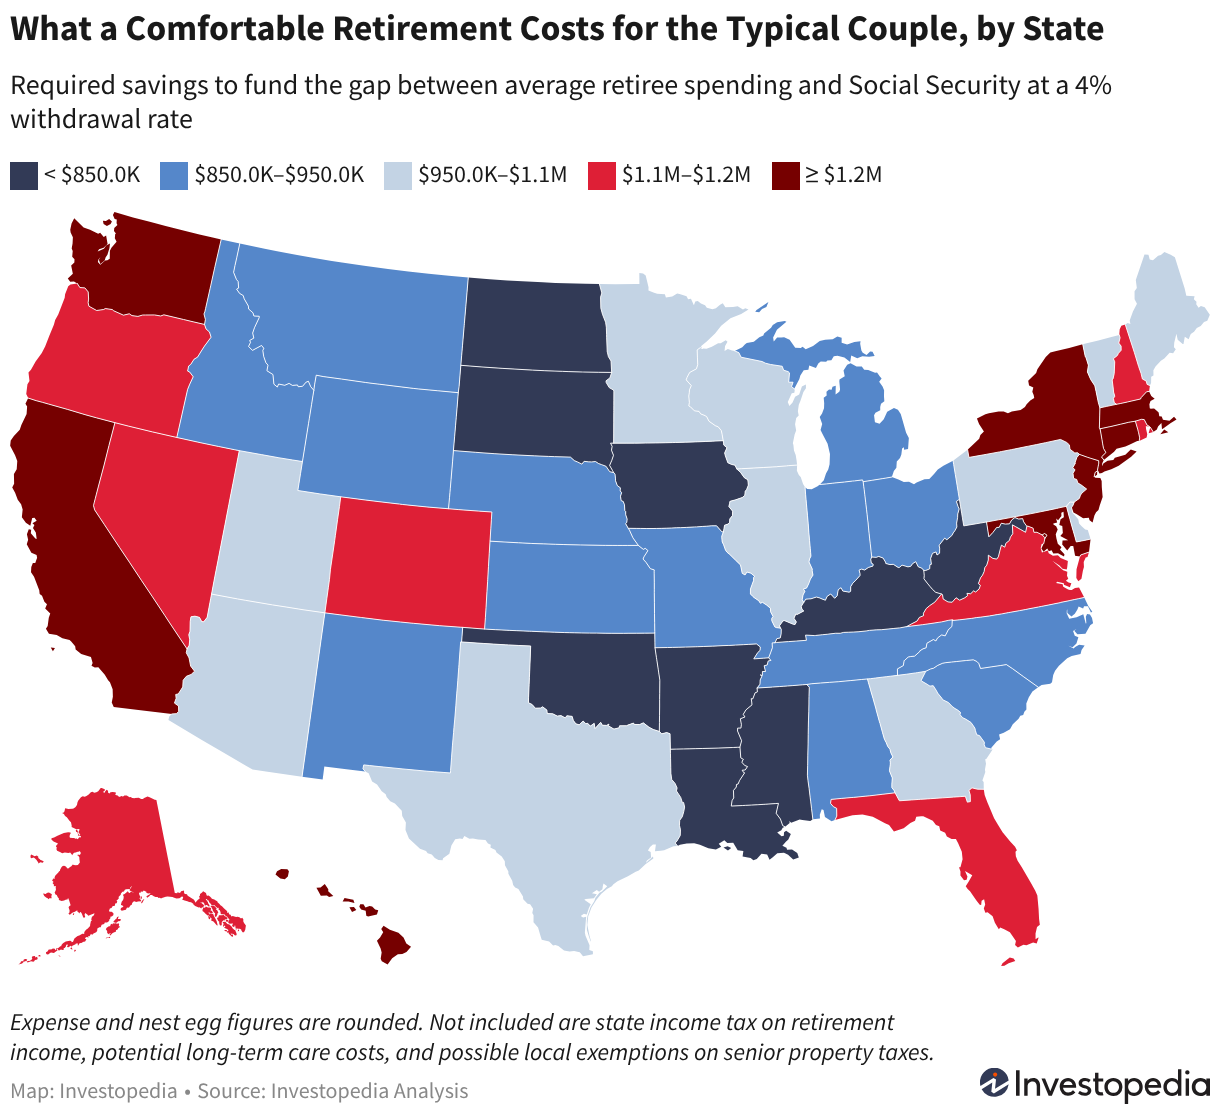
The four costliest locations in the U.S. for retired couples are New Jersey ($1.33 million), Hawaii ($1.33 million), California ($1.32 million), and the District of Columbia ($1.32 million). New York, Washington, Massachusetts, Connecticut, and Maryland follow in the $1.2 million range.
The most affordable states cluster in the Plains and Appalachia. About $800,000 is needed in North Dakota, which is trailed by Arkansas ($807,000), Mississippi ($813,000), West Virginia ($821,000), and Iowa ($834,000).
Housing drives most of that spread, just as it does for single retirees—accounting for about 27% of a couple’s retirement expenses. But that covers a wide range, from older adults who own their home free and clear to those who rent or still have a mortgage.
The cost of everyday goods and services, on the other hand, changes much less across the states. Still, it can add up when you consider that consumer prices run about 6% above the national average in Hawaii while South Dakota enjoys costs about 7% below average.
How We Calculated Retirement Costs in Every State
The method of our analysis matters not just for transparency—it also helps assess where you might fall relative to the averages. Since the estimates are based on average spending patterns, your own retirement costs may be higher or lower depending on where you live and how much you spend.
For this analysis, “comfortable” means the average spending level of Americans age 65 and older living as a couple, not a bare-bones budget or the median retiree’s expenses. That includes discretionary spending on things such as travel, restaurants, entertainment, and alcohol. Retirees who spend at the median typically need 15% to 20% less than the amounts shown. The estimates cover housing and everyday spending—including discretionary costs like travel, dining, and entertainment—offset by Social Security income, but exclude state income taxes on retirement income and don’t separately project inflation or investment returns.
Important
The nest egg figure doesn’t account for everything. Excluded from the analysis is state income tax on retirement income, potential long-term care costs, and possible exemptions on local property taxes that some jurisdictions offer to seniors. These three expenses vary widely by location and personal situation and therefore do not lend themselves to national averaging.
Investopedia‘s analysis looked at costs in all 50 states and the District of Columbia using four federal datasets from 2024, the most recent year for which all were available. For each state, we analyzed a single retiree’s costs first, then scaled them for a couple:
Housing costs: From the Census Bureau’s 2024 American Community Survey (1-Year Estimates), we identified the share of householders age 65 and older who had a mortgage, owned their homes free and clear, or rented. We then calculated average housing costs using each group’s median monthly expenses and its share of the 65-and-older population.
Nonhousing spending: We calculated spending for Americans age 65 and older using results of the Bureau of Labor Statistics’ 2024 Consumer Expenditure Survey. We removed housing expenses (covered separately above) and adjusted the rest using the Bureau of Economic Analysis’ 2024 Regional Price Parities for goods and services.
Spending for a couple: Two people sharing a home don’t spend twice as much as one person; they split the rent, the utilities, and much else. Economists capture that with a square-root scale: a two-person household spends about 1.41 times as much as a single person (the square root of 2), not double. We applied that 1.41 multiplier to each state’s single-retiree cost.
Social Security offset: Similarly, a couple’s two Social Security checks aren’t simply double the amount of one person’s. We set a typical couple’s combined benefit at 1.591 times a single retiree’s—the figure you get by dividing the Social Security Administration’s average benefit for couples by the average benefit for an individual, which was $1,975 a month in December 2024. That lands between two extremes we also modeled: a single-earner couple, where one partner’s work record supports both through a spousal benefit (about 1.5×), and a dual-earner couple, where both built a full benefit (about 2×).
Also, we used national figures rather than state averages because state-level Social Security data reflect retirees’ lifetime earnings histories, not necessarily where they live now—or will live in the future.
Nest egg required: We divided the remaining annual gap by 0.04 to land at the size of nest egg required to cover the gap if the traditional 4% safe withdrawal rule is followed.
Read the original article on Investopedia