
Bacterial strains
Mtb strains (unless specified otherwise) are derivatives of H37Rv. Clinical strains were acquired from the BCCM/ITM reference set of clinical strains38 and are referred to by their ITM number. Msm strains are derivatives of mc2155. E. coli strains are derivatives of DH5α (NEB, C2987).
Mycobacterial cultures
Mycobacteria were grown at 37 °C in Difco Middlebrook 7H9 broth (BD, 271310) or on 7H10 agar (BD, 262710) supplemented with 0.2% (7H9) or 0.5% (7H10) glycerol, 0.05% Tween-80 and either 1× albumin dextrose catalase (ADC) (for Msm) or 1× oleic acid albumin dextrose catalase (OADC) (for Mtb). Antibiotics (10–20 μg ml−1 kanamycin, 5–20 μg ml−1 zeocin, 50 μg ml−1 hygromycin and 25 μg ml−1 nourseothricin) were added as needed to construct and maintain strains and libraries, and 100–500 ng ml−1 ATc was used to induce CRISPRi. Msm cultures were grown shaking in sealed vessels. Mtb cultures were grown standing in tissue culture flasks with 5% CO2.
Strain constructionKnockout strains
Mtb and Msm deletion mutants lacking cytochrome bd oxidase were derived from the corresponding wild-type strains. The Mtb deletion mutant, in which the cydABDC operon is replaced with a hygromycin resistance cassette, has been described previously68. To construct an analogous Msm mutant, ORBIT69 was used to delete both the cydAB and appCB operons, which encode confirmed and putative bd-type oxidases, respectively. The resulting strain carries hygromycin and zeocin resistance cassettes, with PCR confirming successful replacement of the endogenous loci.
The Msm strains ∆qcrB and ∆ms2764 were prepared using the ORBIT method69. To generate the ∆qcrB strain, wild-type Msm containing plasmid pKM444 (Addgene, 108319) was transformed with the payload plasmid pKM464 (Addgene, 108322) and the oligonucleotide TCGTCGAACCCGTCGGACCGGCATTCTGGGAGCGCAAATCATGAGTCCTGACTTTGCGAAACTCGCCGCCGGTTTGTCTGGTCAACCACCGCGGTCTCAGTGGTGTACGGTACAAACCGGCAACGGGGAGACCAACGGTCATCACTGATCGCTGAGATACTCGGATCGCCGCAATTCCTCTTCGGAGG. To generate the ∆ms2764 strain, wild-type Msm containing plasmid pKM444 was transformed with a modified pKM464, in which the attP/attB core sequence is replaced with GCGTGCTC, and the oligonucleotide CAGAGAGGTGGACACGACGTCACAGATTACTCTGAGCCGCGTGTCGGACACGCGCGCAACCACCCAAACCGGTTTGTCTGGTCAACCACCGCGTGCTCAGTGGTGTACGGTACAAACCGATCGCCTGCTGGCGGCGTTGAACGCCTGATCGAATCGGTCTGCGGCCGGTCAGGCCGCGCAGTCGGTGC. Transformants of ∆qcrB and ∆ms2764 were screened for payload integration by selection with 50 µg ml−1 hygromycin. Successful deletion of qcrB was confirmed by colony PCR using primers GTTCGACGTTTGGAATTCG and CCTGGTATCTTTATAGTCCTGTCG, and successful deletion of ms2764 was confirmed by colony PCR using primers GAAACCTTGATCTCACCGCG and GACGAATTCACCTGCTCCAG.
Epitope-tagged strains
An Msm strain encoding a 3×Flag tag at the C terminus of Ms2764 was prepared using the ORBIT method69. In brief, wild-type Msm containing plasmid pKM444 was transformed with the payload plasmid pSAB4170 and the oligonucleotide GGACGACCCCACCCCGTACTGGCTGGTCAGCACTCGTCACCCGGATCGCCTGCTGGCGGCGTTGAACGCCGGTTTGTCTGGTCAACCACCGCGGTCTCAGTGGTGTACGGTACAAACCTGATCGAATCGGTCTGCGGCCGGTCAGGCCGCGCAGTCGGTGCAGATCATCACGCCGTTCTTCTCGCTGGCGA. Transformants were screened for integration of pSAB41 by selection with 50 µg ml−1 hygromycin followed by colony PCR using primers GAGGTGCCGAAATCGGCGAAGT and CCTGGTATCTTTATAGTCCTGTCG.
Plasmid construction
All plasmids are listed in Supplementary Table 6.
CRISPRi constructs
CRISPRi plasmids were cloned as described previously71 using plRL61 for Msm and plRL58 for Mtb10. These backbones support L5-integration of the complete CRISPRi system and differ by only two nucleotides in the dCas9 Shine–Dalgarno sequence. The substitutions are predicted to reduce dCas9 translation efficiency in Mtb relative to Msm, reflecting the lower expression level required for effective CRISPRi in Mtb. To make each CRISPRi construct, the appropriate backbone was digested with BsmBI (NEB, R0739) and gel-purified before ligation (T4 DNA ligase; NEB, M0202) with annealed oligonucleotides containing the sgRNA targeting sequence (Supplementary Table 6) and compatible overhangs. Ligation products were transformed into chemically competent E. coli cells (NEB, C2987) and selected on LB plates containing kanamycin (50 µg ml−1). Plasmids were isolated from single colonies, and the sgRNA region was verified by Sanger sequencing. Validated plasmids were then co-transformed with plRL19 (L5 integrase helper vector) into mycobacteria as described previously10,71, and transformants were selected with kanamycin (20 µg ml−1).
CRISPRi-resistant complementation constructs
CRISPRi-resistant complementation constructs were cloned as described previously71 into the Tweety-integrating backbone plRL9116. Each construct was assembled from PCR-amplified fragments (Q5 High-Fidelity 2× Master Mix; NEB, M0492) using NEBuilder HiFi DNA Assembly Master Mix (NEB, E2621). Fragments were amplified from plasmid or genomic DNA using custom oligonucleotides designed to introduce (1) 20 bp of overlap between adjacent fragments and (2) silent mutations in the protospacer adjacent motif (PAM) site and seed sequence of the target gene to prevent sgRNA recognition. Gel-purified fragments were incorporated into DraIII-digested and gel-purified plRL91 using a 2:1 or 1:1 fragment-to-backbone ratio, with a 60-min incubation at the recommended temperature. All complementation alleles were expressed from the hsp60 promoter. Assembly products were transformed into chemically competent E. coli cells and selected on LB plates containing carbenicillin (100 µg ml−1). Plasmids were isolated from single colonies and verified by whole-plasmid sequencing (Plasmidsaurus). Validated plasmids were then co-transformed with plRL62 (Tweety integrase helper vector) into mycobacteria as described previously16,71, and transformants were selected with nourseothricin (25 μg ml−1).
Split-plasmid system for CRISPRi libraries
For cloning GI libraries, a split-plasmid CRISPRi system was developed, in which the invariant and variable components of the CRISPRi machinery are carried on separate plasmids that integrate at distinct genomic sites. Sequential transformation of mycobacteria—first with the invariant-element plasmid carrying dCas9, then with the variable-element plasmid carrying the sgRNA library—provides two advantages during library transformation: (1) the reduced size of the library plasmid improves transformation efficiency; and (2) transformation into a clonal dCas9-expressing population minimizes the emergence of CRISPRi-resistant mutants10.
The specific invariant-element plasmids used in this study were plRL252 (Msm) and plRL195 (Mtb). Each carries (1) dCas9 under the control of an optimized, synthetic Tet repressor (TetR)-regulated promoter; (2) a mycobacterial codon-optimized Tet repressor; (3) a Giles attachment site; and (4) a zeocin resistance cassette. Construction of these plasmids was accomplished using NEBuilder HiFi DNA Assembly (described above), with amplification of the dCas9–TetR fragment from the previously described plasmids plRL117 (Msm) or plRL2 (Mtb)10 and assembly into MluI-digested (NEB, R3198) and ClaI-digested (NEB, R0197) plRL12516. Like plRL61 and plRL58 (described above), plRL252 and plRL195 differ from each other by only two nucleotides in the dCas9 Shine–Dalgarno motif, which was engineered for optimal dCas9 expression in each species. Plasmids plRL252 and plRL195 were co-transformed with plRL40 (Giles integrase helper vector) into wild-type Msm and Mtb, respectively, as described previously16,71, and transformants were selected with zeocin (20 µg ml−1).
Complementing the invariant-element plasmids, the variable-element plasmid plRL389 served as the backbone for cloning both the Msm and the Mtb GI libraries. It contains (1) a synthetic TetR-regulated promoter driving sgRNA expression; (2) an L5 integrase and attachment site; and (3) a kanamycin resistance (KanR) cassette. plRL389 was derived from plRL210 through multiple cloning steps designed to accomplish the following: (1) removal of the dCas9 and TetR elements, which were relocated to the invariant-element plasmids (see above); (2) synonymous mutation of a XhoI restriction site in the KanR cassette for compatibility with downstream cloning; (3) replacement of the E. coli origin of replication with a predicted higher-yield version; and (4) introduction of restriction and primer-binding sites necessary for downstream cloning and sequencing. These latter elements were inserted directly after the sgRNA scaffold and include, in order: (1) an MfeI restriction site; (2) a landing site for reverse library amplification primers; (3) a XhoI restriction site; (4) an 18-bp barcode placeholder; (5) a SalI restriction site; (6) a landing site for the custom sequencing primer; and (7) a landing site for the common forward library amplification primer. A final restriction site (EcoRI) required for cloning was already present in the parent plasmid directly upstream of the sgRNA cassette. plRL389 was provided to the biotechnology company Genewiz to initiate GI library construction (see ‘CRISPRi library production’).
Note that the standard (unsplit) CRISPRi system was used for the CGI library RLC25, whose sub-libraries RLC3 and RLC14 were cloned into plRL2 and plRL58, respectively (see ‘CRISPRi library production’).
Off-target analysis
With practical constraints limiting the design of GI libraries to two guides per gene, the identification of guides that are least likely to cause off-target knockdown took on new importance. A custom script was applied to each candidate guide to identify off-target matches, defined as instances of perfect complementarity between the 3′ (PAM-proximal) end of the sgRNA sequence and the genome, spanning ten or more base pairs and positioned next to a PAM site other than the intended target. Guides were then stratified into four tiers according to the following criteria: tier 1, no off-target matches; tier 2, no off-target matches targeting the non-template strand of a gene; tier 3, no off-target matches targeting the non-template strand of a gene with a PAM sequence conferring fold repression ≥ 42.2 in a luciferase knockdown assay13; and tier 4, all remaining guides.
Moving from the first tier to the fourth, the risk of off-target activity increases. The focus on non-template-targeting matches reflects previous data establishing the greater efficacy of non-template- versus template-targeting CRISPRi11,13. The PAM strength cut-off of 42.2 was chosen because weaker PAM sequences rarely produce detectable off-target effects, as inferred from depletion of guides targeting non-essential genes with off-target matches in essential genes.
CRISPRi library designMsm GI library
The Msm GI library was designed to target all essential genes, in addition to Msm homologues of Mtb in vitro essential genes. Essentiality was defined as the union of TnSeq calls72 and CRISPRi calls10; in the latter case, essentiality was determined using a mixture model of the estimated maximum depletion rate, βmax, for each gene. This produced a list of 834 genes for which guide selection was attempted.
An automated guide selection pipeline was used to select up to two sgRNAs per gene. For genes essential by CRISPRi, sgRNAs were selected in several rounds, with each round becoming more permissive to increase the chance of identifying suitable sgRNAs. The first round of selection was restricted to sgRNAs imposing a specific fitness cost previously determined in a pilot screen to be optimal for detecting GIs: predicted log2-transformed fold change (L2FC) at 25 generations between –5 and –1 in our reference experiment10. In addition, only sgRNAs without off-target matches (off-target tier 1) were considered. In the second round, sgRNAs were permitted to have intergenic and template-targeting genic off-targets (off-target tier 2). In the third round, the guide pool was further expanded to include sgRNAs within a larger L2FC window (–6 to –0.5) and sgRNAs possessing weak non-template-targeting off-targets (off-target tier 3). The final round of selection placed no restrictions on off-target matches (off-target tier 4). In all four rounds, priority was given to sgRNAs closest to the logistic curve describing a gene’s expression–fitness relationship10.
For genes categorized as non-essential by CRISPRi, sgRNAs with the highest predicted strengths10 were selected. To minimize the potential for off-target effects without excessively constraining PAM site availability, a first round of selection was limited to sgRNAs in off-target tiers 1–3. In a second round of selection, the guide pool was expanded to include sgRNAs in off-target tier 4.
For all genes, the selection of length isomers (sgRNAs targeting the same PAM site) was prohibited. In addition, guides that were computationally flagged as outliers and guides introducing restriction sites necessary for library construction were excluded.
Automated guide selections were subjected to minimal manual curation, which involved (1) the replacement of sgRNAs exhibiting unexpected depletion and (2) the exclusion of genes for which only a single guide in off-target tier 4 could be identified.
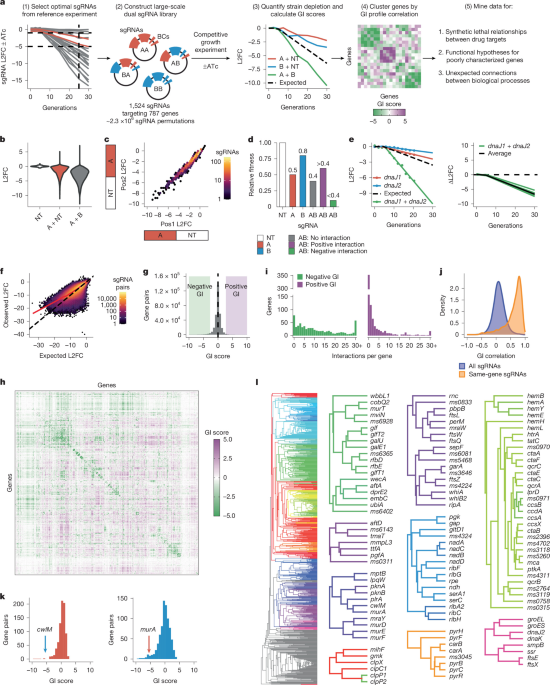
The final selections consisted of 1,524 sgRNAs targeting 787 genes. The addition of 10 non-targeting control sgRNAs brought the final guide count to 1,534.
Mtb GI library
The Mtb GI library was designed to target all in vitro essential genes, in addition to 72 non-essential genes that were predicted to interact with other genes in the library, are important for infection or are under positive selection in clinical strains. Essentiality was defined as the union of TnSeq calls73 and CRISPRi calls10. This produced a list of 840 genes for which guide selection was attempted.
An automated guide selection pipeline was used to select up to two sgRNAs per gene, similar to the selection process described for the Msm GI library. For genes categorized as essential by CRISPRi, sgRNAs were selected to have a predicted L2FC at 25 generations between –6 and –0.5 (ref. 10). Priority was given to sgRNAs closest to the logistic curve describing a gene’s expression–fitness relationship. For genes that were non-essential by CRISPRi, sgRNAs with the highest predicted strengths were selected. For all genes, guides computationally flagged as outliers and guides introducing restriction sites necessary for library construction were excluded. Automated guide selections were subjected to minimal manual curation, which involved the replacement of sgRNAs exhibiting unexpected depletion.
The final selections consisted of 1,483 sgRNAs targeting 762 genes. The addition of 10 non-targeting control sgRNAs brought the final guide count to 1,493.
Mtb library for CGI profiling
To profile CGIs, an optimized library was designed to target all Mtb genes. This library, designated RLC25, is a combination of two libraries: (1) the previously described library RLC3 (ref. 10), consisting of strong sgRNAs targeting in vitro non-essential genes; and (2) the recently designed library RLC14 (ref. 74), comprising hypomorphic sgRNAs that target in vitro essential genes (union of TnSeq and CRISPRi essentiality calls).
To select sgRNAs for RLC14, behaviour in the reference experiment was used as a starting point, with emphasis on the parameter βe, which models the rate of depletion of a given sgRNA over time10. For each in vitro essential gene, up to 20 sgRNAs were selected. The selection algorithm prioritized depletion rates around βe = −0.14 while also including some stronger and weaker guides. To achieve this, bins representing the 20th percentiles of a normal distribution centred at –0.14 were defined, and one sgRNA was selected from each bin. This approach ensured that most sgRNAs were selected near –0.14 (where the bulk of the distribution lies) while still incorporating guides from the distribution tails. If a bin contained no available sgRNAs, other bins were resampled until a maximum of 20 sgRNAs was reached. In total, 14,354 sgRNAs targeting 748 genes were selected. The addition of 646 non-targeting control sgRNAs brought the total guide count for RLC14 to 15,000.
Combining RLC3 (16,681 sgRNAs) and RLC14 to make RLC25, the final library contained 31,143 sgRNAs: 30,306 sgRNAs targeting 4,005 genes, along with 837 non-targeting control sgRNAs (538 sgRNAs are shared between RLC3 and RLC14). This represents a reduction of 65,557 sgRNAs relative to the reference Mtb library RLC12 (ref. 10), while maintaining genome-wide coverage.
CRISPRi library productionGI libraries
The Msm and Mtb GI libraries were cloned using an approach based on CombiGEM20,75. This involved first constructing a library of barcoded single-sgRNA constructs containing strategically placed restriction sites. These sites enabled efficient derivation of a dual-sgRNA library containing all pairwise sgRNA permutations, with the corresponding barcodes in close proximity to one another to facilitate high-throughput sequencing.
Single-sgRNA library production
The biotechnology company Genewiz was commissioned to synthesize the single-sgRNA libraries. They received a list of the selected sgRNA sequences, each of which had been assigned a unique 18 base-pair barcode (Supplementary Table 1). Barcode sequences were derived from a published list (https://github.com/hawkjo/freebarcodes)76 after excluding those that would create restriction sites incompatible with downstream cloning. Each sgRNA–barcode pair was cloned individually into the plasmid backbone plRL389 (see ‘Plasmid construction’), with maintenance of restriction sites necessary for CombiGEM cloning. This approach prevents template switching77,78 between the sgRNA and its linked barcode, preserves sequence fidelity and ensures even representation during pooling. In the final constructs, EcoRI and SalI sites flank the sgRNA–barcode cassette, and MfeI and XhoI sites occupy a short spacer region between the sgRNA and the barcode. These restriction enzymes were selected because they recognize distinct sequences but generate compatible overhangs. The crucial region of each construct, encompassing the restriction sites, sgRNA and barcode, was verified by Genewiz using Sanger sequencing. The constructs were then pooled in equimolar ratios to generate the single-sgRNA libraries, which were designated RLGGI004A (Msm) and RLGGI003A (Mtb). After receipt in the laboratory, the barcode region of these libraries was amplified and sequenced to confirm the presence and balanced representation of all constructs (see ‘Library preparation for Illumina sequencing’).
Dual-sgRNA library production
The single-sgRNA libraries were designed so that digestion with MfeI and XhoI yields a backbone library, whereas digestion with EcoRI and SalI generates an insert library. The resulting compatible overhangs permit insertion of each sgRNA–barcode cassette between the sgRNA and barcode of every construct. In each digest, the sgRNA and its corresponding barcode remain physically linked. This cloning scheme purposefully omits amplification steps that can introduce template-switching artefacts, ensuring that barcodes accurately represent the sgRNA sequences contained within a construct. Moreover, it produces dual-sgRNA constructs in which the two barcodes are separated by only six base pairs, preserving barcode fidelity during library preparation and sequencing (Extended Data Fig. 1a).
To construct the Msm dual-sgRNA library (RLGGI004B), the single-sgRNA library RLGGI004A was first concentrated by alcohol precipitation, and 36 μg of RLGGI004A was then digested with MfeI (NEB, R3589) and XhoI (NEB, R0146) to obtain a library of backbones. An additional 36 μg of RLGGI004A was digested with EcoRI (NEB, R3101) and SalI (NEB, R3138) to obtain a library of inserts. The backbone and insert fragments were gel-purified (QIAGEN, 28706) and spot-dialysed (Millipore, VSWP02500) on 0.025-μm MCE membranes. The purified fragments were ligated overnight at 16 °C using T4 DNA ligase (NEB, M0202) in 28 parallel 50-μl reactions, each containing 75 fmol of backbone and insert. After heat inactivation (65 °C for 10 min), ligation products were pooled and spot-dialysed, generating the final dual-sgRNA library for transformation into E. coli.
An identical procedure was used to construct the Mtb dual-sgRNA library (RLGGI003B) from the single-sgRNA library RLGGI003A, with the exception that eight ligation reactions yielded sufficient material for E. coli library transformations.
RLC25
As described in ‘CRISPRi library design’, RLC25 consists of two sub-libraries: RLC3 and RLC14. The cloning of RLC3 has been described previously10.
To clone RLC14, an sgRNA oligonucleotide library was synthesized by Agilent Technologies (SureGuide Custom CRISPR Guide Library; G7555B), and cloning was performed as described for RLC3, with the following modifications:
(1)
Fifteen 50-µl PCR reactions were performed to amplify the oligonucleotide library, with slight adjustments to the PCR cycling conditions: 98 °C for 30 s; 11 cycles of 98 °C for 10 s, 60 °C for 10 s, 72 °C for 15 s; and 72 °C for 120 s.
(2)
The plasmid plRL58 was used in place of plRL2 as the CRISPRi backbone. Unlike plRL2, plRL58 lacks the L5 integrase, which must be supplied in trans during transformation into mycobacteria. The amplified oligonucleotide library was cloned into BsmBI-digested plRL58 using 16 × 20-µl Golden Gate reactions.
E. coli library transformationsGI libraries
The RLGGI004B and RLGGI003B ligation products were transformed into MegaX DH10B T1R Electrocomp Cells (Invitrogen, C640003) for amplification.
RLGGI004B
Twenty-five tubes of MegaX cells (100 µl each) were thawed on ice. To each tube, 75 ng (41 µl) of ligation product was added, followed by an equal volume (141 µl) of ice-cold 10% glycerol. Each tube was divided into three aliquots for transformation, resulting in a total of 75 transformations. For each transformation, 94 µl of the cell, DNA and glycerol mixture was transferred to a 0.1-cm electroporation cuvette (Bio-Rad, 1652089) and electroporated using the following settings: 2,000 V, 200 Ω and 25 µF. Immediately after electroporation, 2 × 300 µl of SOC medium was added to the cuvette, mixed by pipetting and transferred to a recovery vessel pre-loaded with SOC medium at a volume proportional to the number of transformations to be pooled in that vessel (1 ml per transformation). The total culture volume in each recovery vessel was maintained at approximately one-third of the vessel’s capacity. Recovery cultures were incubated at 37 °C with shaking for 1.5 h, then pooled into a single container. The pooled recovery culture was diluted to an optical density at 600 nm (OD600 nm) of 0.2 in LB with 50 µg ml−1 kanamycin for selection79 and distributed across six 2-l flasks to maintain adequate headspace. After overnight growth (37 °C with shaking), the plasmid library was isolated using a QIAGEN Plasmid Giga Kit (QIAGEN, 12191). Finally, the quality of the library—defined by the presence and balanced representation of expected barcode pairs—was confirmed by deep sequencing (see ‘Library preparation for Illumina sequencing’).
RLGGI003B
A similar procedure was used, with the following exceptions:
(1)
Fewer transformations (30) were performed, requiring ten tubes of MegaX cells. The DNA-to-cell ratio was maintained at 75 ng per 100 µl, necessitating the addition of 24 µl of ligation product and 124 µl of 10% glycerol per tube, with transformations carried out in 83-µl aliquots.
(2)
Library selection and outgrowth were performed on solid medium rather than in liquid culture. The pooled recovery culture (around 50 ml in total) was spread at 1 ml per plate onto pre-warmed LB agar supplemented with 50 µg ml−1 kanamycin in 50 bioassay dishes (245 mm × 245 mm; Corning, 431110). The plates were incubated at 37 °C for 18 h, after which transformants were collected by scraping.
RLC25
The transformation of sub-library RLC3 into MegaX DH10B T1R Electrocomp Cells has been described previously10. Sub-library RLC14 was transformed in the same manner, using 16 individual transformations. For each transformation, 2 µg of the dialysed Golden Gate product (54.2 µl) was mixed with 400 µl cells. Recovered cells from all transformations were pooled and plated across 16 bioassay dishes.
Mycobacterial library transformationsGI libraries
Validated dual-sgRNA libraries were transformed into mycobacterial strains already equipped with the invariant elements of the CRISPRi system (see ‘Plasmid construction’). In preparation for library transformations, these strains were rendered electrocompetent using standard procedures. In brief, cultures were grown to late log phase (OD600 nm ≈ 1) and treated with 200 mM glycine for one doubling time. Cells were then collected by centrifugation, washed three times with 10% glycerol and resuspended to obtain a 100-fold concentrated cell suspension.
Msm
Ninety-three transformations were performed to generate the Msm dual-sgRNA library. For each transformation, 1 µg of RLGGI004B plasmid DNA was added to 100 µl electrocompetent cells. The cell and DNA mixture was transferred to a 0.2-cm electroporation cuvette (Bio-Rad, 1652086) and electroporated using the following settings: 2,500 V, 700 Ω and 25 µF. Each transformation was recovered in 3 ml of appropriately supplemented 7H9 medium (see ‘Mycobacterial cultures’). Up to 17 transformations were pooled, yielding six recovery cultures of 51 ml or less in 250-ml Erlenmeyer flasks (Corning, 430183). Recovery cultures were incubated at 37 °C with shaking for three hours (approximately one doubling time) and subsequently combined in a single vessel. For selection and outgrowth of transformants, the pooled recovery culture was diluted to an OD600 nm of 0.2 in 7H9 medium containing 5 µg ml−1 zeocin and 20 µg ml−1 kanamycin, and distributed across 14 × 500-ml PETG media bottles (Thermo Fisher Scientific, 09-923-16B) to maintain adequate headspace. After reaching an OD600 nm of about 3, outgrowth cultures were pooled and used to inoculate 10 × 50-ml cultures at a density sufficient to preserve library coverage and avoid bottlenecking. After ten generations of serial passaging, these cultures were pooled and passed through a 10-μm cell strainer (pluriSelect, 437001003) to yield the final de-clumped library. A portion of the library was stored in glycerol stocks at –80 °C. A 10 OD600 nm unit (ODU) sample was taken for genomic DNA (gDNA) extraction and confirmation of library quality by deep sequencing (see ‘Genomic DNA extraction’ and ‘Library preparation for Illumina sequencing’).
Mtb
The Mtb dual-sgRNA library was generated twice in independent rounds of transformation. In the first round, 100 transformations were performed. For each transformation, 1 µg of RLGGI003B plasmid DNA was added to 200 µL of electrocompetent cells, and the mixture was electroporated as described above. Each transformation was recovered in 5 mL of appropriately supplemented 7H9 medium (see ‘Mycobacterial cultures’). Ten transformations were pooled, yielding 10 × 50-ml recovery cultures in T-225 vented tissue culture flasks (Corning, CLS431082). Recovery cultures were incubated at 37 °C for 24 h (approximately one doubling time), after which they were centrifuged to pellet the cells, pooled and resuspended in 70 ml 7H9 medium. For selection and outgrowth of transformants, the pooled recovery culture was spread at 0.7 ml per plate onto 7H10 agar supplemented with 20 µg ml−1 zeocin and 20 µg ml−1 kanamycin in 100 bioassay dishes (245 mm × 245 mm; Corning, 431110). The plates were incubated at 37 °C for 22 days, after which transformants were collected by scraping. Scraped cells were resuspended in 25% glycerol in gentleMACS M tubes (Miltenyi Biotec, 130093236) and homogenized for 90 s on a gentleMACS Octo Dissociator (Miltenyi Biotec, 130095937). A portion of the pooled homogenate was stored in glycerol stocks, and the remainder was used to inoculate 10 × 50-ml cultures for serial passaging. During serial passaging, all cultures developed a fast-growing, carbenicillin-sensitive bacterial contaminant, which had been present at very low abundance in the glycerol stocks but ultimately outcompeted Mtb, presumably owing to a shorter doubling time. Because Mtb is naturally resistant to carbenicillin, two new 50-ml cultures were initiated from glycerol stocks and passaged for ten generations in the presence of 100 µg ml−1 carbenicillin. At each passage, aliquots were plated on blood agar, and the absence of growth on these plates confirmed successful elimination of the contaminant. The cured cultures were pooled and passed through a 10-μm cell strainer to obtain the final de-clumped library. A portion of the library was stored in glycerol stocks, and a sample was taken for gDNA extraction and library quality assessment by deep sequencing (see ‘Genomic DNA extraction’ and ‘Library preparation for Illumina sequencing’). To minimize the potential effects of carbenicillin exposure, the library was passaged for an additional ten generations without carbenicillin before starting Mtb experiment 1.
Separately, a second round of 50 transformations was performed using the same electroporation and recovery procedures as in the first round, yielding 5 × 50-ml recovery cultures. After recovery, selection and outgrowth were performed in liquid culture instead of on plates, following a protocol similar to that used for Msm. Recovery cultures were combined in a single vessel, diluted to an OD600 nm of 0.2 in 7H9 medium containing 20 µg ml−1 zeocin and 20 µg ml−1 kanamycin and distributed across 50 T-225 vented tissue culture flasks to maintain adequate aeration. After reaching an OD600 nm of about 1.2, outgrowth cultures were pooled and used to inoculate 10 × 50-ml cultures for serial passaging and de-clumping as described above. A portion of the de-clumped library was stored in glycerol stocks, and a sample was taken for gDNA extraction and library quality assessment by deep sequencing (see ‘Genomic DNA extraction’ and ‘Library preparation for Illumina sequencing’). This library was used for Mtb experiment 2.
RLC25
The transformation of sub-library RLC3 into wild-type Mtb has been described previously10. Sub-library RLC14 was transformed in the same manner, with the exception that because of the absence of L5 integrase, for each transformation, 1 µg of RLC14 plasmid DNA was combined with 1 µg of plRL19 to permit integration of library constructs into the mycobacterial chromosome.
To generate RLC25, one 1-ml aliquot (one OD580 nm unit) of the final homogenized RLC3 library and one 1-ml aliquot (one OD580 nm unit) of the final homogenized RLC14 library were thawed, and each aliquot was inoculated into 24 ml 7H9 medium supplemented with kanamycin (10 μg ml−1) in separate 75-cm2 vented tissue culture flasks (starting OD580 nm ≈ 0.04). The cultures were incubated for six days at 37 °C up to an OD580 nm of about 2, passed through a 10-µm cell strainer to obtain a single-cell suspension and pooled in a 1:0.86 ratio corresponding to relative library size. The OD580 nm of the mixture was adjusted to 1.0, and aliquots were frozen at −80 °C. Genomic DNA was extracted from the library pool, and library quality was confirmed by deep sequencing (see ‘Genomic DNA extraction’ and ‘Library preparation for Illumina sequencing’).
Pooled CRISPRi screensGI screens
Pooled CRISPRi screens were performed as described previously10, incorporating two key modifications—larger culture volumes and increased passaging frequency—to avoid bottlenecking the higher-complexity GI libraries.
Msm
RLGGI004B glycerol stocks totalling about 8 ODU (around 2.4 × 10⁹ cells; around 1,020× library coverage) were thawed into appropriately supplemented 7H9 medium (see ‘Mycobacterial cultures’) containing zeocin (5 µg ml−1) and kanamycin (20 µg ml−1). The starter culture was expanded to enable (1) collection of six 10-ODU samples (around 1,275× library coverage) for gDNA extraction and (2) inoculation of six 50-ml ‘generation zero’ cultures at an OD600 nm of 0.3 (around 1,912× library coverage) in 250-ml Erlenmeyer flasks. Of the six cultures, three replicates received ATc (100 ng ml−1) and three served as untreated controls. Time points occurred every 2 generations through 20 generations. Generations were calculated empirically using the optical density of the cultures at each time point. Because the libraries target essential genes, +ATc cultures exhibit a growth defect relative to –ATc cultures. To account for this difference in doubling time, +ATc and –ATc cultures were collected at different times so that they differed by no more than 0.5 generations at the time of collection. At each time point, 10-ODU samples were collected for gDNA extraction, and cultures were back-diluted to an OD600 nm of 0.3 with ATc replenishment, maintaining CRISPRi efficacy and a tight OD600 nm range defined by library coverage requirements (lower bound) and sustained log-phase growth (upper bound).
Mtb
Both Mtb screens were performed similarly to the Msm screen, with shared modifications including growth in T-225 vented tissue culture flasks, use of 7H9 medium containing OADC instead of ADC (see ‘Mycobacterial cultures’) and a higher concentration of zeocin (20 µg ml−1). Screen-specific differences were as follows. Experiment 1 used 100 ng ml−1 ATc and was initiated from RLGGI003B glycerol stocks with similar attention to library coverage considerations as described for the Msm screen. Time points occurred every 2.5 generations through 30 generations, with back-dilution to a minimal OD600 nm of 0.2 (around 1,346× library coverage). Up to generation 10, samples from every 2.5 generations were sent for sequencing. From generation 10 to generation 30, samples from every 5 generations were sent for sequencing. Experiment 2 used 500 ng ml−1 ATc and was initiated directly from the pooled library filtrate. Time points matched those used in Msm, with back-dilution to a minimal OD600 nm of 0.25 (around 1,682× library coverage).
CGI screens
CRISPRi drug profiling screens were initiated by thawing two 1-ml aliquots of RLC25. Each aliquot (one OD580 nm unit) was inoculated into 24 ml 7H9 supplemented with kanamycin (10 μg ml−1) in separate 75-cm2 vented tissue culture flasks (starting OD580 nm ≈ 0.04). Cultures were expanded for five days to an OD580 nm of about 1.2, then pooled and passed through a 10-μm cell strainer to obtain a single-cell suspension. The single-cell suspension was diluted to an OD580 nm of 0.5 in a total volume of 75 ml 7H9; ATc was added at a concentration of 100 ng ml−1 to initiate target pre-depletion; and the culture was split across three 75-cm2 flasks. After 24 h of incubation, the pre-depletion cultures were pooled and used to inoculate triplicate cultures at an OD580 nm of 0.05 in 3.3 ml 7H9 medium, supplemented with ATc (100 ng ml−1), kanamycin (10 μg ml−1) and the compound under investigation (dissolved in dimethyl sulfoxide; DMSO). Drug concentrations ranged from 0.03125-fold to twofold the pre-determined minimum inhibitory concentration yielding 90% growth inhibition (MIC90), for a total of nine drug concentrations alongside the no-drug (DMSO-only) control. Cultures were grown in 12.5-cm2 vented tissue culture flasks for 14 days at 37 °C with 5% CO2 with replenishment of ATc on day 7. After 14 days, OD580 nm values were measured to determine the experimental MIC90 for each compound, and all cultures were collected for gDNA extraction.
Genomic DNA extractionGI experiments
Ten ODU of culture were centrifuged at 4,000 rpm and washed with phosphate-buffered saline (PBS) containing 0.05% Tween-80. Cell pellets were resuspended in a 1:1 mixture of TE buffer (10 mM Tris and 1 mM EDTA, pH 8.0) and phenol:chloroform:isoamyl alcohol (25:24:1; PCI), transferred to tubes prefilled with 0.1-mm silica beads (MP Biomedicals, 1169110-CF) and mechanically lysed using two 30-s cycles at 10,000 rpm on a Precellys Evolution homogenizer. After phase separation by centrifugation, the upper aqueous phase containing gDNA was transferred to a new tube. For Mtb-derived samples, a second 1:1 PCI extraction was performed in the presence of 500 mM NaCl, with gentle mixing followed by 30-min incubation at room temperature. The aqueous phase—either singly (Msm) or dually (Mtb) extracted—was treated with RNase A at 37 °C for 45 min to degrade RNA. A final 1:1 chloroform extraction was performed to remove residual phenol, after which gDNA was recovered by alcohol precipitation. To each sample, 1/10 volume of 3 M sodium acetate (pH 5.2) and 1/300 volume of GlycoBlue (Thermo Fisher Scientific, AM9516) were added, followed by either 1 volume of isopropanol (Mtb) or 2.5 volumes of ethanol (Msm). Samples were incubated overnight at –20 °C, then centrifuged to pellet the DNA. The pellet was washed twice with 70% ethanol and resuspended in either molecular-biology-grade water or elution buffer (QIAGEN, 19086). DNA concentration was measured with a Qubit 2.0 Fluorometer (Invitrogen) to ensure accurate input into library amplification reactions.
CGI experiments
Genomic DNA was extracted using the Omega Bio-Tek Mag-Bind Universal Pathogen DNA Kit (M4029), along with a Geno/Grinder for cell lysis and a Hamilton Starlet for partial automation. The 3.3-ml cultures were transferred to 2.2-ml 96-well deep-well plates, with 2 ml of each culture allocated to one plate for extraction and the remaining volume to a second plate as a back-up. All plates were centrifuged (4,000 rpm, 10 min) to pellet the bacteria, and the supernatant was discarded. Back-up plates were covered with foil seals, bagged and stored at –80 °C. For the extraction plates, each pellet was resuspended in 520 μl SLX-Mlus buffer, and foil seals were applied. Plates were incubated at 80 °C for 1.5 h to achieve heat inactivation, allowing removal from the BSL-3 facility. After brief centrifugation (4,000 rpm, 1 min) to facilitate clean detachment of the foil seals, plate contents were transferred to an EZ-96 disruptor plate and resealed for mechanical lysis on a Geno/Grinder (2 × 1-min cycles at 1,750 rpm). After centrifugation (2,000g, 1 min) and unsealing, 53 μl DS buffer and 20 μl proteinase K were added to each well. Plates were resealed, vortexed and incubated at 70 °C for 15 min, with an additional vortexing step at the halfway point. Plates were again centrifuged (4,000 rpm, 10 min) and unsealed, and the remainder of the extraction process was done using a Hamilton Starlet liquid handling system. During this process, 300 µl was transferred from each well of the disruptor plate to the corresponding well of a 1.7-ml 96-well deep-well plate. To each well, 300 µl RBB buffer, 300 µl XP2 binding buffer and 20 µl Mag-Bind Particles RQ were added. Plates were vortexed at 1,000 rpm and incubated at room temperature for 10 min. Each plate was then placed on a magnetic separation device, and after 5 min the supernatant was aspirated and discarded. Plates were removed from the magnetic device, and 600 µl VHB buffer was added to each sample. Plates were vortexed, incubated at room temperature for 2 min and returned to the magnetic device. The supernatant was removed, and the VHB wash was repeated once. This procedure was then repeated using SPM buffer. After removal of the final supernatant, the magnetic beads were allowed to dry on the magnetic device at room temperature for 10 min. Subsequently, 50 µl of EB buffer was added to each well, plates were vortexed and samples were heated to 70 °C for 5 min on a heating station. Plates were then returned to the magnetic device, and 50 µl of gDNA from each well was transferred into the corresponding well of a clean 96-well PCR microplate. DNA concentration was measured with a Thermo Fisher Scientific NanoDrop ND-8000 spectrophotometer.
Library preparation for Illumina sequencingGI libraries
Illumina libraries were constructed as described previously10, with two key modifications—increased gDNA input and the use of custom amplification and sequencing primers—to accommodate the increased size and unique design of GI libraries. The barcode region was amplified from gDNA using NEBNext Ultra II Q5 Master Mix (NEB, M0544). The two barcodes are separated by only 6 bp, which minimizes template switching during amplification for deep sequencing. For the Msm screen, as well as for Mtb experiment 2, 4 µg of gDNA input was used, corresponding to around 5.6 × 10⁸ genome copies and around 238× library coverage for Msm, and around 8.9 × 10⁸ genome copies and around 398× library coverage for Mtb. For Mtb experiment 1, 2 µg of gDNA input was used, corresponding to around 199× library coverage. PCR cycling conditions were: 98 °C for 45 s; 12 cycles of 98 °C for 10 s, 64 °C for 30 s and 65 °C for 20 s; 65 °C for 5 min. Each PCR reaction included a common forward primer (0.5 μM final concentration) and a unique indexed reverse primer (0.5 μM). The forward primer contained a P5 flow cell attachment sequence. The reverse primer contained a P7 flow cell attachment sequence, a unique index for multiplexing and a standard Illumina read 2 sequencing primer binding site. After PCR amplification, each approximately 350-bp amplicon was purified using sparQ PureMag beads (Quantabio, 95196) using two-sided selection (0.75× and 0.12×). Eluted amplicons were quantified with a Qubit 2.0 Fluorometer, and amplicon size and purity were quality-controlled by visualization on an Agilent 4200 TapeStation (Agilent Technologies G2991AA, 5067-5585 and 5067-5584). To assess library quality and ensure equal read depth across samples, individual amplicons were at first pooled in equal volumes and sequenced on an Illumina MiSeq according to the manufacturer’s instructions. To increase sequence diversity, a PhiX spike-in of 10% (PhiX Control v3; Illumina, FC-110-3001) was included. Sequencing was performed in single-read mode (1 × 50 bp) with an 8-bp i7 index read. A custom sequencing primer binding immediately adjacent to the barcode cassette was spiked into the standard Illumina read 1 primer mix to enable sequencing of both sample barcodes and PhiX DNA. After the MiSeq run, amplicons were repooled such that the volume of each sample was scaled according to its read count. The rebalanced pool was then sequenced on an Illumina NovaSeqX Plus sequencer according to the manufacturer’s instructions, using the same sequencing conditions as in the MiSeq run. Library amplification primers and the custom sequencing primer are listed in Supplementary Table 6.
Amplicon libraries from plasmid DNA were prepared using the same protocol as for gDNA, except that 10 ng DNA input and 11 PCR cycles were used. For validation of single-sgRNA libraries, sequencing was performed using the Illumina MiSeq Nano platform with 25-bp reads (sufficient because of the lower library complexity and single-barcode design).
RLC25
Illumina libraries were constructed as described previously39.
Quantification and statistical analysisQuantification of sgRNA depletion
Sequencing reads were aligned to a reference set of expected sequences using subread-align (v.1.6.0) with default parameters80. For GI libraries, the reference set included barcode pairs, and read counts were subsequently assigned to the corresponding sgRNA pairs. For RLC25, the reference set included the sgRNA sequences themselves. Differences in sequencing depth between samples were normalized using the trimmed total reads (TTR) method73.
Depletion of sgRNA pairs in GI screens was quantified by estimating the L2FC of the mean counts in the +ATc samples relative to the mean counts in the –ATc samples. The pairs containing two non-targeting control sgRNAs were used in a second normalization step that sets their median L2FC as equal to 0, controlling for the enrichment of non-targeting guides in the library10. Finally, L2FC data points were subjected to quality-control filters, including removal of points that flatlined10 or reached the limit of detection (fewer than five mean observed reads). sgRNA pairs with fewer than three data points passing quality control were excluded from further analysis.
Depletion of sgRNAs in chemical–genetic screens was quantified by MAGeCK81 (v.0.5.7), using the alphamedian method and normalizing counts relative to non-targeting controls (using the flags ‘–gene-lfc-method alphamedian –norm-method control’).
Modelling sgRNA depletion over time
The depletion of sgRNA pairs in GI experiments was modelled using a previously established Bayesian piecewise linear regression model, referred to as a two-line model10. In brief, the parameters αl and βl represent the intercept and depletion of the initial phase of depletion, which then transitions at a point γ, to a second phase with a rate of depletion βe. With this model, a prediction of L2FC at a generation, G, can be obtained as follows:
$$\text{L2FC}(G)={\alpha }_{{\rm{l}}}+{\beta }_{{\rm{l}}}G\,\,\,\,\,{\rm{If}}\,G\le \gamma $$
$$\text{L2FC}(G)=({\alpha }_{{\rm{l}}}+{\beta }_{{\rm{l}}}\gamma )+({\beta }_{{\rm{e}}}(G-\gamma ))\,\,\,\,{\rm{If}}\,G > \gamma $$
Quantification of GIsGI score
Samples from the Bayesian two-line model were obtained for all sgRNA pairs using Stan (cmdstan v.2.35, cmdstanpy v.1.2.4)82. To quantify a GI score, we first defined the degree to which pairs of sgRNAs deviated from expectations using an additive model of L2FC (which is equivalent to a multiplicative model in linear space)83. Single-targeting pairs, in which a targeting sgRNA is paired with a non-targeting control, are used to determine the fitness effect of knocking down a particular gene. Expected effects of knocking down two genes are therefore taken as the sum of individual effects:
$$E[{g}_{1}=a,{g}_{2}=b]=\text{L2FC}(G|{g}_{1}=a,{g}_{2}=\text{NT})+\text{L2FC}(G|{g}_{1}=\text{NT},{g}_{2}=b),$$
where \(\text{L2FC}(G|{g}_{1}=a,{g}_{2}=b)\) represents the L2FC predicted by the Bayesian two-line model at generation G for a given pair of guides, a and b, at sgRNA positions 1 and 2, respectively, and NT represents the non-targeting controls. Deviations from expectations are then defined as follows:
$$\Delta \text{L2FC}(G|{g}_{1}=a,{g}_{2}=b)=\text{L2FC}(G|{g}_{1}=a,{g}_{2}=b)-E[{g}_{1}=a,{g}_{2}=b].$$
To summarize the deviations to a single value, we define ΔL2FC as the deviation from expectations at G = 25.
To address the possibility of a floor effect84 (cases in which the expected phenotype exceeds the maximal fitness cost that can be accurately detected in our experiment), a generalized additive model (GAM)85 was fitted using the bam function from the mgcv package (v.1.9-3) in R (v.4.3.1) to correct the observed deviations. Deviations were modelled as:
$$\Delta \text{L2FC}({g}_{1}=a,{g}_{2}=b) \sim \hat{s}(E[{g}_{1}=a,{g}_{2}=b]),$$
where \(\hat{s}\) is the penalized regression spline GAM (with k = 20, method = “ML”, scaled t-distribution family). By modelling deviations in this manner, the penalized smoothing encourages predictions to follow the observed trend in data-sparse regions (that is, a near-linear continuation of the observed versus expected relationship), effectively reducing abrupt changes in deviations when there is little data to support them. The final, corrected, deviations were thus calculated as:
$$\begin{array}{c}{\Delta }^{{\prime} }({g}_{1}=a,{g}_{2}=b)=\text{L2FC}({g}_{1}=a,{g}_{2}=b)\\ -(E[{g}_{1}=a,{g}_{2}=\,b]+\hat{s}(E[{g}_{1}=a,{g}_{2}=b])).\end{array}$$
Finally, the GI score for a pair of genes A and B was summarized as the median of the Δ′ for all of the guide pairs targeting those genes; that is,
$$\text{GI}(A,B)=\text{median}({\Delta }^{{\prime} }(A,B)).$$
Statistical significance
A Bayesian mixture model was used to identify statistically significant interactions. The mixture consisted of two distributions: a normal distribution representing the null hypothesis of no interaction with a prior mean of 0, and a uniform distribution representing the alternative hypothesis. The posterior probability of a GI score belonging to the alternative hypothesis was calculated, and interactions were classified as likely interactions if the posterior probability was greater than 0.5, and as confident interactions if the posterior probability was greater than 0.95. We use a cut-off of 0.5 for likely interactions because this corresponds to the point at which GI scores are more likely to be explained by the uniform distribution than by the normal distribution.
Joint GI model
To integrate the evidence from the two independent Mtb screens (experiment 1 and experiment 2) into a single, directly interpretable probability, a joint Bayesian mixture model was fitted to the paired GI scores. For each gene pair, the GI score in each experiment and its standard error (that is, mean GI score and the standard deviation of Δ′ from the Bayesian two-line model) were taken as the x,y coordinates and their measurement uncertainties.
The mixture consisted of five components defined over the range of GI scores: a null component and four interaction components, one for each quadrant. The null hypothesis of no interaction was represented by a bivariate normal distribution centred near the origin, with a correlation parameter, ρ, given a weakly informative prior centred at zero. Allowing ρ to be a free parameter allowed the model to learn any existing correlation observed in the null distribution, owing to each screen using the same library and protocols. Per-pair measurement error was incorporated into the null by adding each pair’s squared standard error to the variance on the corresponding axis and scaling ρ accordingly (see Stan model code for implementation details). This approach incorporates the uncertainty associated with each GI-score estimate, down-weighting imprecise measurements while integrating both the consistency and the precision of observed effects across the two screens.
The four interaction components corresponded to the concordant negative quadrant, the concordant positive quadrant and the two discordant quadrants in which the two experiments disagreed in sign (one positive and the other negative). Each quadrant was modelled as a product of per-axis uniform densities over the range of observed scores, which were winsorized at the 0.1st and 99.9th percentiles to reduce the influence of outliers. Because pairs near a quadrant edge could belong to a neighbouring quadrant owing to measurement uncertainty, the uniform densities were convolved with the per-pair measurement error at the origin. Thus, a pair lying near an axis is assigned partly to each quadrant, and the model identifies the most likely membership from the mixture. The mixture weights were given a Dirichlet(2, 2, 36) prior over the concordant, discordant and null components, placing an 18-fold higher weight on the null, reflecting the expectation that most gene pairs do not interact. Concordant and discordant weights were divided evenly between their two respective quadrants (two discordant quadrants and the concordant positive and concordant negative quadrants). The model was fitted using Stan (cmdstan v.2.35, cmdstanpy v.1.2.4). For each gene pair, the posterior probability of belonging to each component was computed and summarized as the probability of a negative, positive or discordant interaction, and of no interaction. As in the single-experiment analysis, a pair was classified as a likely interaction when the largest of its interaction-class probabilities exceeded 0.5 and as a confident interaction when it exceeded 0.95, and was labelled negative, positive or discordant according to the dominant class.
Hierarchical clustering analysis
To explore patterns of similarity in GI profiles, the GI matrix was hierarchically clustered using average linkage with Pearson correlation as the similarity measure, as implemented in SciPy86. At each internal node of the clustering hierarchy, the descendant genes were tested for Gene Ontology (GO) enrichment using GOATOOLS87. GO annotations were obtained from UniProt and mapped to the go-basic ontology, with the full set of genes in the GI map used as the background. Enrichment P values were calculated using Fisher’s exact test and corrected for multiple-hypothesis testing using the Benjamini–Hochberg procedure. Nodes were designated as key nodes when they represented the most significant occurrence (false discovery rate (FDR) < 0.005) for at least one biological process term. Each key node was labelled with its most significant GO term, and a GO-DAG specificity constraint was enforced such that no parent node carried a more specific term than its descendants. To reduce redundancy, key nodes with highly overlapping parent gene sets (Jaccard ≥ 0.8) were removed. Distinct colours were assigned to the remaining key nodes and propagated through their descendant branches, producing functionally labelled dendrograms in which leaves inherited the most specific term in their lineage.
Pathway enrichment
Pathways were defined using a combination of KEGG and PATRIC pathways together with manual curation (Supplementary Table 4). Genes were assigned to pathways on the basis of manual curation and AI-assisted literature review (Claude Sonnet 4.5). Gene pairs were categorized as having a significant GI (p > 0.5) or not, and Fisher’s exact test was used to assess the association between pathway pairs and significant GIs. Self-interactions, in which a gene is targeted twice (that is, A + A), were excluded from the analysis. The resulting P values were adjusted for multiple comparisons using the Benjamini–Hochberg procedure. The analysis was performed twice: once using all gene pairs and once excluding potential polar effects (defined as pairs in which the genes were five genes or fewer apart), to assess how significance changed.
Co-folding
Sequences for selected genes were co-folded with AlphaFold-Multimer28 (v.3) to predict protein complex structures and AlphaFold34 to predict PPIs. All model inputs for Mtb used amino acid sequences from the H37Rv reference proteome (UniProt: UP000001584). All model inputs for Msm used amino acid sequences translated using BioPython from strain mc2155 (RefSeq: NC_008596.1), with the following exceptions. MSMEG5414 in the reference genome was split into proteins MSMEG5414A and MSMEG5414B. Four genes are misannotated in the reference genome as pseudogenes, and their translations were manually included: MSMEG4629:folC and MSMEG1828 from another genome (GenBank: CP009494); MSMEG1843:ahcY from UniProt (accession A4ZHR8); and MSMEG1400:fusA1 from a previously reported sequence88,89. All sequence inputs for Msm can be found in the file msm_essential_proteome.fa in our linked GitHub repository (see ‘Code availability’). AlphaFold-Multimer inputs were formatted as pairs of monomers28. These complexes were predicted using LocalColabFold90 v.1.5.5 (https://github.com/YoshitakaMo/localcolabfold)90 on an NVIDIA L40S GPU and 16 24-GB CPUs. The model was run with three recycles and AMBER relaxation. AlphaFold3 inputs were prepared following a modified pooled AlphaFold3 approach27. Within the bin-packing strategy, smaller protein sequences were prioritized to maximize the number of monomers per pool. In both cases, five predicted structures were generated per input. Predicted TM scores (pTMs) and interface predicted TM scores (ipTMs) for any given gene or gene pair, respectively, were taken as a mean across all models. ipTMs were corrected for combined protein length as previously described27. In Supplementary Tables 2 and 3, columns from pooled inputs on the web server have the suffix or infix ‘_webserver’.
Structures and scores were also generated locally for Mtb using the same pooled inputs as the AlphaFold3 web server. Per-chain multiple sequence alignments were generated with ColabFold v.1.5.590 using MMseqs2 18.8cc5c91 against the UniRef30 (2023-02) and ColabFold environmental clusters (2021-08; comprising filtered BFD, MGnify, MetaEuk and SMAG sub-databases), with GPU-accelerated prefiltering (–gpu 1 –prefilter-mode 1). The output was written directly in AlphaFold3-compatible JSON form (–af3-json), yielding one unpaired multiple sequence alignment per chain. To avoid recomputing identical alignments across the many overlapping pools in this study, sequences were keyed by SHA-256 hash and computed only once; an indexed central cache of all previously generated alignments (about 3,800 unique sequences) was consulted on every job, with cache hits delivering byte-identical multiple sequence alignments and cache misses triggering a fresh ColabFold run that subsequently updated the cache. Co-folding was performed with AlphaFold3 v.3.0.14 executed inside an Apptainer/Singularity container on NVIDIA H100 80GB HBM3 GPUs. For each pool, the per-chain multiple sequence alignments were combined into a single AlphaFold3 input JSON (dialect alphafold3, version 1), populating unpairedMsa from the ColabFold output; pairedMsa was left empty, deferring to AlphaFold3’s internal pairing logic. AlphaFold3 was invoked via run_alphafold.py with –flash_attention_implementation=triton and –resolve_msa_overlaps=false; all other parameters retained their AlphaFold3 defaults. A single random seed (modelSeeds = [1]) was used per input, producing five diffusion-sampled structures per pool from which downstream pTM and ipTM statistics were derived as described above. In Supplementary Table 3, the resulting columns have the suffix or infix ‘_local’.
For both the local and the web-server results, the total number of predicted PPIs for each single protein is listed with the prefix ‘degree’, following notation from graph theory. Each of these columns is suffixed with 1 or 2 to indicate the monomer to which it corresponds. These degrees are calculated cumulatively at three ipTM cut-offs (see Fig. 3f): for example, ‘degree_low_webserver1’ refers to all PPIs predicted for gene 1 with low or higher confidence using the web server.
Minimum inhibitory concentration assay
All compounds were dissolved in DMSO (VWR, V0231) and dispensed using an HP D300e digital dispenser in a 384-well plate format using a twofold dilution series. DMSO did not exceed 1% of the final culture volume and was maintained at the same concentration across all samples. Cultures were synchronized in late logarithmic phase (OD600 nm = 0.2 to 1) and then back-diluted to a starting OD600 nm of 0.01 or 0.05. Fifty microlitres of cell suspension was plated in triplicate in wells containing the test compound. Plates were incubated standing at 37 °C with 5% CO2. The OD600 nm was evaluated using a Tecan Spark or Molecular Devices SpectraMax M2 microplate reader 7–14 days after plating, and the percentage growth was calculated relative to the DMSO vehicle control for each strain. MIC90 and MIC50 measurements were calculated in R using the drm function from the drc package92, with a four-parameter log-logistic model (LL.4). For all MIC curves, data are mean ± s.e.m. for triplicates.
Checkerboard synergy assay
Compounds were dispensed in a 384-well plate as described above for the MIC assays. For each pair of drugs, all combinations of the two-dilution series were plated, including dilution series in which each drug is present alone and a DMSO control in which neither drug is present. Each combination of concentrations was plated in triplicate. Cultures were grown and plated and the relative growth was measured as described for MIC assays, except that the cultures were seeded at OD600 nm = 0.025. Drug synergy was quantified using the synergyfinder v.3.14.0 R package93. For each checkerboard, mean percentage viability values were used to calculate the Bliss independence score94,95 at each combination of drug concentrations. The resulting scores were then scanned to find the most synergistic area (MSA) and most antagonistic area (MAA). These areas were defined as the 3 × 3 contiguous areas of the plate with the highest and lowest mean Bliss scores, respectively. The mean Bliss scores of the MSA and MAA are reported for each drug combination. Both metrics are reported to avoid bias in calling a drug pair synergistic or antagonistic. Following recommended guidelines96, drug pairs with an MSA mean Bliss score higher than 15 were considered synergistic, and drug pairs with an MAA mean Bliss score lower than –15 were considered antagonistic.
Kill curve drug synergy assay
A wild-type H37Rv culture was diluted to an OD600 nm of 0.05, and 500 μl of culture was added to each well of 24-well plates. Vertex-49 (6.25 μM or 12.5 μM) was added alone or in combination with either bedaquiline (0.45 μM or 0.89 μM) or ethambutol (3.61 μM or 7.21 μM) in triplicate for each concentration combination. Cultures were grown standing at 37 °C for 6 days and then plated in serial dilutions from 10−1 to 10−7 on 7H10 charcoal plates. Plates were grown for 21 days, and then colony-forming units (CFU) were counted. Because we did not have a full panel of concentration combinations, we opted to use the highest single agent (HSA) method of quantifying drug synergy97. In brief, the amount of killing (measured as the change in CFU per ml versus the no-drug control) with the combination of the two drugs is compared to the drug that shows the highest growth inhibition (the HSA) when used alone at the same concentration. The drug pair is considered synergistic if the combination of drugs results in more than 100-fold more killing than the HSA.
Methylene blue oxygen consumption assay
Cultures were grown for 5 days in 7H9-OADC with 100 ng ml−1 ATc to pre-deplete protein targets. The cultures were then washed twice in PBS containing 0.05% Tween-80 and adjusted to an OD600 nm of 0.15 with fresh 7H9-OADC. After dilution, 4-ml screw-cap glass vials were filled with the cultures, and methylene blue dye was added at a final concentration of 0.001% (w/v). All vials were sealed tightly using a PTFE–rubber seal (Thermo Fisher Scientific, C4015-21), wrapped with parafilm and incubated shaking at 60 rpm at 37 °C in an anaerobic pouch (Becton Dickinson GasPak EZ container systems, BD 260683) for 3–4 days, after which photos were taken to determine whether the cultures turned clear (intact respiration) or remained blue (impaired respiration).
Affinity purification and mass spectrometryMsm growth for protein purification
A 20-ml preculture of Msm in Middlebrook 7H9 medium (Sigma) supplemented with 0.5% (w/v) bovine serum albumin, 0.08% (w/v) NaCl, 0.2% (w/v) d-glucose and 0.05% (v/v) Tween-80 was grown at 30 °C with shaking at 180 rpm to saturation. Msm with pKM444 but no other genetic modification was grown without antibiotic in the preculture medium, whereas Msm modified with a 3×Flag tag encoded in its gDNA was grown with 50 µg ml−1 hygromycin in the preculture medium. Each preculture was used to inoculate 6 l of Middlebrook 7H9 supplemented with 0.08% (w/v) NaCl, 0.2% (w/v) d-glucose, 1% (w/v) tryptone and 0.05% (v/v) Tween-80, and was grown at 30 °C with shaking at 180 rpm for 48–72 h. The cells were collected by centrifugation at 6,500g for 20 min, and pellets were resuspended in 100 ml of 50 mM Tris-HCl pH 7.5, 150 mM NaCl, 5 mM MgSO4, 5 mM benzamidine HCl, 5 mM aminocaproic acid and 1 mM PMSF. The cells were lysed with the Avestin EmulsiFlex-C3 homogenizer at 20–25 kpsi, and the lysate was clarified by centrifugation at 39,000g for 30 min, followed by isolation of the membranes by centrifugation at 200,000g for 1 h. The membranes were resuspended in TBS (50 mM Tris-HCl pH 7.5, 150 mM NaCl) and solubilized for 1 h with 1% (w/v) dodecyl maltoside. Solubilized membranes were centrifuged at 200,000g for 1 h to remove insoluble material before binding to around 1 ml anti-Flag M2 Affinity Gel (Sigma) in a plastic column. The column was washed with ten column volumes of TBS containing 0.05% (w/v) dodecyl maltoside before eluting the bound protein with three column volumes of 150 µg ml−1 3×Flag peptide in TBS containing 0.05% (w/v) dodecyl maltoside, followed by one column volume of TBS containing 0.05% (w/v) dodecyl maltoside. The eluted protein was concentrated with a centrifugal concentrator with 10-kDa molecular weight cut-off.
Preparation of protein samples for mass spectrometry
Protein (10 µg) was reduced with 20 mM dithiothreitol for 10 min at 95 °C and alkylated with 40 mM iodoacetamide for 30 min in the dark. Samples were diluted to a final concentration of 5% (w/v) SDS, and phosphoric acid was added to a final concentration of 1.2% (v/v). S-Trap protein binding buffer (165 µl) containing 90% (v/v) methanol and 100 mM triethylammonium bicarbonate (TEAB) was added to 27.5 µl acidified sample. The resulting mixture was passed through an S-trap micro column at 4,000g. The micro column was washed four times with the S-Trap protein binding buffer. Each sample was digested with 4 µg of trypsin in 20 µl of 50 mM TEAB for 1 h at 47 °C. Before elution, 4 µl of 50 mM TEAB pH 8 was added to the column. Peptides were eluted by centrifugation at 4,000g. Peptides were eluted from the column two more times with 40 µl of 0.2% (v/v) formic acid and 40 µl of 50% (v/v) acetonitrile with 0.2% (v/v) formic acid. Eluted peptides were dried and stored at –40 °C before mass-spectrometry analysis at the Network Biology Collaborative Centre at the Lunenfeld-Tanenbaum Research Institute using standard protocols for data-dependent acquisition.
Analysis of mass-spectrometry data
The SAINTexpress98,99 software package was used to score protein interactions. In brief, peptide-level counts are summed for all detected proteins for both the tagged and the untagged samples (two replicates per condition). These were then used to obtain the protein-level L2FC of counts in the tagged samples relative to the untagged samples. The SAINTexpress package uses a Bayesian model to calculate the probability of an interaction for each protein and uses these probabilities to estimate the FDR.
IMV acidification assays
IMV acidification assays were performed as previously described51. In brief, the membrane fraction from wild-type, ∆qcrB and ∆ms2764 Msm strains were isolated and resuspended in IMV resuspension buffer (50 mM Tris-HCl pH 7.5, 150 mM NaCl, 5 mM MgSO4, 5 mM 6-aminocaproic acid, 5 mM benzamidine hydrochloride and 20% [v/v] glycerol). IMV acidification experiments were performed in 96-well plates (BRANDplates pureGrade 96-well black microplates). NADH and succinate were prepared as electron donors as follows. NADH was prepared immediately before use by dissolving disodium NADH in water to a final concentration of 4 mM. Succinate was prepared by dissolving sodium succinate in water to a final concentration of 20 mM. A master solution containing ACMA assay buffer (10 mM HEPES-KOH pH 7.5, 100 mM KCl and 5 mM MgCl2), 9-amino-6-chloro-2-methoxyacridine (ACMA) dye (3.125 µM), IMVs (5 mg ml−1 total protein concentration for succinate-driven acidification; 2 mg ml−1 total protein concentration for NADH-driven acidification) and 10 µM of Q203 (with a final concentration of 2% [v/v] DMSO) or an equivalent volume of compound-free DMSO vehicle was prepared and transferred into each well of the 96-well plate. The plate was incubated in the dark for approximately 15 min at room temperature before the start of the experiment. ACMA fluorescence was measured at 25 °C with a BioTek Synergy Neo2 Hybrid Multimode plate reader (Agilent Technologies), using an excitation wavelength of 410 nm and an emission wavelength of 480 nm. IMV acidification was initiated by the addition of NADH or succinate. Fluorescence was monitored for 20 min before the addition of nigericin in ethanol to a final concentration of 2 µM with 0.02% (v/v) ethanol. Fluorescence recovery was monitored for an additional 10 min. Fluorescence recovery was calculated as the absolute difference between the fluorescence immediately before and 10 min after nigericin addition. All IMV acidification experiments were performed with at least three replicates.
Sensor spot assays
Sensor spot assays were performed as described previously100.
Cell spotting assays
Cultures were grown and passaged twice to closely match optical densities. Final cultures were diluted to an OD600 nm of 0.17 (around 50,000 cells per μl), and tenfold serial dilutions were made. Multichannel pipettes were used to spot 2 μl of culture for each dilution onto 7H10 with or without ATc, with the appropriate selection of antibiotics. Images were taken after approximately 20 generations.
Reporting summary
Further information on research design is available in the Nature Portfolio Reporting Summary linked to this article.