
Cell lines
VCaP, LNCaP, 22Rv1, DU145, PC-3, MCF-7, HepG2, A549, K562, HL-60, U937, HEK293, WPMY-1, U-87 MG, BJAB, SK-ES-1, RD-ES, A204, PBMC, NCI-H526, AU565, MM1.S, SU-DHL-8 and NCI-H211 were purchased from American Type Culture Collection (ATCC). MOLT-16, NALM6, REH and TALL-1 were obtained from the German Collection of Microorganisms and Cell Cultures (DSMZ). CHLA-99, CHLA-258, CHLA-32, CB-AGPN, COG-E-352 and TC-205 were obtained from the Children’s Oncology Group (COG) Cell Line and Xenograft Repository. GM24694 was obtained from the Coriell Institute for Medical Research. PNT2 and MFM223 were obtained from Sigma-Aldrich. The Kelly cell line was obtained from European Collection of Authenticated Cell Cultures (ECACC). CADOES1 was obtained from Cell Lines Service (CLS). LK2 was obtained from the Japanese Collection of Research Bioresources (JCRB) Cell Bank. NB-1 was obtained from Sekisui XenoTech.
CWR-R1 cells (Sigma-Aldrich, SCC118) were provided by D. Vander Griend. SU-DHL-5 cells (ATCC CRL-2958/DSMZ ACC 571) were provided by the R. Ryan laboratory. TC-32 cells (COG Cell Line and Xenograft Repository) were provided by the E. R. Lawlor laboratory. T47D cells (ATCC HTB-133) were provided by the C. Speers Laboratory. SUM185PE cells (Asterand Bioscience) were provided by the Rae laboratory. WA72 is an in-house PDX-derived cell line established at the Michigan Center for Translational Pathology (MCTP), University of Michigan, and is not commercially available. All cell lines were cultured according to conditions recommended by the originating repository or providing laboratory, as appropriate.
Two cell lines used in this study, BJAB and U937, are listed in the International Cell Line Authentication Committee (ICLAC) Register of Misidentified Cell Lines. Both entries reflect historical contamination reports that have since been resolved. U-87 MG (obtained from ATCC) is also listed in the ICLAC Register (ICLAC-00535). This cell line was included at the specific request of a peer reviewer, to test compound activity in an AR+, non-prostate cancer cellular context, given reports that AR functions as an oncogenic driver in this model. This experiment was intended to provide broader context on compound selectivity across AR+ tumour types outside of prostate cancer, and not to draw conclusions regarding glioblastoma tissue-of-origin biology specifically. No other cell lines used in this study appear in the ICLAC Register.
All human cell lines were authenticated by short tandem repeat (STR) genetic testing. All cell lines were tested biweekly to be free of mycoplasma contamination.
Chemistry
Detailed synthesis and chemical data for all designed DALTAC molecules and negative controls are provided in the Supplementary Methods.
Antibodies
For immunoblotting, the following antibodies were used: p300 (Invitrogen: MA1-16608, 1:500); AR (Abcam: ab133273, 1:1,000); H2BK20ac (Cell Signaling Technology: 34156S, 1:1,000); H2BK16ac (Abcam: ab177427, 1:1,000); H3K27ac (Cell Signaling Technology: 8173S, 1:1,000); H2B (Active Motif: 39210, 1:1,000); H3 (Cell Signaling Technology: 3638S, 1:1,000); MYC (Cell Signaling Technology: 9402S, 1:1,000); KLK3/PSA (Dako: A0562, 1:1,000); NKX3-1 (Cell Signaling Technology: 83700S, 1:1,000); CCND1 (Abcam: ab16663, 1:1,000); vinculin (Cell Signaling Technology: 18799S, 1:1,000); GAPDH (Santa Cruz Biotechnology: sc-47724, 1:1,000); BRD4 (Bethyl Laboratories: A700-004CF, 1:1,000); AR-V7 (Cell Signaling Technology: 19672S, 1:1,000); HA tag (Cell Signaling Technology: 3724S, 1:1,000); CBP (Abcam: ab253202, 1:1,000); and V5 (Invitrogen, R960-25, 1:1,000). Horseradish peroxidase (HRP)-conjugated goat anti-rabbit (Bio-Rad; 1:10,000) and goat anti-mouse (Bio-Rad; 1:5,000) secondary antibodies were used.
For ChIP–seq, the following antibodies were used: H3K27ac (Diagenode: C15410196, 1 µg per million cells); p300 (Active Motif: 61401, 2 µg per million cells); H2BK20ac (Cell Signaling Technology: 34156S, 1 µg per million cells); AR (Abcam: ab108341, 2 µg per million cells); FOXA1 (Thermo Fisher Scientific: PA5-27157, 2 µg per million cells); BRD4 (Diagenode: C15410337, 2 µg per million cells); ERG (Cell Signaling Technology: 97249S, 2 µg per million cells); RNA Pol II (Diagenode: C15200253, 1 µg per million cells); CBP (Abcam: ab253202, 2 µg per million cells); SRC2 (Cell Signaling Technology: 96687S, 4 µl per million cells) and PR (Cell Signaling Technology: 8757S, 4 µl per million cells).
For immunoprecipitation, acetylated-lysine antibody (Cell Signaling Technology: 9441S) was used at 1 µg per 100 µg of lysate.
For immunofluorescent staining (COMET-mIF) and PLA assay, the following antibodies were used: p300 (Invitrogen: 33-7600, 1:150); CBP (Invitrogen: PA5-27369, 1:150); AR (Abcam: ab133273, 1:400); H3K27ac (Cell Signaling Technology: 8173S, 1:100); Ki-67 (Abcam: ab243878, 1:300); H2BK20ac (Abcam: ab177430, 1:250); CK8 (Abcam: ab53280, 1:50); ERG (Abcam: ab92513, 1:200); PSA (Cell Marque: 324M-16, 1:50); and MYC (Abcam: ab32072, 1:50).
For ELISA, the following antibodies were used: p300 (Cell Signaling Technology: 86377S, 1:1,000); and AR (Thermo Fisher Scientific: MA5-13426, 1:50).
Cell viability assay
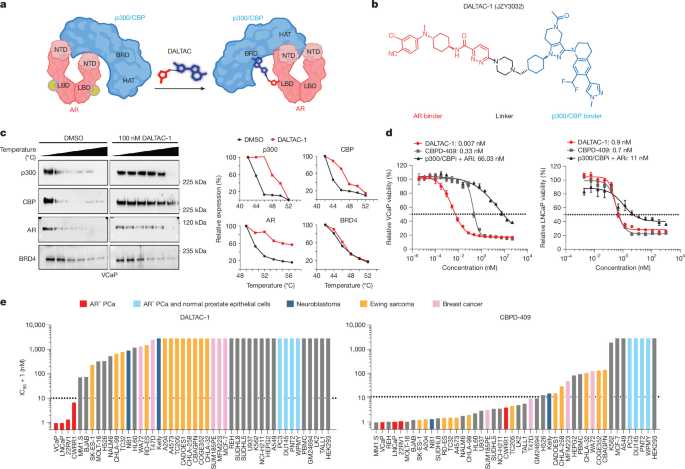
VCaP cells were seeded at a density of 10,000 cells per well, and all other prostate cancer cell lines were seeded at 3,000 cells per well in poly-d-lysine-coated 96-well plates (Corning) and maintained at 37 °C with 5% CO2. After 24 h, cells were treated with a serial dilution of test compounds, with 6 replicate wells for each concentration. Following 120 h of incubation, cell viability was determined using the CellTiter-Glo Luminescent Cell Viability Assay (Promega) according to the manufacturer’s instructions. Luminescence was measured on an Infinite M1000 Pro plate reader (Tecan) and data were analysed using GraphPad Prism (v10; GraphPad Software).
Incucyte proliferation assays
A total of 4,000 VCaP cells or 1,500 LNCaP cells per well were seeded into poly-d-lysine-coated 96-well plates. After 24 h of incubation, cells were treated with a fixed concentration (100 nM) or serial dilutions of compounds and incubated for 4 h. The medium was then removed, and cells were washed three times with phosphate-buffered saline (PBS) before fresh medium containing either vehicle or compounds was added. Phase-contrast images were collected every 4 h, and cell proliferation was quantified by measuring the percentage of confluence (phase object area).
Immunoblotting
Cells were lysed in RIPA buffer (Thermo Fisher Scientific) supplemented with 1× Halt Protease Inhibitor Cocktail (Thermo Fisher Scientific) and denatured in NuPAGE 1× LDS sample buffer containing a reducing agent (Invitrogen) by incubation at 70 °C for 15 min. Protein concentrations were determined using the Pierce BCA Protein Assay Kit (Thermo Fisher Scientific). Equal amounts of protein (15–30 µg) were resolved on NuPAGE 3–8% Tris-Acetate or 4–12% Bis-Tris protein gels (Thermo Fisher Scientific) and transferred onto 0.45-µm nitrocellulose membranes (Thermo Fisher Scientific) using the iBlot 3 Dry Blotting System (Thermo Fisher Scientific). Membranes were blocked in TBS-T (Tris-buffered saline with 0.1% Tween-20) containing 5% non-fat dry milk for 1 h at room temperature and incubated overnight at 4 °C with primary antibodies. After washing, membranes were incubated with HRP-conjugated secondary antibodies and imaged using an Odyssey CLx Imager (LI-COR Biosciences). Supplementary Figure 1 shows the full, uncropped blots with molecular weight markers for all immunoblot experiments.
Fluorescence polarization binding assays
The binding affinities of test compounds to AR and CBP/p300 were measured using fluorescence polarization-based competitive binding assays. AR binding was assessed using the PolarScreen Androgen Receptor Competitor Assay Kit (Thermo Fisher Scientific, A15880) following the manufacturer’s instructions.
CBP/p300 fluorescence polarization assays were performed in 96-well plates (MTP96VPWB-EP, Eppendorf) using a CLARIOstar microplate reader (BMG Labtech). Serial dilutions of test compounds were incubated with fluorescein-labelled tracer (2 nM final) and CBP/p300 protein (20 nM final) in assay buffer (PBS pH 7.4 supplemented with 0.01% BGG, 0.01% Tween-20, and 2 mM DTT) to a final reaction volume of 100 µl per well. Plates were mixed for 15 min and incubated at room temperature for 1 h to reach equilibrium. Fluorescence polarization (mP units) was measured at 485 nm excitation and 530 nm emission.
For both AR and CBP/p300 assays, data analysis was performed in GraphPad Prism 10 using nonlinear regression. IC50 values were determined by fitting competition curves, and inhibition constant (Ki) values for competitive inhibitors were derived using nonlinear regression based on the Kd of the tracer and the concentrations of tracer and protein in the reaction. All fluorescence polarization experiments were conducted in duplicates across three independent biological replicates.
Cellular thermal shift assay
VCaP or LNCaP cells were seeded in poly-d-lysine-coated 100 mm culture dishes (Corning) and incubated overnight. Cells were incubated with the DMSO control or indicated compounds for 4 h at 37 °C before being collected and washed once with PBS. The cell suspension was then distributed into PCR tubes (50 µl per tube) and exposed to a predefined temperature gradient for 3 min using a Veriti Thermal Cycler (Applied Biosystems). Following equilibration to room temperature, cells were lysed by three freeze–thaw cycles in liquid nitrogen. Insoluble protein aggregates were pelleted by centrifugation at 20,000g for 20 min at 4 °C, and the resulting supernatants containing soluble proteins were recovered for western blot analysis.
Computational modelling
All modelling and simulations were performed with Schrödinger 2025-2 (Schrödinger). Because co-crystal structures of the LBD of AR in an open antagonist conformation were not available, we used our previously reported pseudo-open model58. The bound AR ligand was modified to generate JZY3221, the AR ligand used in our design of DALTACs. To model the p300-BRD interaction with GNE-049, we used the CBP-BRD–GNE-781 co-crystal structure (Protein Data Bank (PDB) 5W0E) as the starting structure59. CBP and p300 are highly homologous proteins, especially in their BRDs, which share conserved sequence and structures. Both proteins were prepared for further modelling using the Protein Preparation Wizard60.
We used the following structures as inputs to generate the initial AR–DALTAC-1–p300 complex: (1) AR in complex with JZY3221; (2) the p300 complex with GNE-049; and (3) JZY3032 (DALTAC-1) prepared with LigPrep module61. These inputs were submitted to Generate Degrader Complex (default settings: MCMM 10,000 steps, maximum clashes 5, maximum poses 50) to construct the ternary AR–JZY3032–p300 complex. The top 20 predicted complexes were further refined using Prime62. The top-scoring ternary complex was then selected for molecular dynamics simulations.
To perform molecular dynamics simulations, the predicted ternary complex was solvated in an explicit water box with periodic boundary conditions. A cubic box was constructed with a 10 Å buffer between solute and box edge and filled with TIP4P water63. The OPLS4 force field was used for all components. Production dynamics used a RESPA integrator with a 2 fs time step. Temperature was maintained at 300 K with a Nosé–Hoover chain thermostat64 (relaxation time 1.0 ps). Pressure was controlled at 1 atm with a Martyna–Tobias–Klein barostat65 (relaxation time 2.0 ps). Long-range electrostatics used a 9 Å real-space cutoff with particle–mesh Ewald for reciprocal space66. One continuous 1-µs simulation was performed without restraints.
Root-mean-square deviation analysis of protein backbones and ligand position indicated that the system equilibrated after approximately 750 ns. Accordingly, trajectory analysis focused on the last 250 ns. Protein–protein interface features were defined as minimum heavy-atom distances between AR and p300. Contacts shorter than 0.5 nm (5 Å) were retained. Principal component analysis was applied to these interface distances, and components explaining 95% of the variance were kept. The reduced data were clustered with HDBSCAN (min_cluster_size 25, centroids enabled)67. For each cluster, the frame closest to the centroid in principal component analysis space was saved as a representative PDB. Cluster occupancies are reported as percentages of frames per cluster. Protein–protein interaction fingerprints were computed with Schrödinger’s analyze_trajectory_ppi.py. Clustering in this reduced dimensional space revealed two dominant populations, with the most prevalent state comprising nearly 80% of the ensemble. The interaction analysis was performed on snapshots representative of this dominant state.
MM-GBSA calculations
MM-GBSA binding energies were estimated using Prime MM-GBSA (Schrödinger Release 2025-2; thermal_mmgbsa protocol) with the OPLS4 force field and the VSGB 2.0 implicit-solvent model68,69,70. Snapshots were sampled evenly from the final 250 ns of each trajectory, after which water molecules and ions were removed and each complex, receptor, and ligand were locally energy-minimized. The MM-GBSA binding energy was calculated as ΔGbind = Ecomplex − Ereceptor − Eligand, where ΔGbind is the estimated MM-GBSA binding energy and Ecomplex, Ereceptor and Eligand are the calculated MM-GBSA energies of the complex, receptor and ligand, respectively. For compound binding, DALTAC-1 was defined as the ligand and AR, p300, or AR + p300 as the receptor. For p300 association with the ternary complex, p300 (residues 1049–1160) was defined as the ligand and AR + DALTAC-1 as the receptor. To isolate the direct AR–p300 contribution in the induced geometry, DALTAC-1 was deleted from the same ternary snapshots, with p300 defined as the ligand and AR as the receptor. MM-GBSA values were used as model-dependent interaction-energy estimates to compare the relative stability of the modelled complexes and were not interpreted as experimental binding affinities.
Full-length AR protein expression and purification
AR protein was expressed according to the manufacturer’s protocol for the Expi293 PRO Expression System Kit (Thermo Fisher Scientific, A40003643). In brief, Expi293 PRO cells were transfected with the HA–AR expression plasmid and cultured for 24 h before the addition of 1 μM R1881. The cultures were then incubated for an additional 24 h, and cells were collected 48 h post-transfection. Cell pellets were washed and collected by centrifugation at 5,000 rpm for 10 min at 4 °C. The cells were resuspended in lysis buffer containing 50 mM Tris-HCl (pH 8.0), 150 mM NaCl, 100 nM R1881 and 0.5% NP-40, supplemented with cOmplete EDTA-free Protease Inhibitor Cocktail (Roche, 4693159001). Cells were lysed by sonication, and the lysates were clarified by centrifugation at 15,000 rpm for 40 min at 4 °C. The clarified lysate was incubated with anti-HA magnetic beads (Thermo Scientific, 88837) for 3 h at 4 °C. After binding, the beads were washed three times with wash buffer containing 50 mM Tris-HCl (pH 8.0), 150 mM NaCl, and 0.05% NP-40. Bound AR protein was eluted twice using elution buffer (50 mM Tris-HCl, pH 8.0, 150 mM NaCl, 100 nM R1881 and 0.05% NP-40) supplemented with 2 mg ml−1 HA peptide (Thermo Scientific, 26184). The eluted protein was further purified by size-exclusion chromatography using a Superdex 200 Increase 10/300 GL column (GE Healthcare) pre-equilibrated with gel filtration buffer containing 50 mM Tris-HCl (pH 8.0), 150 mM NaCl, 100 nM R1881, and 0.05% NP-40. Peak fractions containing purified AR protein were pooled to a final concentration of approximately 0.5 mg ml−1 and used for all subsequent studies.
Purified-protein AR–p300 immunoprecipitation assay
For each reaction, 15 μl of anti-HA magnetic beads (Thermo Fisher Scientific, 88837) was blocked with 0.3% BSA in PBS for 1 h at 4 °C and washed three times with AR protein buffer (50 mM Tris-HCl, pH 8.0; 150 mM NaCl; 0.05% NP-40) for 5 min per wash. Purified HA-tagged full-length AR (1 μg) was incubated with the blocked beads for at least 4 h at 4 °C. The beads were then washed three times with p300 protein buffer (25 mM HEPES-NaOH pH 7.5, 300 mM NaCl, 0.04% Triton X-100, and 0.5 mM TCEP) for 10 min per wash and incubated overnight at 4 °C with purified Flag-tagged p300 (Active motif, 81858) (200 ng or 1 μg) in 350 μl of p300 protein buffer containing the indicated compounds or an equivalent volume of DMSO. Beads were subsequently washed at least three times with p300 protein buffer containing the corresponding compounds for 10 min per wash. Bound proteins were eluted in SDS–PAGE loading buffer and analysed by immunoblotting.
Ternary complex formation by BLI
Anti-Flag IgG biosensors (Sartorius, 18-5187) were pre-equilibrated in assay buffer containing 25 mM HEPES-NaOH (pH 7.5), 300 mM NaCl, 10% glycerol, 0.04% Triton X-100, and 0.5 mM TCEP. N-terminal Flag-tagged full-length recombinant p300 protein (1 μg; Active Motif, 81858) was immobilized onto the biosensors at 25 °C until the binding signal reached a plateau. After immobilization, the biosensors were washed in assay buffer to remove unbound protein and minimize nonspecific binding.
The biosensors were then incubated with recombinant GST–His-tagged AR-LBD protein (Invitrogen, A15675) at varying concentrations in assay buffer containing either 10 μM DALTAC-1 or an equivalent volume of DMSO. The association phase was monitored, followed by transfer of the biosensors into assay buffer to measure dissociation. Binding data were analysed using Octet Analysis Studio 13.0 (Sartorius). Sensorgrams obtained in the presence of DMSO were used as reference controls and subtracted from those obtained with DALTAC-1. The reference-subtracted data were globally fitted to a 1:1 binding model to determine the equilibrium dissociation constant (Kd).
Proximity ligation assay
PLA was performed according to the manufacturer’s instructions (Navinci Diagnostics) using the Naveni TriFlex Cell kit for cultured cells (AR–p300) and the NaveniFlex Tissue Red kit for VCaP-CRPC tumour sections.
Cultured cells (Naveni TriFlex Cell) were fixed, permeabilized and blocked per kit protocol instructions. Primary antibodies against AR (1:400) and p300 (1:200) were applied in antibody diluent and incubated as recommended. After washes, Naveni proximity probes were added, followed by ligation and rolling-circle amplification steps according to the vendor’s workflow. Slides were counterstained with DAPI and mounted in antifade medium. PLA signals were visualized on a Zeiss LSM900 fluorescence microscope under identical exposure settings across conditions.
For formalin-fixed paraffin-embedded (FFPE) tumour sections (NaveniFlex Tissue Red), sections were deparaffinized, rehydrated and subjected to heat-induced epitope retrieval as specified by the kit. After blocking, primary antibodies against AR (1:1,000) and p300 (1:100) were applied in antibody diluent and incubated per protocol. Following washes, NaveniFlex proximity probes, ligation and amplification were performed according to the manufacturer’s instructions. Nuclei were counterstained with DAPI, slides were mounted and images were acquired on a Zeiss LSM900 microscope using matched acquisition parameters.
Where indicated, PLA puncta were quantified as foci per nucleus using standardized thresholds across groups.
Ternary complex ELISA assay
VCaP cells were plated in 96-well plates (50,000 cells per well) and cultured for 3 days in medium containing 5% charcoal-stripped FBS. Cells were treated with a serial dilution of DALTAC-1, Neg-1, or Neg-2 compounds for 3 h. Following treatment, cells were lysed in 1× AlphaLISA SureFire Ultra Lysis Buffer (PerkinElmer) for 30 min at 4 °C with gentle mixing.
For detection, high-binding MaxiSorp 96-well plates (Thermo Fisher Scientific) were coated overnight at 4 °C with 50 µl of anti-AR antibody (clone AR441, Thermo Fisher Scientific) diluted 1:50 in PBS. After washing with TBS-T and blocking with 5% BSA for 2 h at room temperature, 50 µl of cell lysate was added to each well and incubated for 1 h at room temperature. Plates were washed three times with TBS-T and then incubated overnight at 4 °C with rabbit anti-p300 (D8Z4E, 86377, Cell Signaling Technology) antibody diluted 1:1,000 in blocking buffer.
After washing, HRP-conjugated goat anti-rabbit secondary antibody (Bio-Rad, 1706515; 1:10,000 dilution) was added and incubated for 1 h at room temperature. Plates were washed seven or eight times with TBST, and chemifluorescent signals were developed using QuantaRed Enhanced Chemifluorescent HRP Substrate (Thermo Fisher Scientific). Fluorescence (excitation 570 nm, emission 585 nm) was immediately measured using a Tecan Infinite M1000 Pro plate reader, with readings taken at 5 and 15 min.
Nuclear immunoprecipitation
Cells (50 million) were washed once with ice-cold PBS, scraped, and pelleted at 500g for 5 min at 4 °C. The cell pellet was resuspended in 2 ml hypotonic buffer (20 mM HEPES-KOH pH 7.5, 10 mM KCl, 1 mM MgCl2, 0.1% Triton X-100, 15 mM β-mercaptoethanol) supplemented with protease and phosphatase inhibitors and rotated for 1 h at 4 °C. Nuclei were collected by centrifugation at 2,000g for 5 min at 4 °C, the supernatant (cytoplasmic fraction) was discarded, and nuclei were washed once with hypotonic buffer.
The nuclear pellet was lysed in 1 ml nuclear lysis buffer (20 mM HEPES-KOH pH 7.5, 150 mM NaCl, 10 mM KCl, 1 mM MgCl2, 0.5% Triton X-100, 15 mM β-mercaptoethanol) containing protease and phosphatase inhibitors and rotated for 1 h at 4 °C. Benzonase (500 U ml−¹; Sigma-Aldrich E1014) was added during lysis to digest nucleic acids. Lysates were clarified by centrifugation at 16,000g for 20 min at 4 °C, and the supernatant was collected and precleared with 50 µl Dynabeads Protein G magnetic beads (Thermo Fisher 10004D). Protein concentration was determined using the Pierce 660 nm Protein Assay (Thermo Fisher 22660).
For each immunoprecipitation, 400 µg of precleared nuclear lysate was incubated overnight at 4 °C with either anti-androgen receptor antibody (Abcam ab108341) or anti-p300 antibody (Active Motif 61401). Antigen–antibody complexes were captured with 30 µl Dynabeads Protein G for 2 h at 4 °C. Beads were washed three times with wash buffer (20 mM HEPES-KOH pH 7.5, 150 mM NaCl, 10 mM KCl, 1 mM MgCl2).
For immunoblotting, bound proteins were eluted in 1× NuPAGE LDS Sample Buffer (Thermo Fisher NP0007) supplemented with 50 mM DTT and subjected to SDS–PAGE. For mass spectrometry, washed beads were flash-frozen and stored at −80 °C for subsequent on-bead trypsin digestion.
RNA extraction and quantitative polymerase chain reaction
Total RNA was isolated using QIAzol Lysis Reagent (QIAGEN). In brief, 1 × 10⁶ cells were lysed in 700 µl QIAzol and incubated for 5 min at room temperature to allow for complete dissociation of nucleoprotein complexes. Following the addition of 140 µl chloroform, samples were vigorously mixed and centrifuged at 12,000g for 15 min at 4 °C. The aqueous phase was collected, mixed with 1.5 volumes of ethanol, and applied to a RNeasy Mini spin column (QIAGEN) for purification according to the miRNeasy Mini Kit protocol. RNA was eluted in RNase-free water, and the concentration and purity were assessed using a NanoDrop spectrophotometer (Thermo Fisher Scientific).
For quantitative PCR analysis, cDNA was synthesized from purified RNA using the Maxima First Strand cDNA Synthesis Kit (Thermo Fisher Scientific) according to the manufacturer’s instructions. qPCR reactions were performed with SYBR Green PCR Master Mix (Applied Biosystems) on a QuantStudio 7 Real-Time PCR System (Applied Biosystems).
Primers used in this study are listed below: GAPDH forward (F): ACAACTTTGGTATCGTGGAAGG and reverse (R): GCCATCACGCCACAGTTTC; KLK3/PSA F: GACCAAGTTCATGCTGTGTGC and R: CCACTCACCTTTCCCCTCAAG; TMPRSS2 F: GTCCCCACTGTCTACGAGGT and R: CAGACGACGGGGTTGGAAG; NKX3-1 F: CCCACACTCAGGTGATCGAG and R: GAGCTGCTTTCGCTTAGTCTT; MYC F: CCTGGTGCTCCATGAGGAGAC and R: CAGACTCTGACCTTTTGCCAGG; CCND1 F: GCTGCGAAGTGGAAACCATC and R: CCTCCTTCTGCACACATTTGAA.
Tandem mass tag proteomic analysis
Tandem mass tag (TMT) proteomic analysis was performed as previously described8, with minor modifications. VCaP cells were treated with DMSO or DALTAC-1 (JZY3032) in three independent biological replicates. Cell lysates were prepared, and protein concentrations were determined. For each sample, 75 µg of protein was reduced with 5 mM dithiothreitol, alkylated with 15 mM 2-chloroacetamide, precipitated with ice-cold acetone, and digested overnight with a trypsin/Lys-C mixture at a 1:50 protease-to-protein ratio. Peptides were labelled with TMTpro 16-plex reagents (Thermo Fisher Scientific, A44521), with DMSO replicates assigned to channels 126, 127N and 128N and JZY3032 replicates assigned to channels 130C, 131C and 132C. Labelled peptides were pooled and separated into 12 fractions by high-pH reversed-phase chromatography.
Fractions were analysed at the University of Michigan Proteomics Resource Facility using an Orbitrap Ascend Tribrid mass spectrometer equipped with a FAIMS source and coupled to a Vanquish Neo UHPLC system. Peptides were separated on an Easy-Spray PepMap Neo C18 column, and data were acquired using two FAIMS compensation voltages (−45 and −65 V) and a MultiNotch MS3 method to minimize reporter-ion ratio distortion. Data were processed using Proteome Discoverer v3.0 and searched against the Swiss-Prot Homo sapiens protein database (TaxID 9606; version 5 February 2025). Peptide-spectrum matches and proteins were filtered to a false-discovery rate of ≤1%. TMT quantification was based on high-quality MS3 spectra with an average signal-to-noise ratio of ≥10 and isolation interference of <50%.
Acetyl (lysine)-proteomics analysis
VCaP cells were treated with DMSO, 100 nM DALTAC-1 for 4 or 12 h, or a combination of p300/CBPi and ARi for 12 h, each in three biological replicates. The cells were then subjected to acetyl-lysine proteomics analysis as previously described8. In brief, total proteins were extracted, digested with trypsin, and acetylated peptides were enriched using anti–acetyl-lysine antibody–conjugated beads. Enriched peptides were analysed by nano-liquid chromatography with tandem mass spectrometry (nanoLC–MS/MS) on a Q Exactive HF mass spectrometer (Thermo Fisher Scientific), and raw data were processed using MaxQuant (v2.3.0.0) with acetyl-lysine and protein N-terminal acetylation set as variable modifications.
Protein Identification by LC–MS/MS
In-solution digestion: VCaP cells were treated with 100 nM DALTAC-1 (JZY3032) or DMSO for 4 h. Co-immunoprecipitation assays were performed as described above. The beads were resuspended in 50 µl of 0.1 M ammonium bicarbonate buffer (pH ~8). Cysteines were reduced by adding 50 µl of 10 mM DTT and incubating at 45 °C for 30 min. Samples were cooled to room temperature and alkylation of cysteines was achieved by incubating with 65 mM 2-chloroacetamide, under darkness, for 30 min at room temperature. An overnight (~16 h) digestion with 1 µg sequencing grade, modified trypsin was carried out at 37 °C with constant shaking in a Thermomixer. Digestion was stopped by acidification and peptides were desalted using SepPak C18 cartridges using the manufacturer’s protocol (Waters). Samples were completely dried using a vacufuge. The resulting peptides were dissolved in 8 µl of 0.1% formic acid/2% acetonitrile solution, and 2 µl of the peptide solution was resolved on a nano-capillary reverse phase column (Acclaim PepMap C18, 2 µm, 50 cm, Thermo Scientific) using a 0.1% formic acid/2% acetonitrile (buffer A) and 0.1% formic acid/95% acetonitrile (buffer B) gradient at 300 nl min−1 over a period of 180 min (2–22% buffer B in 110 min, 22–40% in 25 min, 40–90% in 5 min followed by holding at 90% buffer B for 5 min and requilibration with buffer A for 25 min). The eluent was directly introduced into the Orbitrap Fusion tribrid mass spectrometer (Thermo Scientific) using an Easy-Spray source. MS1 scans were acquired at 120K resolution (AGC target = 106; max IT = 50 ms). Data-dependent collision induced dissociation MS/MS spectra were acquired using the Top speed method (3 s) following each MS1 scan (NCE ≈ 32%; AGC target = 105; max IT 45 ms).
Proteins were identified by searching the MS/MS data against the UniProt human database (sp_canonical TaxID=9606, v2025-02-05) using Proteome Discoverer (v3, Thermo Scientific). Search parameters included MS1 mass tolerance of 10 ppm and fragment tolerance of 0.2 Da; two missed cleavages were allowed. Carbamidomethylation of cysteine was considered a fixed modification and oxidation of methionine, deamidation of asparagine and glutamine were considered as potential modifications. The false-discovery rate (FDR) was determined using Percolator, and proteins or peptides with a FDR of ≤1% were retained for further analysis.
RNA-seq and data analysis
VCaP cells were treated with 100 nM DALTAC-1 or a combination of 100 nM p300/CBPi and ARi for 4, 12 or 24 h, each in two biological replicates. The cells were then subjected to RNA-seq as previously described8. In brief, total RNA was extracted, and ribosomal RNA was removed using the RiboErase module of the KAPA RNA HyperPrep Kit (Roche). rRNA-depleted RNA was used for library preparation following the manufacturer’s protocol, and libraries were quality-checked on an Agilent 2100 Bioanalyzer before sequencing on an Illumina HiSeq 2500 platform (paired-end, 2× 100 bp). Sequencing reads were quantified with Kallisto (v0.50.1), normalized with edgeR (v3.34.1), and analysed for differential expression using limma-voom (v3.58.1). GSEA was performed using fgsea (v1.28.0), and data visualization employed tidyverse, gplots, ggplot2, gtable (v0.3.0), and EnhancedVolcano (v1.15.0) packages in R.
ChIP–seq and data analysis
ChIP–seq was performed as previously described8. In brief, cells were cross-linked in 1% formaldehyde, quenched with glycine, and lysed for chromatin extraction. Chromatin was sheared to 200–600 bp fragments using a Bioruptor (Diagenode) and subjected to immunoprecipitation with antibodies against transcription factors (AR, FOXA1, p300, ERG and BRD4) or histone marks (H3K27ac, H2BK20ac and RNA Pol II) using the iDeal ChIP–seq Kit (Diagenode). Drosophila spike-in chromatin (Active Motif, 53083) and spike-in antibody (Active Motif, 61686) were added during the overnight incubation. After reverse cross-linking and DNA purification, sequencing libraries were prepared and sequenced on an Illumina HiSeq 2500 platform. For PR, SRC2, and CBP ChIP–seq, we performed double-cross-linking. In brief, 10 million cells were cross-linked with 250 μl of 200 mM DSP (Thermo Fisher Scientific, 22585) for 30 min at room temperature. PBS was then added to a final volume of 9 ml, followed by 40 μl of 0.5 M EDTA. Formaldehyde (250 μl, 37%) was added, and the cells were incubated for an additional 10 min at room temperature. Cross-linking was quenched by adding 1 ml of 1.25 M glycine and 200 μl of 10% Tween-20, followed by incubation for 5 min. Samples were then processed according to the ChIP–seq protocol described previously.
ChIP–seq reads were trimmed using Trimmomatic (v0.39). Alignment was then performed separately to both the human genome (hg38) and the Drosophila genome (dm6) using BWA (v0.7.17-r1198-dirty). Low-quality and duplicate reads were filtered with SAMtools and Picard, respectively. Normalization ratios were calculated based on the lowest amount of uniquely aligned reads per ChIP target to each genome as recommended on the vendor’s website. Reads were then downsampled per the normalization ratios. Peak calling was then performed with MACS2 (v2.1.1.20160309) using narrow or broad settings depending on the target, and blacklisted genomic regions were removed using BEDTools with the ENCODE exclusion list. Motif enrichment analysis was performed using HOMER (v4.10). Processed data were converted to BigWig format using UCSC wigToBigWig for visualization.
Enrichment heat maps and profile plots
Read density heat maps and average enrichment profiles were generated using deepTools. For histone marks, signals were plotted within ±2.5 kb of the reference point, and for transcription factors within ±1 kb. The parameters –skipZeros, –averageType mean, and –plotType se were applied. ENCODE blacklist regions (ENCFF356LFX) were excluded from analysis. Genomic interval operations were performed using the IRanges Bioconductor package (v2.36.0), and non-promoter regions were defined using the ChIPseeker R package tool annotatePeak excluding ±1 kb windows surrounding annotated gene transcription start site regions. Peak overlap and annotation analyses were additionally performed using the ChIPpeakAnno R package (v3.6.5).
Prostate organoid culture
Mouse prostate organoids and patient-derived xenograft organoids were established and maintained following previously described protocols41,71. In brief, organoids were cultured in 50 µl Matrigel domes and overlaid with prostate organoid medium, with media changed every 2–3 days and passaging performed weekly. For growth and drug-response assays, organoid fragments were dissociated into single cells and used to generate new organoids (1,000 cells per dome for standard viability assays) in complete organoid medium. Cell viability was measured using the CellTiter-Glo 3D assay (Promega) according to the manufacturer’s instructions.
Animal studies
All animal procedures were approved by the University of Michigan Institutional Animal Care and Use Committee (IACUC; protocol PRO0001291) and performed in accordance with institutional guidelines. Male CB17 SCID mice, 4–6 weeks old, were procured from the breeding colony at the University of Michigan and maintained under specific pathogen-free conditions on a 12 h light:12 h dark cycle, with ambient temperature maintained at 18–23 °C and relative humidity maintained at 40–60%. Only male mice were used, as prostate cancer is specific to males.
Sample sizes for efficacy studies (n = 7–20 tumours per group) were chosen prospectively based on a power calculation: with >7 tumours per group, the study had an estimated 92.3% power to detect a 50% decrease in mean tumour volume or metastatic burden, assuming a coefficient of variation of 40%. No animals or data points were excluded from analysis. Mice were randomly assigned to treatment groups prior to dosing. Histopathological evaluation and immunohistochemistry-based scoring for drug toxicity studies were performed in a blinded manner by two independent pathologists; blinding was applied to other end-points (for example, tumour volume measurement). Per IACUC protocol PRO0001291, tumour burden was not permitted to exceed 4,186 mm3, and this limit was not exceeded in any experiment reported here.
Human prostate tumour xenograft models
Male SCID mice (6–8 weeks old) were obtained from the breeding colony at the University of Michigan and maintained under specific pathogen-free conditions. All animal procedures were approved by the University of Michigan IACUC (protocol PRO0001291). Subcutaneous xenograft tumours were established by injecting 3 × 10⁶ VCaP cells suspended in serum-free medium mixed 1:1 with Matrigel (BD Biosciences) into both dorsal flanks. Tumour growth was monitored weekly using digital calipers, and volumes were calculated as (π/6) × (length × width2). At study end-points, mice were euthanized, and tumours were excised and weighed.
The castration-resistant VCaP model was generated as previously described8. In brief, mice were castrated once tumours reached 150–200 mm³, and treatment with DALTAC-1 (30 mg kg−1 intraperitoneally or 60 mg kg−1 orally), combination of p300/CBPi (30 mg kg−1 orally) and ARi (10 mg kg−1 orally), or vehicle was initiated after tumour regrowth to baseline size for 24 days.
Tissue microarray generation
A tissue microarray (TMA) was created according to a design involving 8 unique cases from 4 different subgroups: vehicle (n = 2), p300/CBPi + ARi (n = 2), DALTAC-1 intraperitoneal (n = 2) and DALTAC-1 oral administration (n = 2). Two independent samples were selected from each subgroup. To ensure data reliability and representativeness, a replicate core from each sample was included in the TMA, resulting in a focused 16-core TMA. Technical details are as follows: in brief, FFPE donor blocks for the selected samples were chosen by two study pathologists (R.M. and S.M.) after reviewing the haematoxylin and eosin (H&E) staining. The pathologists then annotated the H&E slides to identify the most representative tumour area of interest (AOI) on the surface of each donor block. The Semiautomatic tissue arrayer from Beecher Instruments (Sun Prairie) was used to punch 1 mm-diameter cores from each marked region. These cores were carefully transferred into a recipient acrylic block in a grid-like pattern. Once transferred, the recipient block was incubated at 37 °C for 30 min to ensure proper fusion of the cores within the paraffin. The prepared TMA block was then sectioned at 4-μm thickness and stained with H&E to assess the quality of the final TMA.
Sequential multiplex immunofluorescence by COMET analysis
Four-micrometre-thick sections from the PDX TMA, mounted on positively charged slides, were cut and prepared according to the guidelines and recommendations. Subsequently, the slides were deparaffinized using a standard xylene and graded ethanol series, followed by heat-induced epitope retrieval (HIER) as per the Lunaphore COMET protocol to unmask target epitopes72. Automated sequential immunofluorescence (seqIF) staining was performed on the COMET instrument (Lunaphore) to enable highly multiplexed protein detection with the target primary antibodies. This process involved cycles of staining, imaging, and elution managed by the COMET Control software through controlled temperature and microfluidic reagent delivery. Each cycle included incubation with unconjugated primary antibodies, followed by species-specific fluorescently conjugated secondary antibodies (for example, Alexa Fluor 555 and 647), automated image acquisition including DAPI counterstaining, and complete antibody removal via elution. After the final staining cycle, the COMET Control software (v1.5.0.0) automatically stitched, aligned, and stacked images to produce a single OME-TIFF file for each sample. During post-processing, autofluorescence background was systematically subtracted using reference images acquired from unstained tissue sections at the beginning of the protocol.
Statistics used for sequential multiplex immunofluorescence
The raw prostate TMA data included single-cell measurements across multiple markers along with their spatial locations. Markers were grouped into two panels based on biological relevance, as shown in the plots. To normalize marker expression and reduce skewness, a log1p transformation (log1p(expression)) was applied. Outliers were identified and removed separately for each marker within each group. Outliers were defined as values exceeding ±5 median absolute deviations from the group-specific median. The median absolute deviation is a robust measure of statistical dispersion that calculates the median of the absolute deviations from the median, making it less sensitive to extreme outliers than standard deviation. This approach preserves most of the data while minimizing the impact of extreme values.
Prostate PDX models
The prostate cancer PDX models MDA-PCa-146-12 and MDA-PCa-183 were established and maintained as previously described8. MDA-PCa-146-12 is an AR+ and ERG+ adenocarcinoma PDX derived from the adenocarcinoma region of a primary prostate tumour with mixed adenocarcinoma–neuroendocrine morphology. MDA-PCa-183 is an AR+ and ERG+ adenocarcinoma PDX derived from a bone marrow aspirate of a treatment-naive patient with metastatic prostate cancer. Both models harbour PTEN loss and TP53 loss-of-function alterations. In brief, tumour fragments (~2 mm3) were implanted subcutaneously into the dorsal flanks of six- to eight-week-old male SCID mice bred in-house and propagated by serial passage. Once tumours reached approximately 200 mm3 using the formula (π/6) × (length × width²), mice were randomized into treatment groups. Mice bearing MDA-PCa-146-12 tumours received vehicle or DALTAC-1 (30 mg kg−1, intraperitoneally three times per week). Mice bearing MDA-PCa-183 tumours received vehicle, DALTAC-1 (30 mg kg−1, intraperitoneally three times per week), ARV-766 (10 mg kg−1, orally, 5 times per week), or enzalutamide (10 mg kg−1, orally, 5 times per week). Tumour volumes were measured weekly, and all procedures were conducted in accordance with protocols approved by the University of Michigan Institutional Animal Care and Use Committee (IACUC, protocol PRO0001291).
Statistics and reproducibility
All experimental procedures and statistical analyses were performed as previously described8. In brief, key experiments were independently repeated at least three times, with most quantitative assays carried out in biological replicates as noted. Representative images and immunoblots reflect reproducible results, and the number of biological replicates is provided in the figure legends. No data were excluded from analysis. For in vitro experiments, sample sizes were not predetermined by a statistical method and randomization was not applicable, as cells were allocated to experimental conditions under homogeneous culture conditions. For animal studies, sample sizes were determined prospectively (see Methods), and mice were randomly assigned to treatment groups. Histopathological and immunohistochemical scoring for drug toxicity studies were performed in a blinded manner by two independent pathologists; all other data collection and quantification relied on automated instruments or standardized computational pipelines and were therefore not blinded. Two-sided statistical tests were used unless otherwise stated. Comparisons between two groups used unpaired t-tests or Wilcoxon rank-sum tests, and multiple comparisons were corrected using the Benjamini–Hochberg method. Exact P values are reported in the figure legends.
Reporting summary
Further information on research design is available in the Nature Portfolio Reporting Summary linked to this article.