There hasn’t been a whole lot of change on the daily time frame across indices. The ($INDU/$DJIA/$DIA) has been indicating a possible breakout on the daily time frame, but it’s now looking so on the weekly time frame; this week is as good as any to see this happen.
There was a fresh ’buy’ trigger for On-Balance-Volume on this time frame to go with a recent ’buy’ trigger in the MACD. Higher volume accumulation is a bonus.
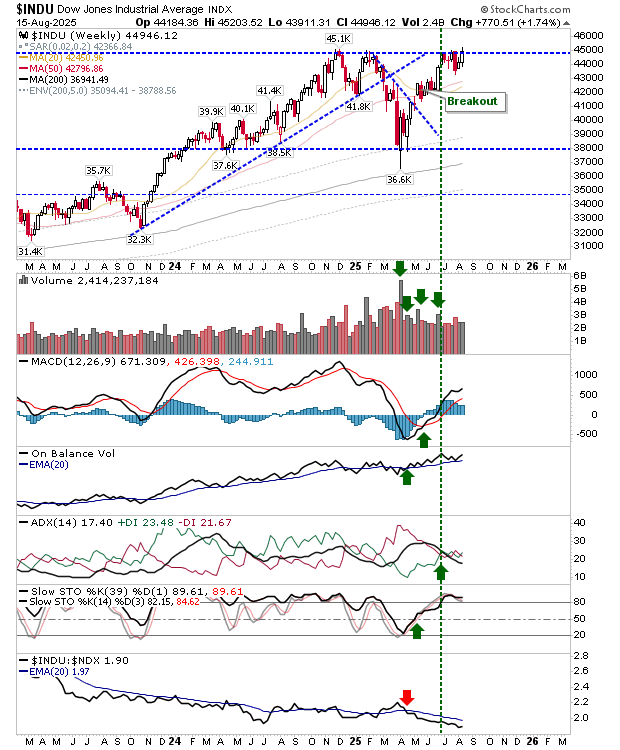
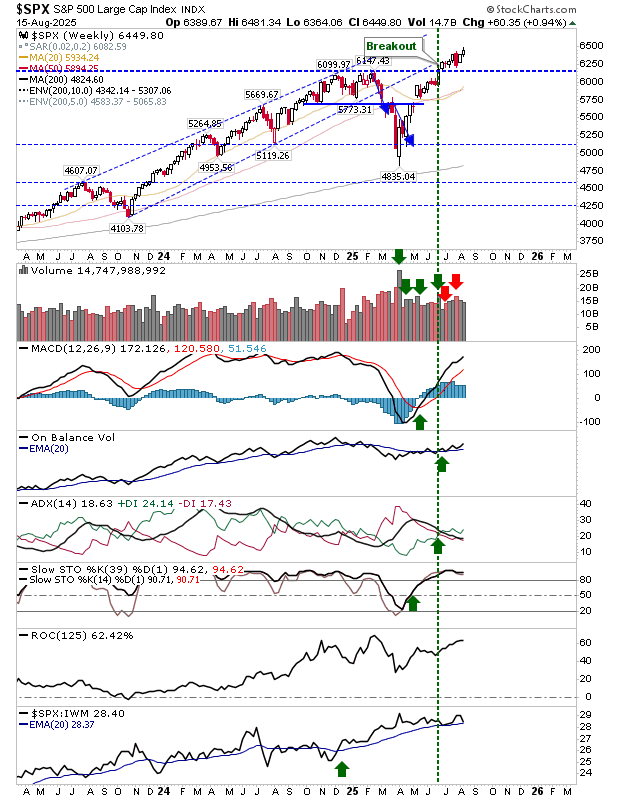
I would be expecting the Dow Industrial Average to follow the lead of the which has already cleared the early 2025 high after having broken out earlier this summer. Technicals for this index are net positive, including a relative outperformance to its peers.
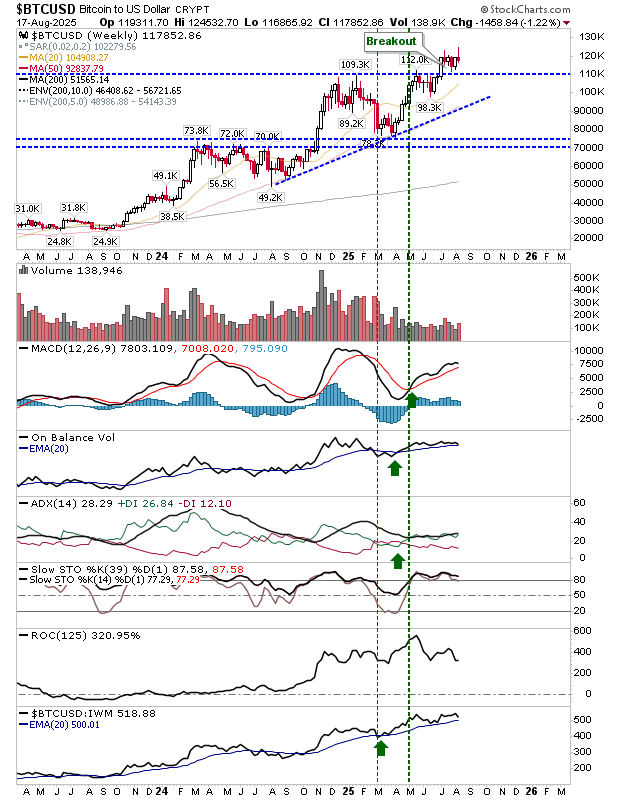
Bitcoin is pointing a little in the other direction. It managed a clear breakout on the weekly timeframe five weeks ago, but it has failed to push on and is now looking vulnerable to a reversal. Technicals are net positive, although trading volume has dropped off dramatically since the latter part of 2024.
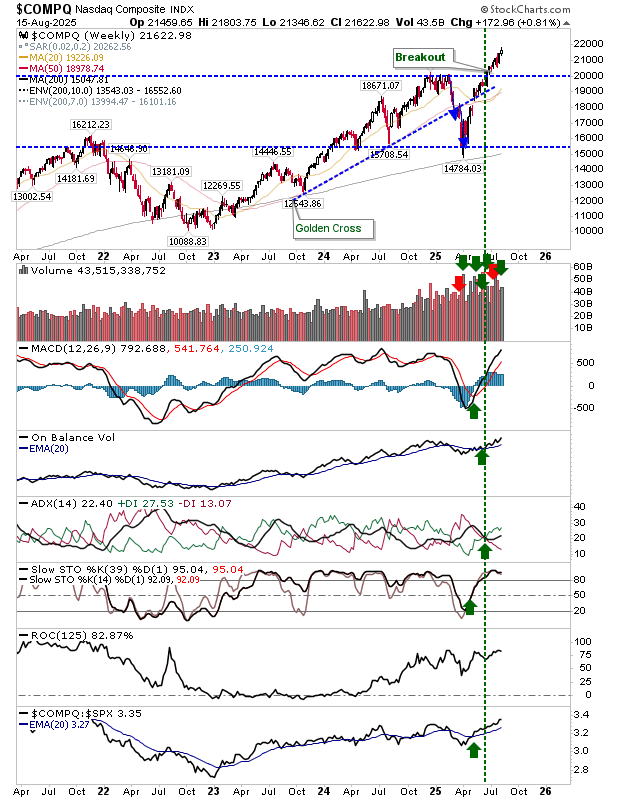
While Bitcoin has struggled a little on the weekly timeframe, the has been moving consistently higher on net bullish technicals. The index has also been outperforming peer indices on the weekly timeframe. I would be looking to Bitcoin to benefit from the gains in this index.
The remains the laggard on the weekly timeframe. However, it does now enjoy a net bullish technical picture.
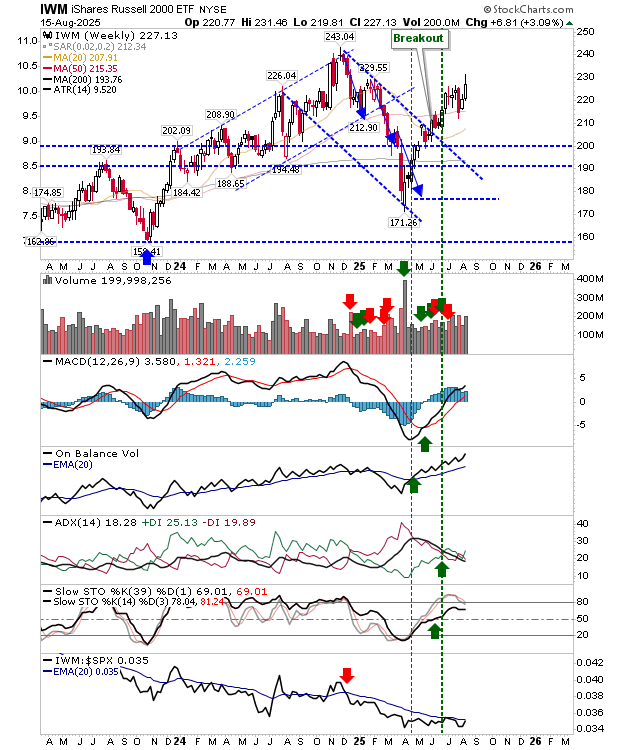
Finally, the managed to poke its head above breakout resistance, but finished the week below it. Second time lucky for this index?
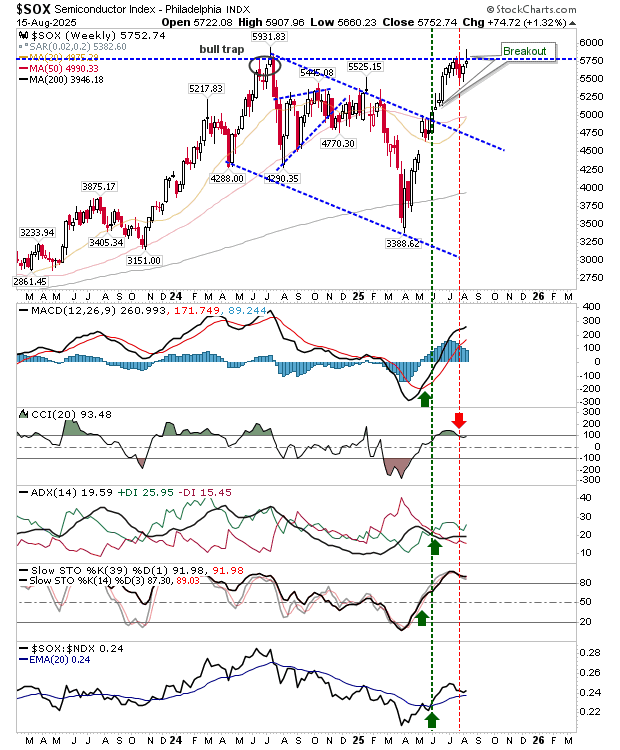
For this week, I would probably stick with the Dow Industrial Average. The Semiconductor Index might provide a solid alternative, and if it does, then Bitcoin could be the ancillary benefit.

