
Aug 26, 2025
IndexBox has just published a new report: U.S. – Clays – Market Analysis, Forecast, Size, Trends and Insights.
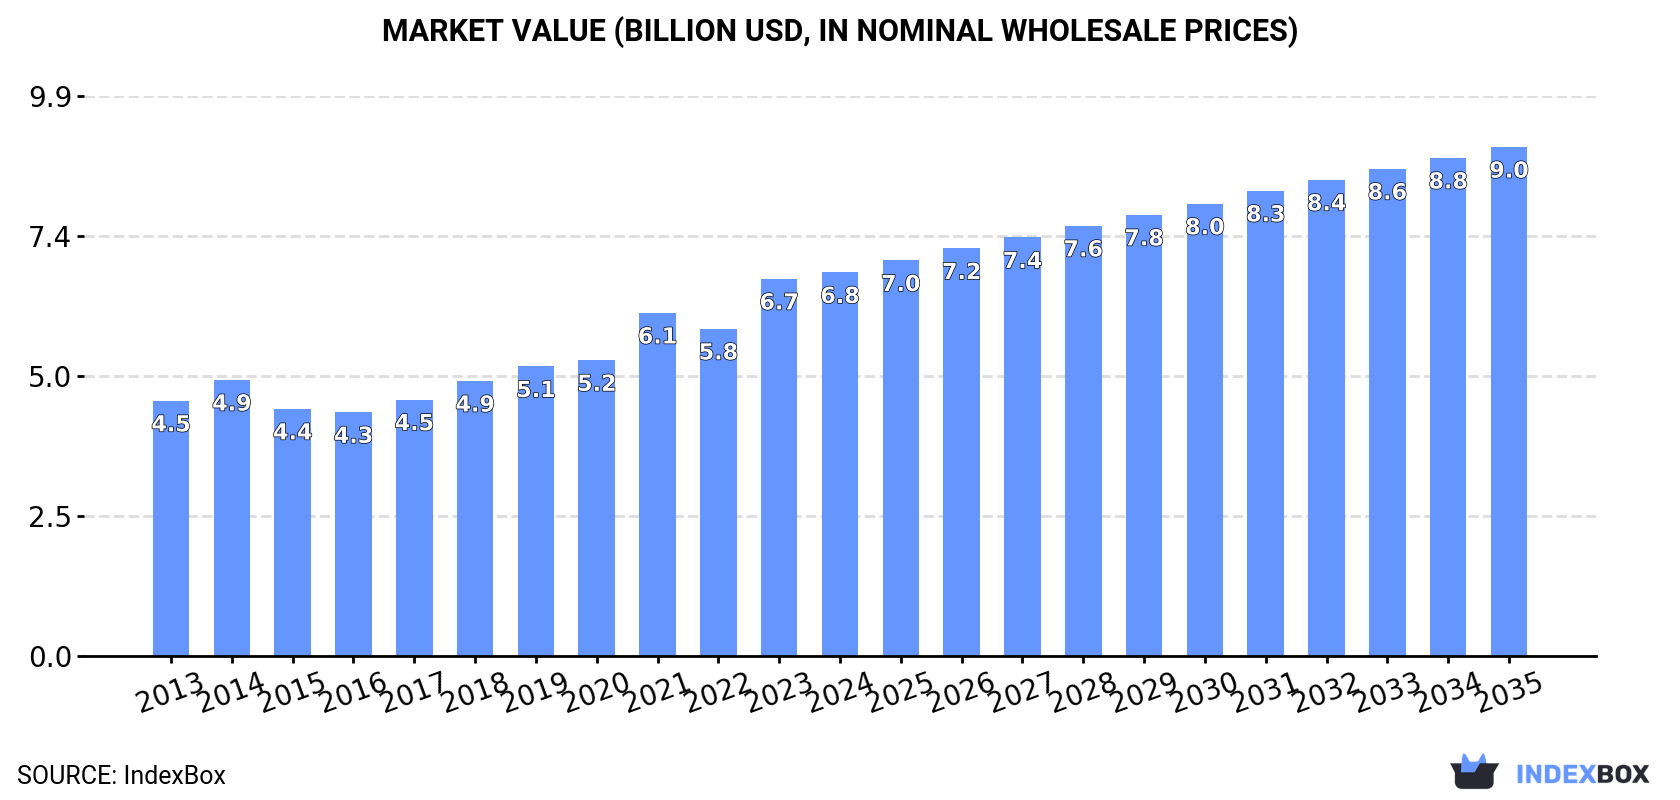
The clay market in the United States is anticipated to see a continuous upward trend in demand over the next decade, with a projected CAGR of +2.4% in volume and +2.6% in value from 2024 to 2035. This growth is expected to bring the market volume to 51M tons and the market value to $9B by the end of 2035.
Market Forecast
Driven by increasing demand for clays in the United States, the market is expected to continue an upward consumption trend over the next decade. Market performance is forecast to retain its current trend pattern, expanding with an anticipated CAGR of +2.4% for the period from 2024 to 2035, which is projected to bring the market volume to 51M tons by the end of 2035.
In value terms, the market is forecast to increase with an anticipated CAGR of +2.6% for the period from 2024 to 2035, which is projected to bring the market value to $9B (in nominal wholesale prices) by the end of 2035.
 ConsumptionUnited States’s Consumption of Clays
For the fourth year in a row, the United States recorded growth in consumption of clays, which increased by 4% to 40M tons in 2024. The total consumption volume increased at an average annual rate of +2.9% from 2013 to 2024; the trend pattern remained consistent, with only minor fluctuations being recorded in certain years. The most prominent rate of growth was recorded in 2023 with an increase of 5.9%. Over the period under review, consumption attained the peak volume in 2024 and is expected to retain growth in the immediate term.
The size of the clay market in the United States expanded to $6.8B in 2024, increasing by 1.7% against the previous year. This figure reflects the total revenues of producers and importers (excluding logistics costs, retail marketing costs, and retailers’ margins, which will be included in the final consumer price). In general, the total consumption indicated a notable expansion from 2013 to 2024: its value increased at an average annual rate of +3.8% over the last eleven years. The trend pattern, however, indicated some noticeable fluctuations being recorded throughout the analyzed period. Based on 2024 figures, consumption increased by +57.3% against 2016 indices. Over the period under review, the market attained the maximum level in 2024 and is expected to retain growth in the immediate term.
Consumption By Type
Clays for construction and industrial use (33M tons) constituted the product with the largest volume of consumption, comprising approx. 83% of total volume. Moreover, clays for construction and industrial use exceeded the figures recorded for the second-largest type, bentonite (3.9M tons), ninefold. Kaolin and kaolinic clays (2.4M tons) ranked third in terms of total consumption with a 6.1% share.
From 2013 to 2024, the average annual growth rate of the volume of clays for construction and industrial use consumption amounted to +4.0%. With regard to the other consumed products, the following average annual rates of growth were recorded: bentonite (+0.8% per year) and kaolin and kaolinic clays (-4.2% per year).
In value terms, clays for construction and industrial use ($5B) led the market, alone. The second position in the ranking was taken by bentonite ($899M). It was followed by kaolin and kaolinic clays.
From 2013 to 2024, the average annual rate of growth in terms of the value of clays for construction and industrial use market amounted to +5.0%. With regard to the other consumed products, the following average annual rates of growth were recorded: bentonite (+2.8% per year) and kaolin and kaolinic clays (-1.4% per year).
ProductionUnited States’s Production of Clays
For the fourth consecutive year, the United States recorded growth in production of clays, which increased by 3.8% to 43M tons in 2024. The total output volume increased at an average annual rate of +2.4% from 2013 to 2024; the trend pattern remained consistent, with only minor fluctuations being observed throughout the analyzed period. The most prominent rate of growth was recorded in 2023 with an increase of 4.1%. Clay production peaked in 2024 and is expected to retain growth in years to come.
In value terms, clay production rose markedly to $13.2B in 2024. In general, the total production indicated strong growth from 2013 to 2024: its value increased at an average annual rate of +5.6% over the last eleven years. The trend pattern, however, indicated some noticeable fluctuations being recorded throughout the analyzed period. Based on 2024 figures, production increased by +53.8% against 2014 indices. The pace of growth appeared the most rapid in 2014 with an increase of 18%. Clay production peaked in 2024 and is likely to see gradual growth in the near future.
Production By Type
Clays for construction and industrial use (34M tons) constituted the product with the largest volume of production, accounting for 79% of total volume. Moreover, clays for construction and industrial use exceeded the figures recorded for the second-largest type, bentonite (4.6M tons), sevenfold. Kaolin and kaolinic clays (4M tons) ranked third in terms of total production with a 9.4% share.
From 2013 to 2024, the average annual growth rate of the volume of clays for construction and industrial use production stood at +4.0%. With regard to the other produced products, the following average annual rates of growth were recorded: bentonite (+0.3% per year) and kaolin and kaolinic clays (-3.8% per year).
In value terms, clays for construction and industrial use ($10.7B) led the market, alone. The second position in the ranking was taken by kaolin and kaolinic clays ($1.3B). It was followed by bentonite.
From 2013 to 2024, the average annual growth rate of the value of clays for construction and industrial use production stood at +5.4%. With regard to the other produced products, the following average annual rates of growth were recorded: kaolin and kaolinic clays (-0.7% per year) and bentonite (+2.8% per year).
ImportsUnited States’s Imports of Clays
Clay imports into the United States skyrocketed to 252K tons in 2024, surging by 52% against the previous year’s figure. In general, imports, however, recorded a perceptible downturn. The pace of growth appeared the most rapid in 2015 with an increase of 54% against the previous year. As a result, imports reached the peak of 496K tons. From 2016 to 2024, the growth of imports remained at a lower figure.
In value terms, clay imports skyrocketed to $61M in 2024. Overall, imports, however, continue to indicate a noticeable curtailment. Imports peaked at $110M in 2014; however, from 2015 to 2024, imports stood at a somewhat lower figure.
Imports By Country
In 2024, Brazil (163K tons) constituted the largest clay supplier to the United States, with a 65% share of total imports. Moreover, clay imports from Brazil exceeded the figures recorded by the second-largest supplier, Canada (24K tons), sevenfold. Mexico (14K tons) ranked third in terms of total imports with a 5.6% share.
From 2013 to 2024, the average annual growth rate of volume from Brazil amounted to -4.1%. The remaining supplying countries recorded the following average annual rates of imports growth: Canada (+2.7% per year) and Mexico (+5.4% per year).
In value terms, Brazil ($20M) constituted the largest supplier of clays to the United States, comprising 33% of total imports. The second position in the ranking was held by Canada ($9.4M), with a 15% share of total imports. It was followed by Mexico, with a 7.6% share.
From 2013 to 2024, the average annual growth rate of value from Brazil stood at -8.5%. The remaining supplying countries recorded the following average annual rates of imports growth: Canada (+1.4% per year) and Mexico (-0.6% per year).
Imports By Type
In 2024, kaolin and kaolinic clays (174K tons) constituted the largest type of clays supplied to the United States, accounting for a 69% share of total imports. Moreover, kaolin and kaolinic clays exceeded the figures recorded for the second-largest type, bentonite (49K tons), fourfold. The third position in this ranking was held by clays for construction and industrial use (25K tons), with a 9.8% share.
From 2013 to 2024, the average annual growth rate of the volume of kaolin and kaolinic clays imports stood at -4.1%. With regard to the other supplied products, the following average annual rates of growth were recorded: bentonite (+10.6% per year) and clays for construction and industrial use (-3.0% per year).
In value terms, clays with the largest imports in the United States were kaolin and kaolinic clays ($26M), clays for construction and industrial use ($17M) and bentonite ($17M), with a combined 99% share of total imports.
Bentonite, with a CAGR of -0.0%, recorded the highest growth rate of the value of imports, in terms of the main product categories over the period under review, while purchases for the other products experienced a decline.
Import Prices By Type
The average clay import price stood at $242 per ton in 2024, reducing by -15.2% against the previous year. In general, the import price continues to indicate a perceptible slump. The most prominent rate of growth was recorded in 2016 when the average import price increased by 29% against the previous year. The import price peaked at $340 per ton in 2014; however, from 2015 to 2024, import prices remained at a lower figure.
There were significant differences in the average prices amongst the major supplied products. In 2024, the product with the highest price was clays for construction and industrial use ($682 per ton), while the price for kaolin and kaolinic clays ($151 per ton) was amongst the lowest.
From 2013 to 2024, the most notable rate of growth in terms of prices was attained by clays for construction and industrial use (+1.6%), while the prices for the other products experienced a decline.
Import Prices By Country
The average clay import price stood at $242 per ton in 2024, reducing by -15.2% against the previous year. Overall, the import price continues to indicate a perceptible reduction. The growth pace was the most rapid in 2016 when the average import price increased by 29%. The import price peaked at $340 per ton in 2014; however, from 2015 to 2024, import prices stood at a somewhat lower figure.
There were significant differences in the average prices amongst the major supplying countries. In 2024, amid the top importers, the country with the highest price was the UK ($885 per ton), while the price for Bulgaria ($120 per ton) was amongst the lowest.
From 2013 to 2024, the most notable rate of growth in terms of prices was attained by China (+2.5%), while the prices for the other major suppliers experienced mixed trend patterns.
ExportsUnited States’s Exports of Clays
In 2024, after two years of decline, there was growth in overseas shipments of clays, when their volume increased by 3.6% to 3.1M tons. In general, exports, however, recorded a noticeable setback. The most prominent rate of growth was recorded in 2021 with an increase of 18% against the previous year. The exports peaked at 4.2M tons in 2013; however, from 2014 to 2024, the exports failed to regain momentum.
In value terms, clay exports expanded notably to $994M in 2024. Over the period under review, exports saw a relatively flat trend pattern. The pace of growth was the most pronounced in 2021 when exports increased by 22% against the previous year. The exports peaked at $1.1B in 2022; however, from 2023 to 2024, the exports failed to regain momentum.
Exports By Country
Canada (729K tons), Mexico (514K tons) and China (354K tons) were the main destinations of clay exports from the United States, with a combined 51% share of total exports. Japan, India, South Korea, Taiwan (Chinese), Finland, Belgium, Germany and the Netherlands lagged somewhat behind, together accounting for a further 30%.
From 2013 to 2024, the most notable rate of growth in terms of shipments, amongst the main countries of destination, was attained by India (with a CAGR of +9.0%), while the other leaders experienced a decline.
In value terms, Canada ($132M), China ($112M) and Japan ($108M) constituted the largest markets for clay exported from the United States worldwide, together comprising 35% of total exports. Mexico, India, South Korea, Finland, Belgium, Taiwan (Chinese), Germany and the Netherlands lagged somewhat behind, together comprising a further 34%.
Among the main countries of destination, India, with a CAGR of +11.6%, saw the highest rates of growth with regard to the value of exports, over the period under review, while shipments for the other leaders experienced more modest paces of growth.
Exports By Type
Kaolin and kaolinic clays (1.7M tons) was the largest type of clays exported from the United States, with a 55% share of total exports. Moreover, kaolin and kaolinic clays exceeded the volume of the second product type, bentonite (749K tons), twofold. Clays for construction and industrial use (505K tons) ranked third in terms of total exports with a 16% share.
From 2013 to 2024, the average annual rate of growth in terms of the volume of kaolin and kaolinic clays exports totaled -3.4%. With regard to the other exported products, the following average annual rates of growth were recorded: bentonite (-1.6% per year) and clays for construction and industrial use (-0.2% per year).
In value terms, kaolin and kaolinic clays ($590M) remains the largest type of clays exported from the United States, comprising 59% of total exports. The second position in the ranking was held by bentonite ($193M), with a 19% share of total exports. It was followed by clays for construction and industrial use, with a 16% share.
From 2013 to 2024, the average annual growth rate of the value of kaolin and kaolinic clays exports was relatively modest. With regard to the other exported products, the following average annual rates of growth were recorded: bentonite (+1.8% per year) and clays for construction and industrial use (+1.2% per year).
Export Prices By Type
In 2024, the average clay export price amounted to $316 per ton, increasing by 4.8% against the previous year. Over the last eleven-year period, it increased at an average annual rate of +3.5%. The pace of growth appeared the most rapid in 2014 when the average export price increased by 16%. The export price peaked in 2024 and is expected to retain growth in the immediate term.
Average prices varied somewhat for the major types of exported product. In 2024, the products with the highest prices were fireclay ($340 per ton) and kaolin and kaolinic clays ($339 per ton), while the average price for exports of bentonite ($258 per ton) and clays for construction and industrial use ($319 per ton) were amongst the lowest.
From 2013 to 2024, the most notable rate of growth in terms of prices was recorded for the following types: fireclay (+7.5%), while the prices for the other products experienced more modest paces of growth.
Export Prices By Country
The average clay export price stood at $316 per ton in 2024, growing by 4.8% against the previous year. Over the period from 2013 to 2024, it increased at an average annual rate of +3.5%. The most prominent rate of growth was recorded in 2014 an increase of 16%. The export price peaked in 2024 and is expected to retain growth in years to come.
Prices varied noticeably by country of destination: amid the top suppliers, the country with the highest price was South Korea ($447 per ton), while the average price for exports to Canada ($181 per ton) was amongst the lowest.
From 2013 to 2024, the most notable rate of growth in terms of prices was recorded for supplies to Japan (+5.1%), while the prices for the other major destinations experienced more modest paces of growth.