
Principle of a PL-SBS microscope
The SBS microscope is based on the SBS between two focused counterpropagating laser beams, that is, pump (ω1) and probe (ω2) beams, mediated by the excited acoustic phonons at the focal spot in the sample. When the differential frequency ω1 – ω2 matches the characteristic acoustic resonance at ΩB, the pump energy is transferred to the probe beam, with the energy-transferring rate manifested as the power increment in the probe beam ΔP2 = G(Ω)P2, where G(Ω) is the SBG. For perfectly overlapped beams, the SBG spectrum is expressed as G(Ω) = g(Ω)lP1A−1, where g(Ω) is the Brillouin gain factor of the Lorentzian line shape centring at ΩB with full-width at half-maximum linewidth of ΓB, l is the interaction length between the two counterpropagating beams within the sample volume, P1 is the pump power and A is the waist area at the focal spot. The Brillouin shift and linewidth are related with the complex longitudinal modulus of the material as \(M={M}^{{\prime} }+{M}^{{\prime} {\prime} }=\frac{\rho }{{n}^{2}}\frac{{\uppi }^{2}{c}_{0}^{2}}{{\omega }_{1}^{2}}{\varOmega }_{{\rm{B}}}^{2}(1+{\rm{i}}\frac{{\varGamma }_{{\rm{B}}}}{{\varOmega }_{{\rm{B}}}})\), where M′ and M″ are the storage and loss moduli accounting for the elastic and viscous properties of the sample, respectively; ρ, n and c0 are the mass density, refractive index and speed of light in a vacuum, respectively.
The signal amplitude S in SBS imaging is determined by the time-averaged incremental power in the probe beam given by \(\left\langle \Delta {P}_{2}\right\rangle ={T}^{-1}{\int }_{0}^{T}\Delta {P}_{2}{{\rm{d}}t}\), with T being the sampling time; hence, we have \(S\propto {T}^{-1}{\int }_{\!0}^{T}{P}_{1}{P}_{2}{{\rm{d}}t}\). For pulsed pump and probe beams with a duty cycle of κ and fixed mean power of \({\bar{P}}_{1}\) and \({\bar{P}}_{2}\), respectively, the signal amplitude is then expressed as \(S\propto {T}^{-1}{\int }_{\!0}^{\kappa T}\frac{{\bar{P}}_{1}{\bar{P}}_{2}}{{\kappa }^{2}}{{\rm{d}}t}={\kappa }^{-1}{\bar{P}}_{1}{\bar{P}}_{2}\), from which it is apparent that by reducing the duty cycle of the pulsed laser, the SBG signal can be inverse proportionally improved with an enhancement factor of κ–1.
Pulsed laser system
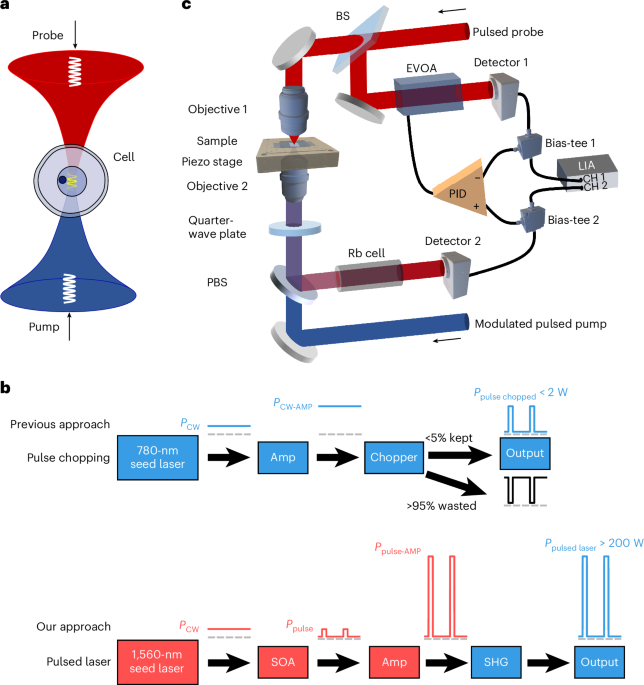
The dual-wavelength pulsed laser system for the generation of single-frequency pulsed pump and probe beams is based on MOPA for 1,560-nm optical pulses and subsequent SHG (Supplementary Fig. 1). The pump and probe beams have generally the same configuration in MOPA and SHG subsystems; hence, we just take the pump beam as an illustration here.
The MOPA unit is constructed with polarization-maintaining fibre-optic components. It is designed to amplify the single-frequency seed with nanosecond pulse width from milliwatts to hundreds of watts. To achieve a gain up to 50 dB and suppressing the amplified spontaneous emission (ASE) noise, a two-stage amplification scheme is used, with each stage providing a maximum gain of over 25 dB. The CW single-frequency seed at 1,560.48 nm is an external cavity diode laser with a power of 15 mW and linewidth of 10 kHz. The CW pump seed is first split into two beams by a 50:50 fibre coupler, with one beam beating with the probe seed for the heterodyne detection of the differential frequency by a fast photodetector (1544-B, Newport) and a frequency counter (53230A, Keysight) to get the exact frequency shift of the SBS. The other beam of the pump seed is chopped into pulses by a semiconductor optical amplifier (SOA; IPSAD1514-6210, Inphenix) mounted on a pulsed SOA driver. The seed pulse has an extinction ratio of approximately 50 dB. Optical pulses with an adjustable pulse width from 2 to 12 ns are generated by the SOA with both repetition rate fr and phase of the pulses determined by the external triggering signal from an electrical pulse generator (DG922 Pro, Rigol). After passing the optical isolator, the pulsed seed is first preamplified by a piece of erbium-doped fibre (PM-ESF-7/125, Coherent) with a length of 2.5 m and backward pumped by a single-mode 976-nm laser diode (976LD-1-0-0, Aerodiode). A band-pass filter centred at 1,560.6 nm with a spectral bandwidth of 0.5 nm is used to filter out the ASE noise. Then, the pulsed laser is boost-amplified by a Yb/Er co-doped double-cladding fibre (PM-EYDF-10/125-XPH, Coherent), which is backward pumped47 at 940 nm. The 940-nm pump is from two identical multimode laser diodes (940LD-2-0-0, Aerodiode), with each offering a pumping power up to 10 W and coupled into the cladding of the gain fibre through a 2 + 1 × 1 combiner (PMPSC-21-F-15, DK Photonics). The remaining of the backward pump beam is filtered out by a cladding power stripper spliced before the double-cladding gain fibre. For the typical pulse rate of 1 MHz and width of 6 ns, we achieved an average 1,560-nm output of 3.3 W at a pumping power of 13.6 W, corresponding to a peak power of 560 W for the 1,560-nm pulse. The slope and mean optical-to-optical efficiencies for the boost-amplifying stage are 25% and 24%, respectively (Supplementary Fig. 2a). After the combiner, another cladding power stripper is spliced to remove both back-scattered 940-nm pump and ASE noise. An optical isolator is spliced to cut-off any possible back-reflection into the MOPA unit. Before collimating out the 1,560-nm pulsed laser, a section of the coreless fibre is spliced with an angled terminal, which works as an end cap to moderately expand the beam size and hence avoid surface damage. An aspheric lens (#29-988, Edmund) is used to collimate the 1,560-nm pulses generated in the MOPA unit. To suppress the nonlinear effects in the silica fibre during the two-stage amplification, such as SBS and modulation instability, which limit the output power and increase the pulse train noise, the length of the fibre components are kept as short as possible. Compared with the additional seed laser for the probe beam as implemented here, the probe seed may alternatively be frequency shifted from the pump seed using an electro-optic modulator driven by a frequency-tunable microwave source, in which scheme the frequency counter may then be unnecessary.
The 1,560-nm pulsed laser is then frequency doubled in the SHG unit by using a periodically poled lithium niobate crystal. A dichroic mirror (DMLP1180, Thorlabs) is used first to filter out the core-guided 940-nm pump and Yb ASE light. We use a half-wave plate and a polarization beamsplitter (PBS) for power control as well as s-polarization filtering to comply with the quasi-phase-matching condition of the periodically poled lithium niobate48. A plano-convex lens is used to couple the 1,560-nm beam into the periodically poled lithium niobate crystal (40-mm long for 1,560 nm, Covesion). The crystal is mounted in an oven with a stabilized temperature of around 90 °C, at which optimal quasi-phase matching is achieved. Both fundamental and frequency-doubled beams are collimated by another lens and then separated from each other with a dichroic mirror. The diameter of the output 780-nm beam is measured to be ~1.2 mm. For the typical 1-MHz pulse rate and 6-ns pulse width, we achieved a maximum average power of 1.6 W from the SHG unit, corresponding to a peak power of 267 W with a conversion efficiency of 59% (Supplementary Fig. 2b). For the pulsed pump beam, a volume Bragg grating (SPC-780, OptiGrate) with a spectral bandwidth less than 50 pm is used to filter out the frequency-doubled ASE noise centring at 780 nm. Both power and polarization stability of our pulsed laser system are measured at the 780-nm output. For the 1-MHz rate, 6-ns width and 0.73-W average output power, the peak-to-peak and r.m.s. power fluctuations are measured to be 9.1% and 1.5%, respectively, over a 5-h monitoring. Polarization extinction ratio over 24 dB is also achieved (Supplementary Fig. 2d). Frequency stability of the laser system is demonstrated by monitoring the beating frequency between the pump and probe seed lasers over 1 h, which shows a peak-to-peak and r.m.s. differential frequency fluctuation within 0.93 MHz and 0.13 MHz, respectively, at 780 nm (Supplementary Fig. 2e). The output spectra of the seed laser, first- and second-stage fibre amplification and the SHG are measured by an optical spectrum analyser (AQ6374, Yokogawa; Supplementary Fig. 2f,g). The ASE floor is measured to be about 65 dB below the main output at 780 nm.
Pulse picking by acousto-optic modulators (AOMs; AOMO 3200-124, G&H) is adopted to reduce the intensity noise for both pump and probe beams. A pulse train with a lower repetition rate tends to generate higher ASE, due to longer time span under continuous pumping without a seed signal to be amplified. Compared with the direct generation of pulses of 500-kHz repetition rate or lower, the scheme of the first generation of 1-MHz repetition rate and subsequently picking one pulse out of every two pulses or more, that is, pulse rate down to 500 kHz or lower, results in reduced intensity noise ranging from 3 dB to 1 dB for pulse width ranging from 11 ns to 2 ns (Supplementary Fig. 2h). The 200-ns electrical picking pulses driving the AOM are synchronized with the triggering pulses for SOAs. Aspheric lens pair (#18-080, Edmund) is used to couple the beams into and out of the AOM. For the pump beam, its AOM also performs intensity modulation, with the modulation frequency fm determined by a lock-in amplifier (LIA; MFLI-5MHz, Zurich Instruments). Both pump and probe beams are coupled into a PM780 optical fibre using an aspheric lens (PAF2A-5B, Thorlabs). The pump beam is then directly sent to the microscope, whereas the probe beam is first divided into two beams by a 50:50 fibre coupler, with one beam to interact with the pump light in the microscope and the other beam serving as the reference for auto-balanced detection.
PL-SBS microscope and detection system
The detailed setup of the PL-SBS microscope and auto-balanced detection is shown in Supplementary Fig. 3. For the microscope, both pump and probe beams are collimated using an aspheric lens (#49-115, Edmund) with an output beam diameter of 5.9 mm. A quarter-wave plate is used to convert the linearly polarized probe beam into a right circularly polarized beam. L1 lens pair (#49-356, Edmund) is immaterial to both pump and probe beams, but necessary for realizing Kohler illumination in bright-field imaging, in which the surface of the Ø1-mm multimode fibre coupling a light-emitting diode (M530L4, Thorlabs) is conjugated to the back-focal plane of the upper objective (Objective 1) for uniform illumination on the sample. The pump beam is p polarized by the half-wave plate and transmits through the PBS subsequently. Quarter-wave plate 2 then transforms the pump beam into a left circularly polarized beam. The opposite circularly polarized probe and pump beams are focused into the same spot in the sample by the two opposed objectives (LUCPLFLN60X, Olympus) with an NA of 0.7. The back apertures of both the objectives are overfilled by the Ø5.9-mm laser beams for full utilization of the NA. In PL-SBS imaging, the focal point is fixed, whereas the sample is zigzag scanned by a three-axis piezo stage (L3S-D10300-XYZ300, nanoFaktur). After experiencing the SBG during the phonon-mediated interaction with the pump beam, the probe beam is re-collimated by the lower objective (Objective 2), then turns into s polarization after quarter-wave plate 2 and is finally reflected by the PBS for subsequent detection and demodulation. When flip mirrors FM1 and FM2 are flipped down, bright-field imaging is activated, where the sample is imaged onto camera C1 (BFLY-U3-23S6M-C, FLIR) by tube lens L2 (TTL165-A, Thorlabs) with a focal length of 165 mm. To perform wide-field fluorescence imaging targeting PI, excitation (MF525-39, Thorlabs) and emission (MF620-52, Thorlabs) filters are inserted after the light-emitting diode and before the camera, respectively.
The auto-balanced detection unit is to suppress the common-mode intensity noise within the pulsed probe beam. It has one port (that is, signal port) from the output of the PL-SBS microscope and the other port (that is, reference port) directly from one beam of fibre-coupler-split probe source. The amplified probe beam from the signal port triple passes the custom-made rubidium-85 gas cell (Ø25 × 150 mm), which is heated to a temperature of 95 °C, to filter out the back-scattered and/or reflected pump beam. The optical signal is detected by reverse-biased photodiodes (FDS1010, Thorlabs) with the photoelectric current separated into d.c. and radio-frequency parts by the bias-tee (ZFBT-4R2GW+, Mini-Circuits). The d.c. parts of the signal and reference are sent to the two differential ports of the proportional–integral–derivative controller (LB1005-S, Newport), the output of which is to drive the 780HP fibre pigtailed electronic variable optical attenuator (V800, Thorlabs), so that the optical power in the reference beam is kept at the same level of the signal beam, even if the signal beam experiences substantial power change due to non-uniform transparency in the scanned sample. The radio-frequency components are first low-pass filtered to cut-off the carriers at fr as well as its high harmonics, with only the first-order signal at fm passing through the low-pass filters and entering the LIA. The LIA works in the differential-input mode, so that the common-mode intensity noise in the probe beam is substantially suppressed, providing a matched optical path for the signal and reference beam. For PL-SBS imaging with a 200-μs pixel time and a 500-kHz pulse repetition rate, the noise equivalent power (NEP) bandwidth of the LIA is set to 40 kHz, and the optimal modulation frequency is determined to be 190 kHz, where the auto-balanced detection achieves intensity noise reduction as large as 31.3 dB (Supplementary Fig. 2i). In SBS imaging, the frequency of the probe beam is sawtooth scanned, generally spanning 2 GHz and completed within the pixel time. The demodulated SBG signal from the LIA, along with the d.c. level of the probe beam, which is proportional to the mean probe power on the photodetector, and the instantaneous voltage driving the frequency scanning are collected by a data acquisition card (USB-6343, National Instruments) for construction of the SBG spectra.
Hardware control, including the piezo stage moving, frequency scanning, data acquisition and interdevice synchronization, is executed by a custom-built LabVIEW 2022 Q3 program. The spectral data processing is based on a custom program implemented in Python 3.9 with the details given in Supplementary Note 2.
Performance characterization and imaging acquisitionMeasurement of spatial resolution
The spatial resolution characterization of the PL-SBS microscope includes determination of both lateral (that is, x and y) and axial (that is, z) resolutions. The lateral resolution is quantified by the SBS imaging of polydimethylsiloxane (PDMS) bead in 1% (w/v) agarose with the focal spot on the same plane as the bead centre (Supplementary Fig. 4a). The Brillouin shift of the agarose gel and PDMS are measured to be 5.03 GHz and 4.2 GHz, respectively (Supplementary Fig. 4c). By fitting the measured spectra at a fixed Brillouin shift of the agarose gel, the signal amplitude has its distribution shown in Supplementary Fig. 4b. Then, the signal amplitudes of agarose gel across the bead boundary are fitted with an error function along both x and y axes, giving a lateral spatial resolution of 0.49 µm (Supplementary Fig. 4d,e,i). The axial resolution is quantified by SBS imaging of the interface between double-distilled water and coverslip (Supplementary Fig. 4f). The Brillouin shift of double-distilled water is at 4.98 GHz as experimentally measured whereas that of the borosilicate coverslip is over 10 GHz higher and far away from the frequency-scanning range we set. As shown in Supplementary Fig. 4g, the SBS amplitude of water when the focal spot is scanned in the x–z plane cross through the water–glass boundary. By fitting the signal amplitude in the z direction with an error function, the axial resolution is measured to be 2.1 µm (Supplementary Fig. 4h,i). A high spatial resolution is on condition of matched overlap between the pump and probe at the same focal spot in the sample, the optimization of which is described in Supplementary Note 1.
Determination of spectral precision and spectral resolution
The characterization of spectral precision and spectral resolution are based on the SBS measurement of double-distilled water at room temperature with objectives of 0.7 NA. The SBS spectral precision includes the shift and linewidth precisions, which are quantified as the standard deviation of the Brillouin shift and linewidth, respectively, extracted from the Lorentzian fitting of n = 300 consecutively acquired SBS spectra with frequency ranging from 4 GHz to 6 GHz.
The spectral precision with different integration times (that is, pixel time) is measured with a pulse rate of 500 kHz and a pulse width of 6 ns (Fig. 2a). The total average power on the sample is 30 mW, with pump and probe powers of 25 mW and 5 mW, respectively. The time–bandwidth product of 8 kHz ms is maintained for all the measurements, that is, the NEP bandwidth of the LIA is set to 40 kHz for 200-μs pixel time and 8 kHz for 1 ms. Note that the NEP of 40 kHz for 200-μs pixel time corresponds to a time constant of 3.1 μs of the LIA. A slope of roughly −0.5 for precision versus pixel time in both Brillouin shift and linewidth indicates the domination of white noise in our system for the pixel time we set. Shift and linewidth precision of 7.7 MHz and 29 MHz, respectively, is achieved for pixel time down to 200 μs (Fig. 2a,e,f) with a measured full-width at half-maximum linewidth of 0.44 GHz in water (Fig. 2d). A narrower pulse width typically increases the signal amplitude due to a higher enhancement factor, resulting in improved signal-to-noise ratio (Supplementary Fig. 2j) and precision (Fig. 2c). However, the reduced pulse width is associated with a larger laser linewidth, which causes the measured Brillouin spectra, as a convolution between the laser and the intrinsic Brillouin line shapes, to broaden (Fig. 2c). The deterioration in precision for pulse widths less than 3.5 ns is attributed to the increased laser noise (Supplementary Fig. 2h), exceeding the noise cancellation capability of our auto-balanced detector. Choosing a 6-ns pulse width for performance characterization as well as SBS imaging results from the higher spectral precision compared with the longer pulse width (due to the higher enhancement factor) and moderate linewidth broadening compared with the shorter ones. Precision under different pump powers is measured with a fixed probe power of 5 mW and pixel time of 200 μs. The spectral precision scales down with the pump power, as indicated by a fitting slope of approximately −1 (Fig. 2b). Compared with the 308-MHz intrinsic SBS linewidth of water29, the measured linewidth of 440 MHz demonstrates a spectral resolution of 132 MHz for our system, which includes NA broadening.
Pulsed laser BGM
The pulsed laser BGM is performed with a phantom sample of layered oil–agarose gel (Supplementary Fig. 5a), whose Brillouin shifts are of 3.91 GHz and 5.03 GHz, respectively (Supplementary Fig. 5e). By keeping the differential frequency between the pump and probe beams at the peak of either oil or agarose gel, the Brillouin gain across the interface is mapped with a pixel time of 5 μs and an NEP bandwidth of 40 kHz (Supplementary Fig. 5b,c). The gain profiles along the axial direction are given in Supplementary Fig. 5d.
Sample preparation and imaging parametersChemical samples
The water sample is prepared by sandwiching 20-μl double-distilled water between two #1.5 coverslips, which are separated by two imaging spacers (Grace Bio-Labs SecureSeal) with a thickness of 240 µm. To prepare the sample of PDMS beads in agarose gel, 5 μl of 1% w/v low-melting-point agarose water solution is first dropped on the surface of a #1.5 coverslip, on which a 120-µm-thick spacer is attached beforehand. After gelation of the agarose solution, PDMS beads with a mean diameter of 10 µm are deposited on the gel surface, followed by the immediate addition of 7-μl agarose solution. Then, the sample is sealed by covering another #1.5 coverslip. The oil–agarose gel sample is made by first dropping 5-μl low-melting-point agarose solution on the surface of a #1.5 coverslip adhered with a 120-µm-thick spacer. Refractive-index oil (Cargille Labs, nD of 1.414) of 5 μl is then added on top of the agarose gel and the sample is finally sealed with another #1.5 coverslip.
Cells (including viability test parameter)
Cell lines were purchased from Cobioer and were maintained according to the guidance from American Type Culture Collection. U-2 OS (CBP60238), human cervical carcinoma cell line HeLa (CBP60232) and mouse fibroblasts NIH/3T3 (CBP60317) were cultured in Dulbecco’s modified Eagle’s medium (Gibco, 11960044) supplemented with 10% (v/v) foetal bovine serum (Gibco, 30044333) and 100 U ml–1 penicillin–streptomycin (Gibco, 15140122). Cells were seeded on polyacrylamide-gel-coated dishes (Matrigen, SV3510-EC-12) at a density of 5,000 cells cm–2 and allowed to adhere overnight before imaging.
MOLM-13 (CBP60678) was cultured in RPMI-1640 (Gibco, 1049101) supplemented with 10% (v/v) foetal bovine serum and 100 U ml–1 penicillin–streptomycin. Dishes (MatTek, P35G-1.5-14-C) were coated with 0.1 mg ml–1 poly-d-lysine (Gibco, A3890401) for 1 h at 37 °C before seeding the cells at a density of 5,000 cells cm–2. The cells were allowed to adhere for 1 h at 37 °C before imaging. Cells have been authenticated by short tandem repeat analysis and mycoplasma detection.
To test the cell viability after Brillouin imaging with the PL-SBS microscope, we added PI (Sigma-Aldrich, P4170-10MG) dye in the cell dishes with a volume ratio to the cell medium of 15 µl in 1 ml.
Lung cancer organoids
Malignant pleural effusion samples were obtained from lung cancer patients by thoracentesis at Shanghai Ninth People’s Hospital. The research protocol was approved by the Ethics Committee of Shanghai Ninth People’s Hospital affiliated with the Shanghai Jiao Tong University. Informed consent was obtained from patients before sample collection. Malignant serous effusions were collected aseptically in heparinized sterile bottles, and centrifuged at 300g for 5 min at 4 °C. Pellets were resuspended in lung cancer organoid medium (Dulbecco’s modified Eagle’s medium/F12 (Gibco, 12634-010) supplemented with 1X GlutaMAX (Gibco, 35050061), 10 mM of HEPES (Gibco, 15630080), 20 ng ml–1 of bFGF (Peprotech, 100-18B), 50 ng ml–1 of human EGF (Peprotech, AF-100-15), 1X N2 (Gibco, 17502048), 1X B27 (Gibco, 17504044), 10 μM of Y-27632 (MCE, HY-10071), 5 mM of nicotinamide (MCE, HY-B0150), 1 mM of N-acetyl-l-cysteine (Sigma, A9165), 3 μM of SB202190 (MCE, HY-10295), 5 μM of A 83-01 (MCE, HY-10432), 10 μM of forskolin (Selleck, S2449), 3 nM of dexamethasone (Selleck, S1322) and 1% of penicillin–streptomycin (Gibco, 15140122)).
Then, 50 μl of the suspension was mixed with 100 μl of Matrigel (Corning, 356231) and seeded on prewarmed six-well culture plates (Thermo Scientific, 140675) at 37 °C for 30 min. The plates were inverted to solidify at 37 °C for 30 min followed by the addition of 3 ml of medium per well. The lung cancer organoid medium was replaced every 3–4 days.
For passaging, lung cancer organoids were harvested using cold Dulbecco’s phosphate-buffered saline and incubated with TrypLE Express (Gibco, 12604021) for 10 min at 37 °C for dissociation. The dissociated organoids were resuspended in the lung cancer organoid medium with Matrigel (1:2 ratio) and reseeded on a glass-bottomed dish (MatTek, P35G-1.5-14-C).
Zebrafish
Zebrafish ovarian follicle preparation
Fish maintenance and embryo collection were carried out as described in ref. 49. Here 5–24-month-old females from WT AB strains were used, fish were bred in the zebrafish facility at LSI Zhejiang University according to local regulations. All procedures were approved by the Ethics Committee of Zhejiang University regulating animal care and usage.
Zebrafish ovarian follicle isolation was performed following previously described protocols50,51. Female zebrafish were anaesthetized in 0.02% tricaine and euthanized by decapitation. Ovaries were harvested in a culture medium consisting of 70% Leibovitz’s L-15 medium with l-glutamine, pH 8.0 (Gibco), supplemented with 50 U ml–1 of penicillin–streptomycin and 0.5% of bovine serum albumin (Sigma-Aldrich). Stage I follicles (60–100 µm in diameter) were isolated from the ovaries through gentle pipetting with a glass Pasteur pipette, followed by dissection using forceps under an Olympus SZX16 stereomicroscope. The isolated follicles were then mounted in 0.6% low-melting-point agarose (Sangon Biotech).
Zebrafish larva preparation
Transgenic zebrafish larvae were in the casper background. The fish was mounted at 3 dpf in the centre of a Petri dish (MatTek, P35G-1.5-14-C) with 1% (w/v) low-melting-point agarose and 0.016% (w/v) tricaine (for immobilization purpose). A coverslip was used to cover the agarose before solidifying to allow the access of the sample by two objectives.
C. elegans
C. elegans adults of the wild-type N2 Bristol strain were centrifugally rinsed three times with M9 solution. M9 agarose was made by mixing low-melting-point agarose and levamisole in M9 solution. Then, 8 μl of M9 agarose was added on a coverslip, to which two imaging spacers (with a total thickness of 240 µm) were stacked together and stuck. The worms were transferred on the agarose pad using a sterilized platinum wire. Then, another 17 μl of low-melting-point M9 agarose was added in the imaging spacer, with a second coverslip placed on top. The early embryos were selected for Brillouin imaging in the far end of the worm’s valve.