

Aug 27, 2025
IndexBox has just published a new report: U.S. – Safes, Strongboxes And Doors Of Base Metal – Market Analysis, Forecast, Size, Trends And Insights.
The United States market for safes and strongboxes is predicted to see a steady rise in demand, with a forecasted CAGR of +2.4% in volume and +2.7% in value from 2024 to 2035. This growth is expected to drive the market’s performance and bring significant opportunities for growth and investment in the industry.
Market Forecast
Driven by rising demand for safes and strongboxes in the United States, the market is expected to start an upward consumption trend over the next decade. The performance of the market is forecast to increase slightly, with an anticipated CAGR of +2.4% for the period from 2024 to 2035, which is projected to bring the market volume to 202K tons by the end of 2035.
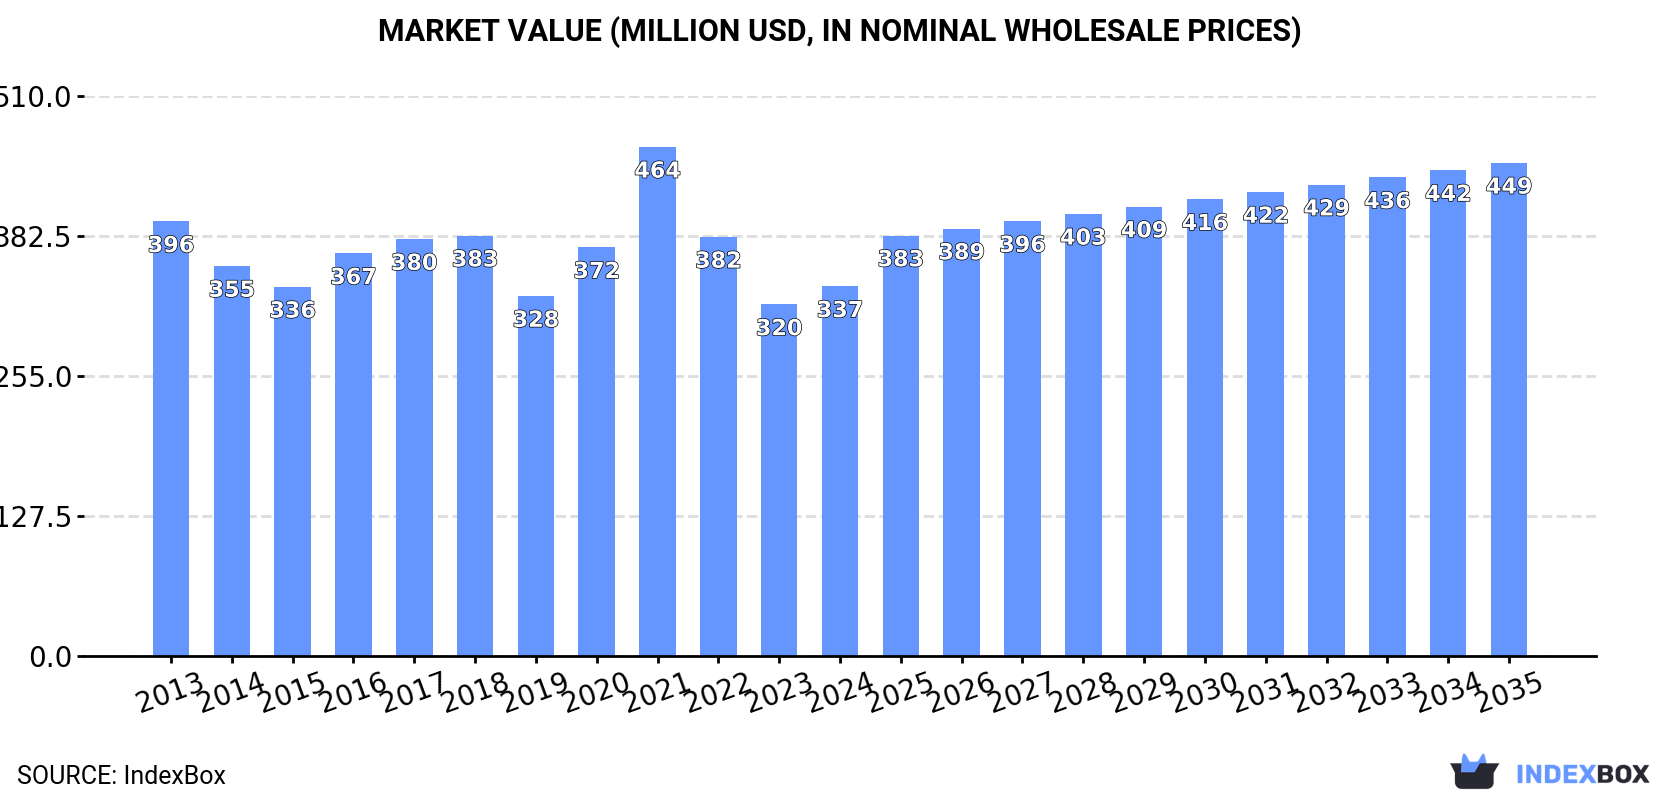
In value terms, the market is forecast to increase with an anticipated CAGR of +2.7% for the period from 2024 to 2035, which is projected to bring the market value to $449M (in nominal wholesale prices) by the end of 2035.
 ConsumptionUnited States’s Consumption of Safes, Strongboxes And Doors Of Base Metal
In 2024, consumption of safes, strongboxes and doors of base metal was finally on the rise to reach 156K tons for the first time since 2021, thus ending a two-year declining trend. Over the period under review, consumption, however, recorded a relatively flat trend pattern. Over the period under review, consumption reached the peak volume at 221K tons in 2021; however, from 2022 to 2024, consumption failed to regain momentum.
The revenue of the safes and strongboxes market in the United States totaled $337M in 2024, rising by 5.1% against the previous year. This figure reflects the total revenues of producers and importers (excluding logistics costs, retail marketing costs, and retailers’ margins, which will be included in the final consumer price). In general, consumption, however, showed a slight decline. As a result, consumption attained the peak level of $464M. From 2022 to 2024, the growth of the market remained at a lower figure.
ProductionUnited States’s Production of Safes, Strongboxes And Doors Of Base Metal
In 2023, production of safes, strongboxes and doors of base metal increased by 0% to 12K tons, rising for the seventh year in a row after two years of decline. Overall, production saw a drastic downturn. The growth pace was the most rapid in 2015 with a decrease of -83.5% against the previous year. Safes and strongboxes production peaked at 31K tons in 2014; however, from 2015 to 2023, production remained at a lower figure.
In value terms, safes and strongboxes production amounted to $90M in 2023. In general, production continues to indicate a deep setback. The pace of growth was the most pronounced in 2015 when the production volume decreased by -83.4%. Over the period under review, production reached the maximum level at $200M in 2014; however, from 2015 to 2023, production remained at a lower figure.
ImportsUnited States’s Imports of Safes, Strongboxes And Doors Of Base Metal
In 2024, overseas purchases of safes, strongboxes and doors of base metal increased by 16% to 160K tons for the first time since 2021, thus ending a two-year declining trend. Overall, imports, however, continue to indicate a slight setback. The growth pace was the most rapid in 2020 with an increase of 27% against the previous year. Over the period under review, imports attained the peak figure at 227K tons in 2021; however, from 2022 to 2024, imports failed to regain momentum.
In value terms, safes and strongboxes imports rose notably to $344M in 2024. In general, imports, however, continue to indicate a slight curtailment. The most prominent rate of growth was recorded in 2021 with an increase of 26% against the previous year. As a result, imports attained the peak of $473M. From 2022 to 2024, the growth of imports remained at a somewhat lower figure.
Imports By Country
In 2024, China (105K tons) constituted the largest safes and strongboxes supplier to the United States, with a 66% share of total imports. Moreover, safes and strongboxes imports from China exceeded the figures recorded by the second-largest supplier, Mexico (27K tons), fourfold.
From 2013 to 2024, the average annual growth rate of volume from China totaled -2.3%. The remaining supplying countries recorded the following average annual rates of imports growth: Mexico (-2.7% per year) and Vietnam (+52.6% per year).
In value terms, China ($212M) constituted the largest supplier of safes, strongboxes and doors of base metal to the United States, comprising 62% of total imports. The second position in the ranking was taken by Mexico ($61M), with an 18% share of total imports.
From 2013 to 2024, the average annual rate of growth in terms of value from China totaled -3.7%. The remaining supplying countries recorded the following average annual rates of imports growth: Mexico (-1.3% per year) and Vietnam (+53.9% per year).
Import Prices By Country
In 2024, the average safes and strongboxes import price amounted to $2,146 per ton, reducing by -2.8% against the previous year. In general, the import price showed a relatively flat trend pattern. The pace of growth was the most pronounced in 2022 an increase of 16% against the previous year. Over the period under review, average import prices reached the maximum at $2,460 per ton in 2014; however, from 2015 to 2024, import prices stood at a somewhat lower figure.
Average prices varied somewhat amongst the major supplying countries. In 2024, amid the top importers, the country with the highest price was Mexico ($2,265 per ton), while the price for Vietnam ($1,646 per ton) was amongst the lowest.
From 2013 to 2024, the most notable rate of growth in terms of prices was attained by Mexico (+1.4%), while the prices for the other major suppliers experienced mixed trend patterns.
ExportsUnited States’s Exports of Safes, Strongboxes And Doors Of Base Metal
In 2024, shipments abroad of safes, strongboxes and doors of base metal decreased by -18.9% to 4.4K tons, falling for the second year in a row after two years of growth. Over the period under review, exports saw a abrupt descent. The most prominent rate of growth was recorded in 2022 when exports increased by 26%. Over the period under review, the exports hit record highs at 8.3K tons in 2014; however, from 2015 to 2024, the exports failed to regain momentum.
In value terms, safes and strongboxes exports fell remarkably to $35M in 2024. Overall, exports saw a perceptible reduction. The pace of growth was the most pronounced in 2021 with an increase of 16% against the previous year. Over the period under review, the exports reached the maximum at $59M in 2013; however, from 2014 to 2024, the exports remained at a lower figure.
Exports By Country
Canada (1.6K tons) was the main destination for safes and strongboxes exports from the United States, accounting for a 37% share of total exports. Moreover, safes and strongboxes exports to Canada exceeded the volume sent to the second major destination, Japan (604 tons), threefold. Mexico (480 tons) ranked third in terms of total exports with an 11% share.
From 2013 to 2024, the average annual rate of growth in terms of volume to Canada amounted to -4.3%. Exports to the other major destinations recorded the following average annual rates of exports growth: Japan (-5.9% per year) and Mexico (-4.4% per year).
In value terms, Canada ($15M) remains the key foreign market for safes, strongboxes and doors of base metal exports from the United States, comprising 43% of total exports. The second position in the ranking was held by Mexico ($3.4M), with a 9.7% share of total exports. It was followed by Japan, with a 5.2% share.
From 2013 to 2024, the average annual rate of growth in terms of value to Canada totaled -4.2%. Exports to the other major destinations recorded the following average annual rates of exports growth: Mexico (-1.2% per year) and Japan (-7.5% per year).
Export Prices By Country
In 2024, the average safes and strongboxes export price amounted to $7,883 per ton, picking up by 3.1% against the previous year. Overall, the export price continues to indicate a relatively flat trend pattern. The growth pace was the most rapid in 2023 when the average export price increased by 19% against the previous year. Over the period under review, the average export prices reached the maximum in 2024 and is likely to see steady growth in years to come.
Prices varied noticeably by country of destination: amid the top suppliers, the country with the highest price was the UK ($19,378 per ton), while the average price for exports to Japan ($2,967 per ton) was amongst the lowest.
From 2013 to 2024, the most notable rate of growth in terms of prices was recorded for supplies to the UK (+14.4%), while the prices for the other major destinations experienced more modest paces of growth.