

Aug 30, 2025
IndexBox has just published a new report: U.S. – Plums And Sloes – Market Analysis, Forecast, Size, Trends and Insights.
The demand for plums and sloes in the United States is on the rise, leading to an anticipated increase in market volume and value over the next decade. Market performance is expected to expand at a CAGR of +0.5% in volume and +1.4% in value from 2024 to 2035, showcasing a positive trend in consumption and market growth.
Market Forecast
Driven by increasing demand for plums and sloes in the United States, the market is expected to continue an upward consumption trend over the next decade. Market performance is forecast to retain its current trend pattern, expanding with an anticipated CAGR of +0.5% for the period from 2024 to 2035, which is projected to bring the market volume to 321K tons by the end of 2035.
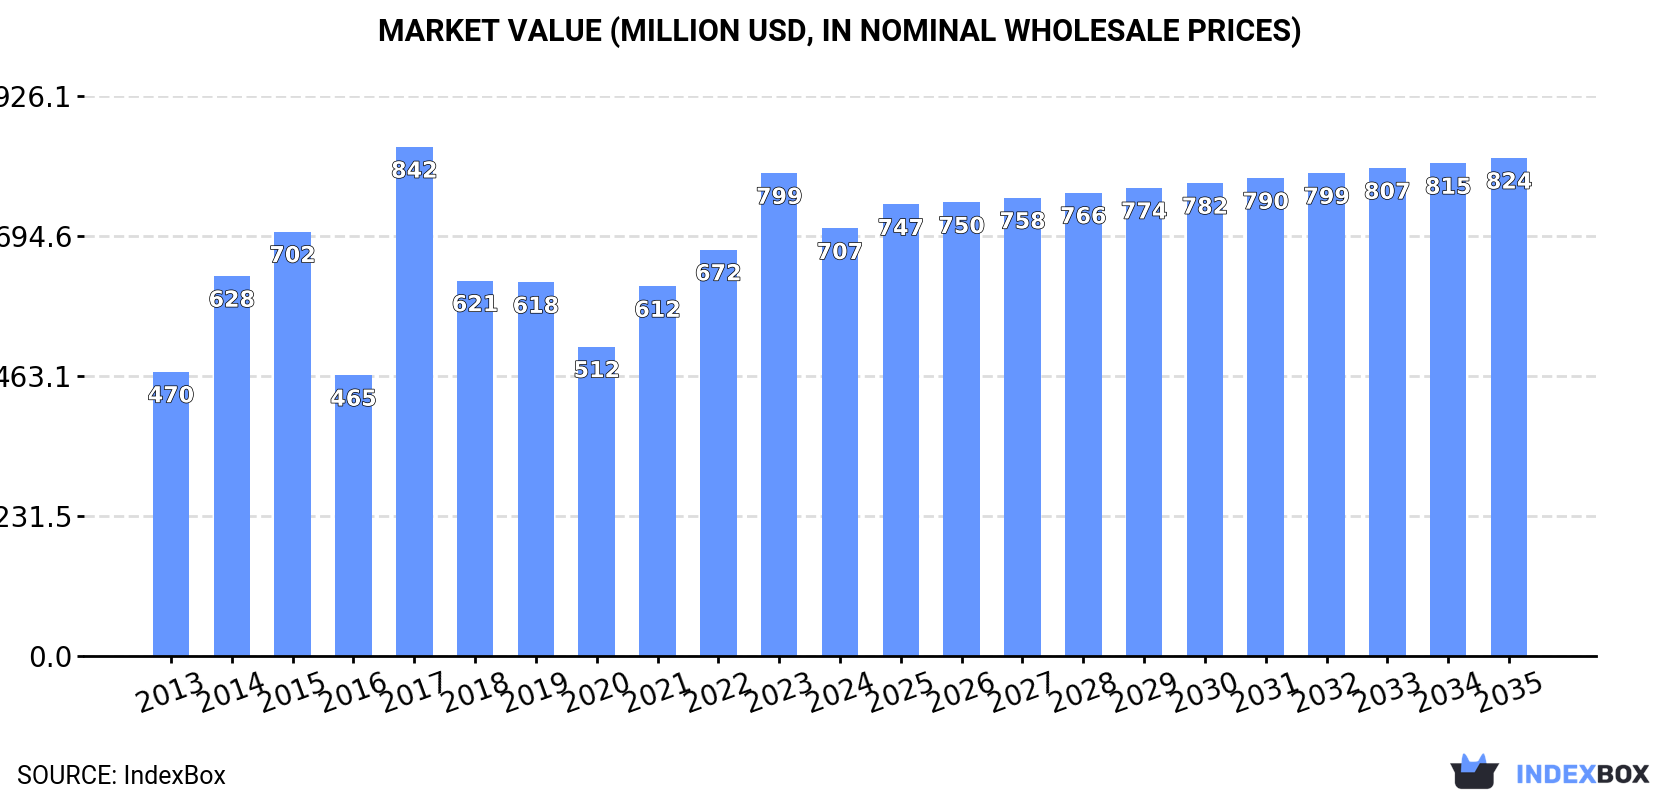
In value terms, the market is forecast to increase with an anticipated CAGR of +1.4% for the period from 2024 to 2035, which is projected to bring the market value to $824M (in nominal wholesale prices) by the end of 2035.
 ConsumptionUnited States’s Consumption of Plums And Sloes
In 2024, approx. 304K tons of plums and sloes were consumed in the United States; which is down by -11.4% compared with the previous year. Overall, consumption, however, showed a relatively flat trend pattern. Plum and sloe consumption peaked at 418K tons in 2015; however, from 2016 to 2024, consumption remained at a lower figure.
The revenue of the plum and sloe market in the United States reduced to $707M in 2024, declining by -11.4% against the previous year. This figure reflects the total revenues of producers and importers (excluding logistics costs, retail marketing costs, and retailers’ margins, which will be included in the final consumer price). In general, the total consumption indicated a tangible increase from 2013 to 2024: its value increased at an average annual rate of +3.8% over the last eleven years. The trend pattern, however, indicated some noticeable fluctuations being recorded throughout the analyzed period. Based on 2024 figures, consumption increased by +38.2% against 2020 indices. As a result, consumption reached the peak level of $842M. From 2018 to 2024, the growth of the market remained at a somewhat lower figure.
ProductionUnited States’s Production of Plums And Sloes
In 2024, the amount of plums and sloes produced in the United States contracted to 298K tons, reducing by -12.8% compared with the previous year. Over the period under review, production showed a relatively flat trend pattern. The most prominent rate of growth was recorded in 2017 with an increase of 67% against the previous year. Plum and sloe production peaked at 435K tons in 2015; however, from 2016 to 2024, production stood at a somewhat lower figure. Plum and sloe output in the United States indicated a relatively flat trend pattern, which was largely conditioned by a relatively flat trend pattern of the harvested area and tangible growth in yield figures.
In value terms, plum and sloe production declined to $722M in 2024. Overall, the total production indicated measured growth from 2013 to 2024: its value increased at an average annual rate of +3.5% over the last eleven-year period. The trend pattern, however, indicated some noticeable fluctuations being recorded throughout the analyzed period. Based on 2024 figures, production increased by +35.5% against 2020 indices. The pace of growth appeared the most rapid in 2017 with an increase of 85% against the previous year. As a result, production reached the peak level of $885M. From 2018 to 2024, production growth remained at a somewhat lower figure.
Yield
The average yield of plums and sloes in the United States dropped to 16 tons per ha in 2024, waning by -13.1% against the previous year’s figure. In general, the yield indicated a noticeable increase from 2013 to 2024: its figure increased at an average annual rate of +2.8% over the last eleven years. The trend pattern, however, indicated some noticeable fluctuations being recorded throughout the analyzed period. Based on 2024 figures, plum and sloe yield increased by +37.2% against 2020 indices. The most prominent rate of growth was recorded in 2017 with an increase of 67% against the previous year. Over the period under review, the average plum and sloe yield hit record highs at 18 tons per ha in 2023, and then reduced in the following year.
Harvested Area
In 2024, the total area harvested in terms of plums and sloes production in the United States stood at 19K ha, therefore, remained relatively stable against 2023 figures. Over the period under review, the harvested area, however, continues to indicate a pronounced decrease. The plum and sloe harvested area peaked at 29K ha in 2013; however, from 2014 to 2024, the harvested area stood at a somewhat lower figure.
ImportsUnited States’s Imports of Plums And Sloes
For the fourth consecutive year, the United States recorded growth in supplies from abroad of plums and sloes, which increased by 24% to 30K tons in 2024. In general, imports, however, showed a relatively flat trend pattern. The most prominent rate of growth was recorded in 2015 with an increase of 83%. Imports peaked at 30K tons in 2013; however, from 2014 to 2024, imports failed to regain momentum.
In value terms, plum and sloe imports soared to $63M in 2024. Overall, total imports indicated mild growth from 2013 to 2024: its value increased at an average annual rate of +1.5% over the last eleven-year period. The trend pattern, however, indicated some noticeable fluctuations being recorded throughout the analyzed period. Based on 2024 figures, imports increased by +69.4% against 2020 indices. The pace of growth was the most pronounced in 2015 with an increase of 65%. Over the period under review, imports attained the maximum at $66M in 2016; however, from 2017 to 2024, imports stood at a somewhat lower figure.
Imports By Country
In 2024, Chile (24K tons) constituted the largest supplier of plum and sloe to the United States, accounting for a 81% share of total imports. Moreover, plum and sloe imports from Chile exceeded the figures recorded by the second-largest supplier, South Africa (5.5K tons), fourfold.
From 2013 to 2024, the average annual rate of growth in terms of volume from Chile amounted to -2.1%.
In value terms, Chile ($52M) constituted the largest supplier of plums and sloes to the United States, comprising 82% of total imports. The second position in the ranking was held by South Africa ($11M), with a 17% share of total imports.
From 2013 to 2024, the average annual growth rate of value from Chile was relatively modest.
Import Prices By Country
In 2024, the average plum and sloe import price amounted to $2,137 per ton, with an increase of 9.1% against the previous year. Over the period from 2013 to 2024, it increased at an average annual rate of +1.7%. The pace of growth was the most pronounced in 2014 an increase of 48%. As a result, import price reached the peak level of $2,633 per ton. From 2015 to 2024, the average import prices remained at a somewhat lower figure.
Average prices varied noticeably amongst the major supplying countries. In 2024, amid the top importers, the country with the highest price was Chile ($2,171 per ton), while the price for South Africa totaled $1,977 per ton.
From 2013 to 2024, the most notable rate of growth in terms of prices was attained by Chile (+1.9%).
ExportsUnited States’s Exports of Plums And Sloes
In 2024, shipments abroad of plums and sloes increased by 5.1% to 24K tons, rising for the second consecutive year after four years of decline. In general, exports, however, saw a abrupt slump. The pace of growth appeared the most rapid in 2023 with an increase of 44%. The exports peaked at 59K tons in 2013; however, from 2014 to 2024, the exports failed to regain momentum.
In value terms, plum and sloe exports rose sharply to $60M in 2024. Over the period under review, exports, however, continue to indicate a perceptible shrinkage. The most prominent rate of growth was recorded in 2023 with an increase of 25%. Over the period under review, the exports hit record highs at $82M in 2013; however, from 2014 to 2024, the exports failed to regain momentum.
Exports By Country
Canada (10K tons), Mexico (6.7K tons) and Hong Kong SAR (2.7K tons) were the main destinations of plum and sloe exports from the United States, with a combined 83% share of total exports.
From 2013 to 2024, the biggest increases were recorded for Mexico (with a CAGR of -2.6%), while shipments for the other leaders experienced a decline.
In value terms, the largest markets for plum and sloe exported from the United States were Canada ($25M), Mexico ($13M) and Hong Kong SAR ($10M), together comprising 81% of total exports.
Mexico, with a CAGR of +1.9%, recorded the highest rates of growth with regard to the value of exports, among the main countries of destination over the period under review, while shipments for the other leaders experienced mixed trend patterns.
Export Prices By Country
In 2024, the average plum and sloe export price amounted to $2,566 per ton, approximately mirroring the previous year. In general, export price indicated a resilient increase from 2013 to 2024: its price increased at an average annual rate of +5.6% over the last eleven-year period. The trend pattern, however, indicated some noticeable fluctuations being recorded throughout the analyzed period. Based on 2024 figures, plum and sloe export price decreased by -13.0% against 2022 indices. The most prominent rate of growth was recorded in 2022 an increase of 32% against the previous year. As a result, the export price reached the peak level of $2,949 per ton. From 2023 to 2024, the average export prices remained at a somewhat lower figure.
Prices varied noticeably by country of destination: amid the top suppliers, the country with the highest price was China ($3,912 per ton), while the average price for exports to Mexico ($1,966 per ton) was amongst the lowest.
From 2013 to 2024, the most notable rate of growth in terms of prices was recorded for supplies to China (+11.3%), while the prices for the other major destinations experienced more modest paces of growth.