The latest revisions to monthly payroll employment data issued in August by the Bureau of Labor Statistics (BLS) were large, renewing concerns about data reliability. However, our updated analysis shows that these revisions remain similar to other large revisions when compared with historical data over the last 60 years. This suggests that incoming data are not generally subject to greater fluctuations—and thus may not reflect greater uncertainty—than in the past.
Data reliability continues to be questioned
In a March 2025 study (Leduc, Oliveira, and Paulson 2025), we assessed short-term revisions in payroll employment and consumer price index (CPI) inflation data over past decades. We found that these revisions were roughly the same size over the two to three years ending in 2024 as they were in the years preceding the pandemic, on average.
Our findings ease some concerns about the reliability of the data and that monetary policy may become too gradual. During times of high uncertainty, policymakers may put less weight on their forecasts and let the evolution of incoming data have more influence on their actions (see, for example, Daly 2023). If policymakers also perceive the data as more uncertain, they may need more evidence that the economy is moving in a particular direction before adjusting policy, which runs the risk of falling behind the curve.
In the current environment of continuing elevated uncertainty, questions about the reliability of incoming economic data have persisted. For example, in June, The Economist published an article exploring the possibility of U.S. economic data becoming murkier (The Economist 2025). In July, the BLS issued a note addressing data collection reductions around the information underlying CPI data releases (Bureau of Labor Statistics 2025a).
More recently, the discussion resurfaced following the August release of payroll employment data (Bureau of Labor Statistics 2025b). In its release, the BLS says that data revisions for the months of May and June were “larger than normal” and that the gains in total nonfarm payroll employment were revised down by 125,000 jobs and 133,000 jobs, respectively. The joint downward revisions of 258,000 jobs brought the overall gains for each of these two months to fewer than 20,000 jobs. Alongside the reading of 73,000 jobs gained in July, the latest revisions to payroll employment numbers spurred concerns that the labor market has been weaker than previously thought.
Recent revisions to payroll employment gains data in historical context
Following the methodology in our March analysis (Leduc, Oliveira, and Paulson 2025), we assess payroll employment data volatility by looking at data revisions using the Philadelphia Fed’s Real-Time Data Set. This data set reports how data have been revised over time as statistical agencies obtain more information.
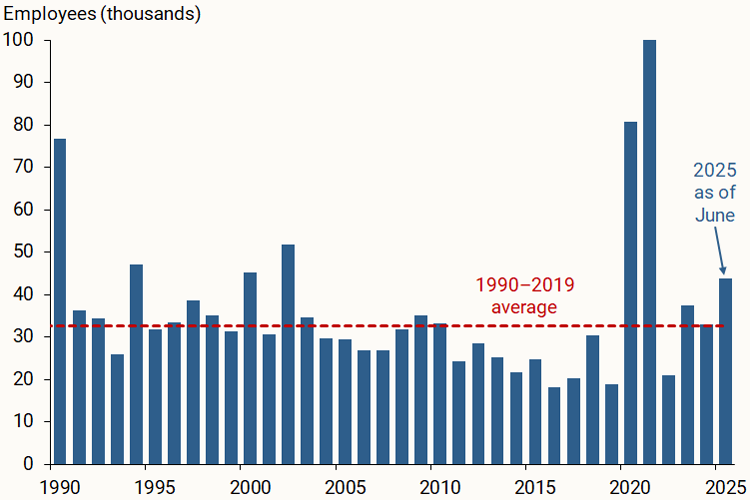
Figure 1 shows the average monthly revision to payroll employment gains per year since 1990, using the absolute value of the change between the first release and revised second release of the data. The second release provides a refined estimate for a given month usually one month after the initial release. The figure updates our March analysis to include data on revisions through June 2025.
Figure 1
Average absolute revisions in payroll employment gains
 Notes: Average revision in absolute terms between the first and second data releases for each month. Rightmost bar shows the average for 2025 so far (January-June).
Source: Bureau of Labor Statistics via the Philadelphia Fed and authors’ calculations.
The figure shows that, on an annual basis, first revisions to payroll employment gains data in 2025 through June are within the historical range. These 2025 revisions have been a bit higher than those in 2023 and 2024 on average, but they are still generally comparable to the pre-pandemic historical average (red dashed line) and many other average annual readings.
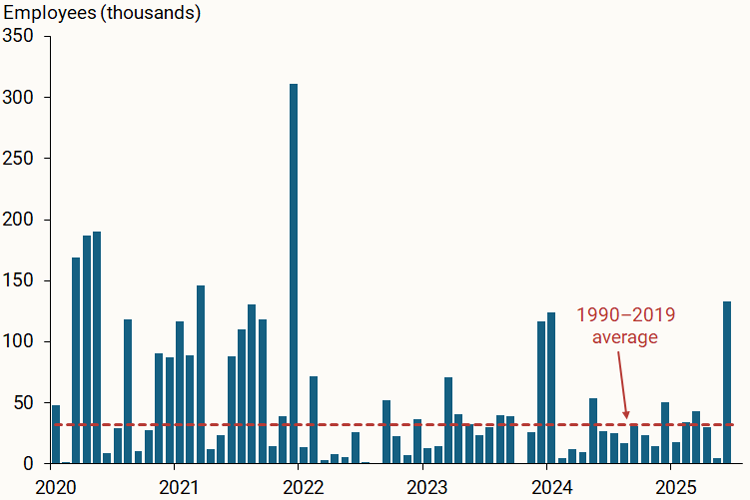
To assess how the August revisions have affected the average reading for the year, we next look at month-to-month revisions. Figure 2 breaks down the annual averages into their individual monthly revisions, focusing on the period since January 2020.
Figure 2
Monthly absolute revisions in payroll employment gains
 Notes: Monthly revisions in absolute terms between the first and second data releases for each month. Data through June 2025.
Source: Bureau of Labor Statistics via the Philadelphia Fed and authors’ calculations.
The far right bar in Figure 2 shows the first revision to payroll employment gains for June 2025. This revision was much larger than the first revisions for the preceding 16 months and the pre-pandemic historical average (red dashed line). However, revisions of similar magnitude have been observed many times in the past, including as recently as in December 2023 and January 2024.
It is important to note, however, that Figures 1 and 2 focus on the first revision for each month, so they do not capture the second and latest large revision to May 2025 data. We repeat our analysis focusing on second revisions only, or on the average between first and second revisions. Under these alternate definitions, the latest readings are closer to those of preceding months and the historical sample average (not shown). Our general results also hold true when we scale the revisions by total payroll employment for each month.
The distribution of revisions to payroll employment gains data
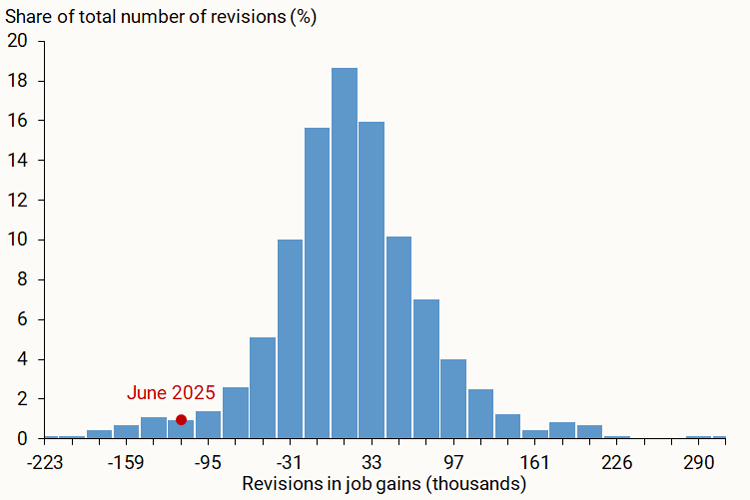
Next, we assess how first revisions to payroll employment gains are distributed across the entire sample. We start by expanding our sample back to November 1964, the first full month of data for which initial month-to-month revisions for payroll employment gains are readily available in the Philadelphia Fed’s Real-Time Data Set.
Figure 3 shows that the distribution of first revisions is generally symmetric. The red dot in the figure pinpoints where the first revision for June 2025 falls along the distribution of the data. While the June 2025 revision is negative and large, some other past revisions have been of similar or greater magnitude on either side of the distribution. The likelihood of having a revision of this size or larger is small but not negligible, about 7%, or 1 in 14 chance of occurring.
Figure 3
Distribution of revisions in payroll employment gains
 Notes: Monthly revisions between the first and second data releases for each month. Data through June 2025. Red dot shows where the June 2025 revision falls on the horizontal axis; it has no interpretation against the vertical axis.
Source: Bureau of Labor Statistics via the Philadelphia Fed and authors’ calculations.
Conclusion
Overall, some recent revisions to payroll employment gains data were large relative to those issued over the last year or so. Still, over the last 60 years, there have been examples of first revisions that were of similar or greater magnitude. This continues to suggest that the incoming data are within the historical range and not generally subject to greater fluctuations—and thus may not reflect higher uncertainty—than in the past.
References
Bureau of Labor Statistics. 2025a. “More Information on CPI Collection Reductions.” July 29.
Bureau of Labor Statistics. 2025b. “Employment Situation Summary.” August 1, 2025.
Daly, Mary C. 2023. “Calibrating Policy in an Uncertain Time.” Remarks to the Salt Lake Chamber, Salt Lake City, UT, April 12.
Leduc, Sylvain, Luiz E. Oliveira, and Caroline Paulson. 2025. “Do Low Survey Response Rates Threaten Data Dependence.” FRBSF Economic Letter 2025-07 (March 31).
The Economist. 2025. “America’s Economic Data Are Becoming Murkier.” Atlanta, GA, June 29, 2025.

