

Sep 3, 2025
IndexBox has just published a new report: U.S. – Refined Copper – Market Analysis, Forecast, Size, Trends And Insights.
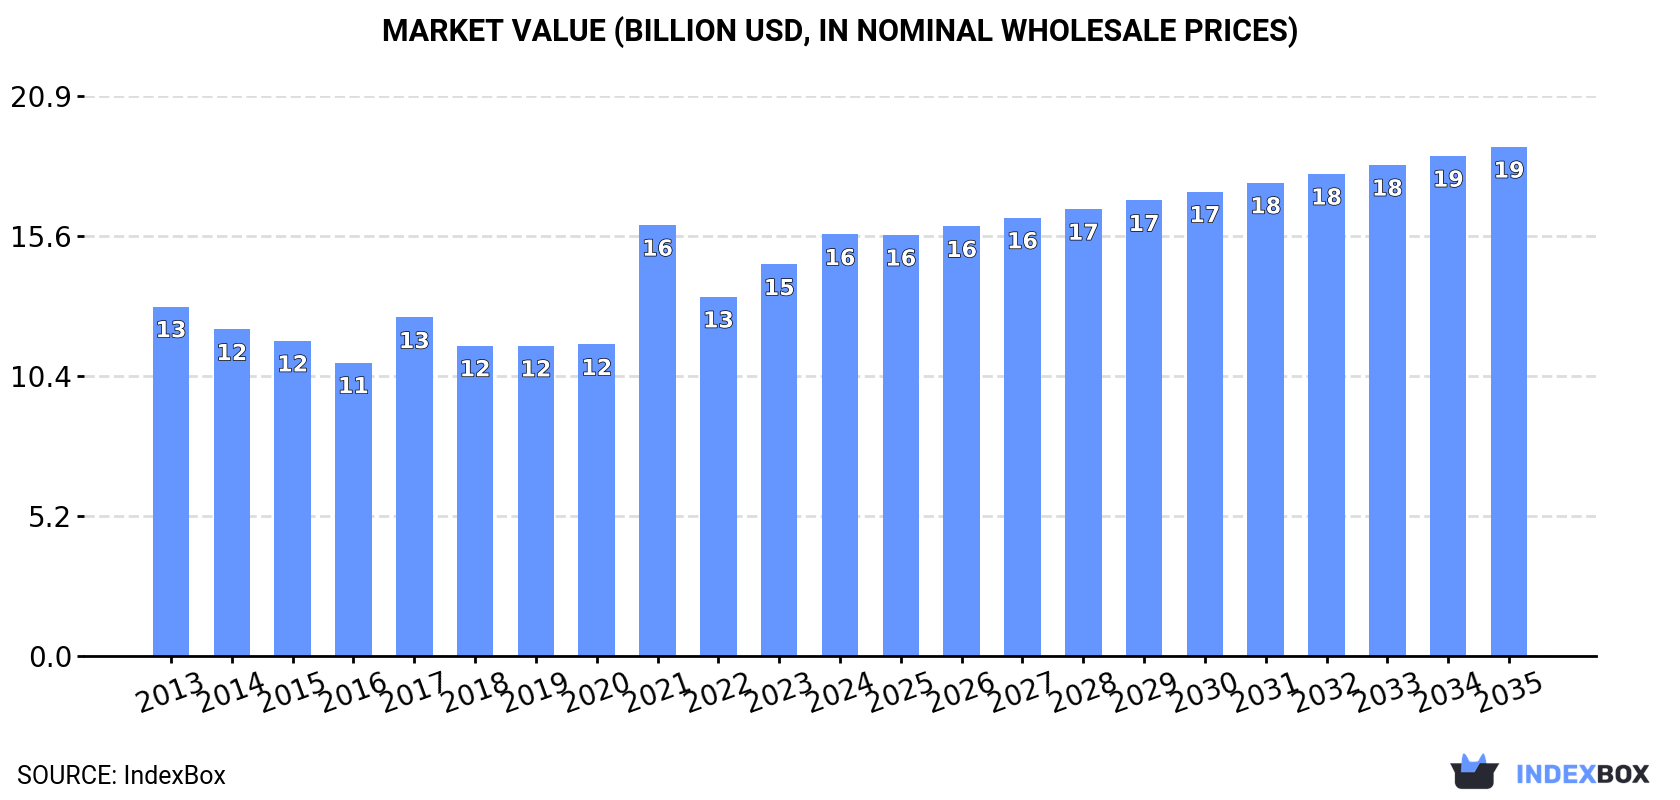
The demand for refined copper in the United States is expected to drive market growth over the next decade, with a forecasted CAGR of +0.2% in market volume and +1.7% in market value from 2024 to 2035. By the end of 2035, the market volume is projected to reach 2M tons and the market value is expected to hit $19B in nominal prices.
Market Forecast
Driven by increasing demand for refined copper in the United States, the market is expected to continue an upward consumption trend over the next decade. Market performance is forecast to retain its current trend pattern, expanding with an anticipated CAGR of +0.2% for the period from 2024 to 2035, which is projected to bring the market volume to 2M tons by the end of 2035.
In value terms, the market is forecast to increase with an anticipated CAGR of +1.7% for the period from 2024 to 2035, which is projected to bring the market value to $19B (in nominal wholesale prices) by the end of 2035.
 ConsumptionUnited States’s Consumption of Refined Copper
In 2024, consumption of refined copper increased by 6.7% to 1.9M tons for the first time since 2021, thus ending a two-year declining trend. In general, consumption continues to indicate a relatively flat trend pattern. Over the period under review, consumption attained the peak volume at 2M tons in 2016; however, from 2017 to 2024, consumption stood at a somewhat lower figure.
The value of the copper market in the United States rose rapidly to $15.7B in 2024, increasing by 7.7% against the previous year. This figure reflects the total revenues of producers and importers (excluding logistics costs, retail marketing costs, and retailers’ margins, which will be included in the final consumer price). The market value increased at an average annual rate of +1.7% from 2013 to 2024; the trend pattern indicated some noticeable fluctuations being recorded throughout the analyzed period. As a result, consumption reached the peak level of $16.1B. From 2022 to 2024, the growth of the market failed to regain momentum.
ProductionUnited States’s Production of Refined Copper
In 2024, production of refined copper in the United States was estimated at 1.2M tons, approximately equating the previous year’s figure. Overall, production, however, saw a relatively flat trend pattern. The most prominent rate of growth was recorded in 2014 with an increase of 8.8%. Over the period under review, production attained the maximum volume at 1.4M tons in 2016; however, from 2017 to 2024, production remained at a lower figure.
In value terms, copper production totaled $10.2B in 2024. The total output value increased at an average annual rate of +1.4% over the period from 2013 to 2024; the trend pattern indicated some noticeable fluctuations being recorded throughout the analyzed period. The pace of growth appeared the most rapid in 2021 with an increase of 31%. As a result, production reached the peak level of $10.4B. From 2022 to 2024, production growth failed to regain momentum.
ImportsUnited States’s Imports of Refined Copper
Copper imports into the United States surged to 911K tons in 2024, increasing by 19% on the previous year. The total import volume increased at an average annual rate of +2.0% over the period from 2013 to 2024; however, the trend pattern indicated some noticeable fluctuations being recorded in certain years. The most prominent rate of growth was recorded in 2021 when imports increased by 35% against the previous year. As a result, imports reached the peak of 911K tons; afterwards, it flattened through to 2024.
In value terms, copper imports surged to $8.5B in 2024. In general, imports recorded measured growth. The pace of growth appeared the most rapid in 2021 with an increase of 107%. Over the period under review, imports reached the maximum in 2024 and are expected to retain growth in the immediate term.
Imports By Country
In 2024, Chile (652K tons) constituted the largest supplier of copper to the United States, with a 71% share of total imports. Moreover, copper imports from Chile exceeded the figures recorded by the second-largest supplier, Canada (139K tons), fivefold. The third position in this ranking was held by Peru (63K tons), with a 6.9% share.
From 2013 to 2024, the average annual rate of growth in terms of volume from Chile totaled +3.2%. The remaining supplying countries recorded the following average annual rates of imports growth: Canada (-1.8% per year) and Peru (+17.3% per year).
In value terms, Chile ($6.1B) constituted the largest supplier of refined copper to the United States, comprising 72% of total imports. The second position in the ranking was held by Canada ($1.3B), with a 15% share of total imports. It was followed by Peru, with a 6.8% share.
From 2013 to 2024, the average annual rate of growth in terms of value from Chile totaled +5.2%. The remaining supplying countries recorded the following average annual rates of imports growth: Canada (+0.2% per year) and Peru (+19.1% per year).
Import Prices By Country
In 2024, the average copper import price amounted to $9,339 per ton, with an increase of 7.8% against the previous year. Over the period under review, import price indicated mild growth from 2013 to 2024: its price increased at an average annual rate of +1.9% over the last eleven-year period. The trend pattern, however, indicated some noticeable fluctuations being recorded throughout the analyzed period. The growth pace was the most rapid in 2021 an increase of 53%. The import price peaked in 2024 and is expected to retain growth in years to come.
Average prices varied noticeably amongst the major supplying countries. In 2024, amid the top importers, the highest price was recorded for prices from Democratic Republic of the Congo ($9,377 per ton) and Chile ($9,357 per ton), while the price for Mexico ($9,092 per ton) and Peru ($9,132 per ton) were amongst the lowest.
From 2013 to 2024, the most notable rate of growth in terms of prices was attained by Democratic Republic of the Congo (+2.7%), while the prices for the other major suppliers experienced more modest paces of growth.
ExportsUnited States’s Exports of Refined Copper
In 2024, the amount of refined copper exported from the United States reached 188K tons, growing by 14% on the year before. Over the period under review, total exports indicated measured growth from 2013 to 2024: its volume increased at an average annual rate of +4.7% over the last eleven-year period. The trend pattern, however, indicated some noticeable fluctuations being recorded throughout the analyzed period. Based on 2024 figures, exports increased by +94.3% against 2022 indices. The growth pace was the most rapid in 2023 when exports increased by 70%. Over the period under review, the exports reached the peak figure at 212K tons in 2018; however, from 2019 to 2024, the exports remained at a lower figure.
In value terms, copper exports surged to $1.7B in 2024. Overall, exports saw a remarkable increase. The pace of growth was the most pronounced in 2023 with an increase of 99% against the previous year. Over the period under review, the exports reached the peak figure in 2024 and are likely to see steady growth in the near future.
Exports By Country
Mexico (153K tons) was the main destination for copper exports from the United States, accounting for a 81% share of total exports. Moreover, copper exports to Mexico exceeded the volume sent to the second major destination, Canada (21K tons), sevenfold. The third position in this ranking was held by Malaysia (5.7K tons), with a 3% share.
From 2013 to 2024, the average annual growth rate of volume to Mexico amounted to +10.4%. Exports to the other major destinations recorded the following average annual rates of exports growth: Canada (+22.5% per year) and Malaysia (+110.9% per year).
In value terms, Mexico ($1.5B) remains the key foreign market for refined copper exports from the United States, comprising 87% of total exports. The second position in the ranking was taken by Canada ($106M), with a 6.1% share of total exports. It was followed by the Netherlands, with a 2.5% share.
From 2013 to 2024, the average annual growth rate of value to Mexico amounted to +13.0%. Exports to the other major destinations recorded the following average annual rates of exports growth: Canada (+19.3% per year) and the Netherlands (+138.0% per year).
Export Prices By Country
The average copper export price stood at $9,232 per ton in 2024, standing approx. at the previous year. Over the period under review, export price indicated a temperate expansion from 2013 to 2024: its price increased at an average annual rate of +2.3% over the last eleven-year period. The trend pattern, however, indicated some noticeable fluctuations being recorded throughout the analyzed period. Based on 2024 figures, copper export price decreased by -2.3% against 2021 indices. The pace of growth was the most pronounced in 2021 an increase of 42% against the previous year. As a result, the export price reached the peak level of $9,450 per ton. From 2022 to 2024, the average export prices failed to regain momentum.
Prices varied noticeably by country of destination: amid the top suppliers, the country with the highest price was Mexico ($9,893 per ton), while the average price for exports to Canada ($5,082 per ton) was amongst the lowest.
From 2013 to 2024, the most notable rate of growth in terms of prices was recorded for supplies to the Netherlands (+13.7%), while the prices for the other major destinations experienced more modest paces of growth.