
Generation-side benefits encompass the cost savings and efficiency improvements realized throughout the power production process by employing optimized and advanced technological methods. This includes direct reductions in operational costs, improvements in equipment maintenance, more efficient fuel consumption, and enhanced scheduling practices. Collectively, these factors enable power generation enterprises to achieve higher economic returns and strengthen their capacity for sustainable development in a competitive market environment.
Grid-side benefits refer to the cost reductions and operational efficiency gains attained during power transmission and distribution through technological innovations and optimized management strategies. These benefits include savings in capital investment and operational expenditures, as well as enhancements in grid reliability, flexibility, and intelligence. Such improvements contribute to increasing the overall economic performance and stability of the power system.
User-side benefits describe the cost savings and additional economic advantages realized by power consumers through the application of advanced technologies and supportive policies during electricity usage. This encompasses direct reductions in electricity expenses, the reception of policy-driven subsidies, and investments in more efficient electrical appliances and systems. As a result, end users experience both economic and qualitative improvements in their energy consumption.
Explanation of tertiary indicators
Avoidable peak load capacity costs represent the reduction in additional capacity investments required during peak electricity demand periods achieved through effective load management and demand response strategies. By actively controlling and shifting demand during peak usage times, the necessity for constructing new generation facilities is minimized, resulting in substantial savings in infrastructure development and ongoing maintenance costs.
Avoidable generation fuel costs refer to the savings in fuel expenditures attained by improving generation efficiency and optimizing the energy mix. The adoption of more efficient generation technologies or increasing the integration of renewable energy sources reduces dependence on conventional fossil fuels, thereby significantly lowering overall fuel consumption and associated costs.
Avoidable unit start-up and shut-down costs denote the cost savings derived from optimizing power system operational scheduling to decrease the frequency of generator start-up and shut-down cycles. This optimization reduces fuel usage and mitigates mechanical wear during these processes, leading to lower maintenance demands and extending equipment lifespan, ultimately decreasing maintenance and replacement expenses.
Avoidable power generation construction costs refer to the reduction in the need for building new power generation facilities by improving the utilization and efficiency of existing power systems. This reduction is achieved through the application of smart grid technologies and distributed energy systems, which help optimize existing assets and thereby save on large-scale infrastructure investments, effectively lowering long-term capital expenditures.
Avoidable grid investment costs represent the decreased requirement for new grid infrastructure investments, attained through effective demand management and grid optimization. By maximizing the use of existing grid resources and enhancing load management capabilities, unnecessary grid expansions and new construction projects can be avoided, resulting in significant capital cost savings.
Avoidable system operation and maintenance costs indicate the reduction in resources and expenses necessary for daily grid operation and maintenance. This is accomplished by deploying intelligent and automated technologies that enhance fault detection, streamline inspections, and facilitate equipment upgrades, thereby lowering operational expenditures related to repairs and routine upkeep.
Smart equipment investment costs refer to the capital expenditures involved in deploying advanced grid intelligence devices such as smart meters, sensors, and control systems. Although these investments entail higher upfront costs, they enable more precise monitoring, real-time management, and operational efficiency, ultimately delivering substantial long-term economic benefits and improved grid performance.
Enhancing the system load factor involves improving the utilization rate of grid equipment by optimizing power demand management and load scheduling. This approach ensures the power system operates efficiently across varying load conditions, reducing idle capacity and thereby increasing the overall economic efficiency and operational stability of the grid.
End-user forced power rationing costs represent the economic losses and inconveniences experienced by users when electricity supply is forcibly limited due to tight supply conditions. Effective power supply and demand optimization can minimize the frequency and impact of forced rationing, thereby reducing both direct financial losses and indirect disruptions to users’ operations.
Benefits of policy subsidies refer to the financial incentives and support provided by government programs to users who participate in energy-saving initiatives and renewable energy projects. These subsidies directly reduce users’ electricity expenses while promoting investments in green technologies and energy-efficient equipment.
User equipment investment costs denote the expenditures incurred by end-users to improve electricity efficiency and lower energy costs through investments in high-efficiency electrical appliances and systems. Such investments may include energy-saving devices, smart home technologies, and distributed energy resources. Despite higher initial costs, these investments generate significant long-term savings and economic benefits.
Performance testing section
To ensure database consistency, data insertion operations are executed in a single-threaded manner. Table 3 presents a comparison of insertion times for two systems using identical data volumes. The results demonstrate that the proposed system significantly outperforms the simulation system in terms of insertion speed. Moreover, the performance advantage becomes increasingly pronounced as the data volume grows. Specifically, the insertion efficiency for datasets of 50,000, 500,000, and 5,000,000 battery data entries is quantitatively compared. As shown, the efficiency gap widens with larger datasets, confirming the proposed system’s superior capability in handling large-scale data imports.
Table 3 Comparison of insertion time and efficiency ratio between two systems under different data volumes.
This section also evaluates concurrent multi-threaded data access performance for both MySQL and distributed HBase databases. The results, summarized in Table 4, show that despite MySQL optimizations such as indexing, its query performance remains inferior to that of HBase. The performance gap further widens with increasing data volume and thread concurrency. Remarkably, the current HBase cluster maintains stable query times and has not reached its processing capacity even with tens of millions of records and high concurrency levels.
Table 4 Comparison of data access performance under different data volumes and thread counts.
Furthermore, a variance calculation test was conducted on a specified data volume to compare computational capabilities between the simulation system and the proposed system. The results, shown in Table 5, clearly indicate that the proposed system achieves significantly lower computation times. Although overheads such as Hadoop task initialization, file I/O, and inter-cluster communication latency prevent the cluster from reaching a fivefold performance gain over a single server, the improvements remain substantial.
Table 5 Computation time and efficiency ratio for simulation system and proposed system under specified data volumes.
Table 6 illustrates the significant advantages of the optimized cloud computing platform proposed in this research across various operational scenarios. Under normal load conditions, the average task completion time is nearly halved, while Central Processing Unit (CPU) and memory utilization increase substantially. This demonstrates that the optimization strategy effectively enhances computing density and response speed. During high load conditions, the platform achieves an approximately 78% increase in system throughput and reduces average response latency by over 57%, owing to more efficient scheduling mechanisms and elastic resource allocation. These improvements contribute markedly to system stability, as evidenced by a 75% reduction in service interruptions. In fault scenarios, the optimized platform leverages container orchestration and intelligent rescheduling mechanisms to significantly shorten fault recovery time by nearly 67%, decrease task loss rate by almost 79%, and improve fault-tolerant task rescheduling success rate by over 50%. These enhancements ensure robust fault tolerance and business continuity. From a cost perspective, the platform demonstrates excellent economic benefits, reducing monthly power consumption by nearly 32% and labor maintenance costs by over 54%, leading to an estimated overall monthly cost saving of approximately 43%.
Table 6 System performance comparison of the cloud-based electric power enterprise design platform before and after optimization under different scenarios.
During the functional testing phase, the system’s eight functional modules are evaluated using real-world data, with key modules undergoing rigorous result verification. Particular emphasis is placed on assessing data insertion, retrieval, and computation performance. Comparative tests simulate traditional data analysis systems, and the results demonstrate that the current system significantly outperforms conventional power data analysis solutions, effectively satisfying the performance requirements for the current implementation phase.
This experimental section details the technical specifications and procedures employed to validate the proposed system’s performance advantages. To ensure database consistency and maintain stability and accuracy during data insertion, a single-threaded execution mode is adopted, minimizing the impact of concurrent operations on data integrity. Table 3 compares data insertion performance with that of a traditional simulation system, revealing substantial efficiency gains. Specifically, insertion of 50,000, 500,000, and 5 million battery records requires only 1.24 s, 7.39 s, and 60.11 s, respectively. These results represent improvements of 8.6, 13.1, and 16.5 times compared to the simulation system, underscoring the proposed system’s superior capacity for handling large-scale data ingestion. Subsequently, multi-threaded concurrent access tests simulate multiple users simultaneously querying the database. Despite optimizations such as indexing applied to the MySQL database, its query performance significantly lags behind the distributed HBase system. Table 4 presents query time comparisons under varying thread counts and data volumes. For example, querying 1 million records with a single thread results in a 1.45-s query time for MySQL versus 0.72 s for HBase. As concurrency increases, MySQL’s query time rises sharply, whereas HBase maintains relatively stable performance. This highlights HBase’s clear advantage in handling high-concurrency workloads over traditional relational databases. Finally, data computation capability is evaluated by comparing variance calculation times between the current system and the simulation system. Table 5 shows that the current system achieves computation times of 285 s, 1,556 s, and 3,112 s for datasets of 300,000, 10 million, and 100 million records, respectively. These results reflect efficiency gains of approximately 3.4, 3.1, and 2.9 times compared to the traditional system. Although the cluster-based approach does not achieve a fivefold speedup over a single server due to overheads such as Hadoop task startup, file reading, and inter-node communication latency, it still delivers significant improvements in processing capacity. In summary, comprehensive testing of data insertion, retrieval, and computation clearly demonstrates that the current system outperforms traditional power data analysis platforms. It effectively meets the performance demands of practical applications, providing a more efficient, scalable, and stable solution for large-scale power data analysis and processing.
This research presents a novel multi-level benefit evaluation model for power enterprises, integrating cloud computing technology and intelligent management techniques, which offers significant advancements compared to traditional evaluation methods. Conventional approaches tend to emphasize single-dimensional analyses focused solely on cost or efficiency. In contrast, this model adopts a comprehensive perspective by evaluating benefits across three key dimensions: the generation side, the grid side, and the user side. This hierarchical, multi-dimensional framework effectively captures the overall benefits of power enterprises during their digital transformation. Moreover, the model leverages cloud computing and IoT technologies to enable real-time data monitoring and intelligent scheduling optimization. These technological integrations not only enhance calculation efficiency and accuracy but also substantially improve resource utilization, cost savings, and system reliability. Compared to traditional methods, this integrated and innovative model facilitates more precise and dynamic benefit evaluations while reducing computational complexity. As a result, it supports the intelligent and precise development of power enterprise management and decision-making processes.
Additionally, the research investigates four types of new energy grid connection and absorption methods. It develops an economic benefit evaluation indicator system for new energy grid integration, centered on demand response and involving power users, grid operators, and power generators as principal stakeholders. Empirical analysis evaluates comprehensive absorption pathways for various new energy types and establishes their specific prioritization order41.
In traditional domains, the values of indicators in the positive domain matrix, interval domain positive domain matrix, and the to-be-tested positive domain matrix may differ significantly. Therefore, it is necessary to normalize the values of each indicator to facilitate efficient and consistent calculations42. For positive indicators, where a larger value is preferable (“larger is better”), normalization is performed as follows:
$${\gamma }_{i}=\frac{{\gamma }_{i}-{\alpha }_{pi}}{{\beta }_{pi}-{\alpha }_{pi}}$$
(4)
For negative indicators, where a smaller value is preferable (“smaller is better”), the normalization equation is:
$${\gamma }_{i}=\frac{{\beta }_{pi}-{\gamma }_{i}}{{\beta }_{pi}-{\alpha }_{pi}}$$
(5)
In these equations, (\({\alpha }_{pi},{\beta }_{pi}\)) represents the range of values for the i-th indicator, known as its domain43.
Following normalization, the weights of each indicator are determined by constructing the judgment matrix A, which satisfies the following conditions:
$$\left\{\begin{array}{c}{\alpha }_{ij}>0\\ {\alpha }_{ij}=\frac{1}{{\alpha }_{ij}}\\ {\alpha }_{ii}=1\end{array}\right.$$
(6)
In Eq. (6), \({\alpha }_{ij}\) represents the relative weight of indicator i compared to indicator j. The scale values and their corresponding qualitative descriptions are listed in Table 7.
Table 7 Scale values and descriptions.
The consistency index C1 is expressed as Equation (7):
$${C}_{1}=\frac{{\varphi }_{max-n}}{n-1}$$
(7)
In Eq. (7), \({\varphi }_{max}\) represents the maximum eigenvalue of the judgment matrix, and \(n\) is the order (size) of the matrix. To evaluate the magnitude of C1 and assess the consistency of the judgment matrix, the random consistency index R1 is introduced44,45,46. The corresponding values of R1 for different matrix orders are illustrated in Fig. 5.
Fig. 5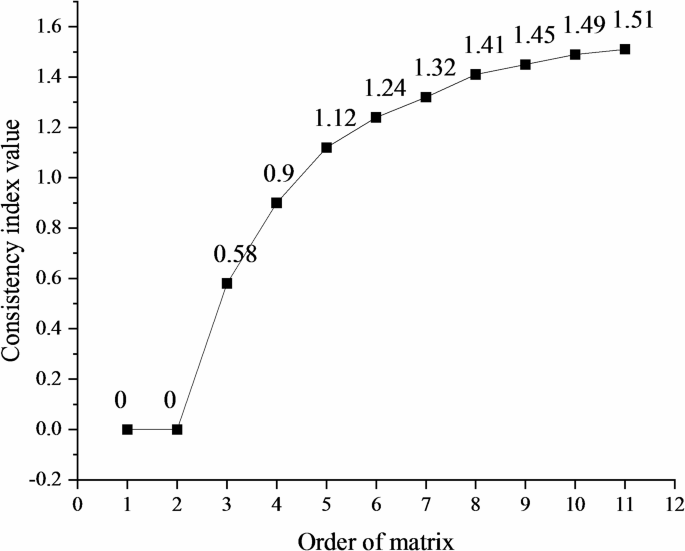
Values of the random consistency index.