

Oct 31, 2025
IndexBox has just published a new report: U.S. – Non-Electrical Articles Of Graphite Or Other Carbon – Market Analysis, Forecast, Size, Trends And Insights.
The United States market for non-electrical articles of graphite or other carbon reached 48K tons in consumption volume and $2.3B in market value in 2024. The market is forecast to grow at a CAGR of +0.5% in volume and +0.7% in value through 2035, reaching 51K tons and $2.5B respectively. Domestic production stood at 52K tons while imports totaled 6.1K tons, primarily from China, Mexico, and Germany. Exports surged 58% to 9.7K tons, with China being the dominant destination. Import prices averaged $38,579 per ton while export prices declined to $39,460 per ton.
Key Findings
Market forecast to grow at +0.5% CAGR to 51K tons by 20352024 consumption reached 48K tons with market value of $2.3BProduction exceeded consumption at 52K tons in 2024Imports recovered to 6.1K tons led by China, Mexico and GermanyExports surged 58% to 9.7K tons with China as main destinationMarket Forecast
Driven by increasing demand for non-electrical articles of graphite or other carbon in the United States, the market is expected to continue an upward consumption trend over the next decade. Market performance is forecast to decelerate, expanding with an anticipated CAGR of +0.5% for the period from 2024 to 2035, which is projected to bring the market volume to 51K tons by the end of 2035.
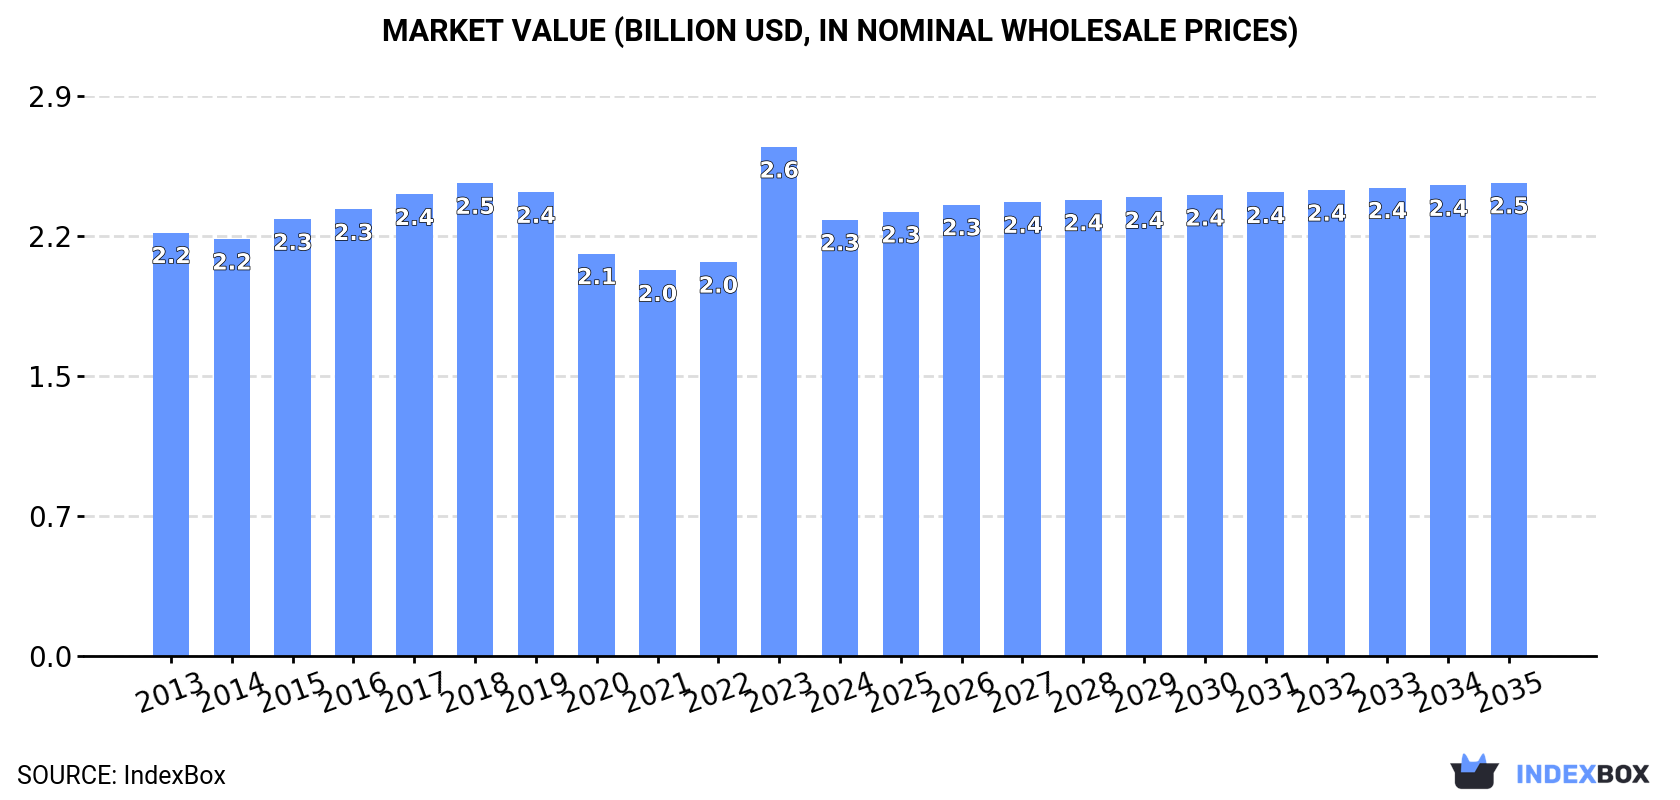
In value terms, the market is forecast to increase with an anticipated CAGR of +0.7% for the period from 2024 to 2035, which is projected to bring the market value to $2.5B (in nominal wholesale prices) by the end of 2035.
 ConsumptionUnited States’s Consumption of Non-Electrical Articles Of Graphite Or Other Carbon
In 2024, consumption of non-electrical articles of graphite or other carbon increased by 0.3% to 48K tons, rising for the third year in a row after two years of decline. The total consumption volume increased at an average annual rate of +1.4% from 2013 to 2024; the trend pattern remained consistent, with only minor fluctuations throughout the analyzed period. The pace of growth appeared the most rapid in 2017 with an increase of 6.3% against the previous year. Graphite non-electrical articles consumption peaked in 2024 and is likely to see steady growth in the immediate term.
The size of the graphite non-electrical articles market in the United States reduced to $2.3B in 2024, dropping by -14.3% against the previous year. This figure reflects the total revenues of producers and importers (excluding logistics costs, retail marketing costs, and retailers’ margins, which will be included in the final consumer price). Over the period under review, consumption saw a relatively flat trend pattern. As a result, consumption attained the peak level of $2.6B, and then contracted in the following year.
ProductionUnited States’s Production of Non-Electrical Articles Of Graphite Or Other Carbon
In 2024, production of non-electrical articles of graphite or other carbon in the United States expanded markedly to 52K tons, surging by 6.5% on 2023 figures. Over the period under review, production recorded a relatively flat trend pattern. The most prominent rate of growth was recorded in 2021 when the production volume increased by 12% against the previous year. As a result, production attained the peak volume of 61K tons. From 2022 to 2024, production growth failed to regain momentum.
In value terms, graphite non-electrical articles production dropped to $2.4B in 2024. Overall, production, however, saw a slight downturn. The growth pace was the most rapid in 2023 with an increase of 42%. Over the period under review, production hit record highs at $3B in 2019; however, from 2020 to 2024, production stood at a somewhat lower figure.
ImportsUnited States’s Imports of Non-Electrical Articles Of Graphite Or Other Carbon
In 2024, supplies from abroad of non-electrical articles of graphite or other carbon was finally on the rise to reach 6.1K tons after two years of decline. In general, imports, however, continue to indicate a noticeable setback. The pace of growth appeared the most rapid in 2020 when imports increased by 46%. Over the period under review, imports attained the peak figure at 25K tons in 2021; however, from 2022 to 2024, imports stood at a somewhat lower figure.
In value terms, graphite non-electrical articles imports soared to $236M in 2024. Over the period under review, imports, however, recorded a abrupt decline. The most prominent rate of growth was recorded in 2014 with an increase of 21%. Imports peaked at $775M in 2019; however, from 2020 to 2024, imports failed to regain momentum.
Imports By Country
China (1.9K tons), Mexico (1.3K tons) and Germany (1.1K tons) were the main suppliers of graphite non-electrical articles imports to the United States, with a combined 70% share of total imports. India, France, Japan, Denmark, South Korea and the UK lagged somewhat behind, together comprising a further 22%.
From 2013 to 2024, the biggest increases were recorded for Denmark (with a CAGR of +56.9%), while purchases for the other leaders experienced more modest paces of growth.
In value terms, Germany ($80M) constituted the largest supplier of non-electrical articles of graphite or other carbon to the United States, comprising 34% of total imports. The second position in the ranking was held by China ($32M), with a 14% share of total imports. It was followed by Mexico, with a 14% share.
From 2013 to 2024, the average annual rate of growth in terms of value from Germany totaled +1.3%. The remaining supplying countries recorded the following average annual rates of imports growth: China (+4.8% per year) and Mexico (+2.1% per year).
Import Prices By Country
In 2024, the average graphite non-electrical articles import price amounted to $38,579 per ton, picking up by 11% against the previous year. Over the period under review, the import price, however, continues to indicate a perceptible reduction. The most prominent rate of growth was recorded in 2023 an increase of 90% against the previous year. Over the period under review, average import prices reached the peak figure at $54,542 per ton in 2014; however, from 2015 to 2024, import prices failed to regain momentum.
There were significant differences in the average prices amongst the major supplying countries. In 2024, amid the top importers, the country with the highest price was South Korea ($225,049 per ton), while the price for India ($5,168 per ton) was amongst the lowest.
From 2013 to 2024, the most notable rate of growth in terms of prices was attained by South Korea (+14.1%), while the prices for the other major suppliers experienced more modest paces of growth.
ExportsUnited States’s Exports of Non-Electrical Articles Of Graphite Or Other Carbon
After two years of decline, shipments abroad of non-electrical articles of graphite or other carbon increased by 58% to 9.7K tons in 2024. Over the period under review, exports, however, recorded a abrupt setback. The exports peaked at 40K tons in 2021; however, from 2022 to 2024, the exports remained at a lower figure.
In value terms, graphite non-electrical articles exports reduced modestly to $381M in 2024. In general, exports, however, saw a abrupt descent. The most prominent rate of growth was recorded in 2014 with an increase of 22%. The exports peaked at $1.4B in 2019; however, from 2020 to 2024, the exports failed to regain momentum.
Exports By Country
China (6.1K tons) was the main destination for graphite non-electrical articles exports from the United States, accounting for a 63% share of total exports. Moreover, graphite non-electrical articles exports to China exceeded the volume sent to the second major destination, Mexico (1.4K tons), fivefold. Canada (527 tons) ranked third in terms of total exports with a 5.5% share.
From 2013 to 2024, the average annual growth rate of volume to China amounted to +14.2%. Exports to the other major destinations recorded the following average annual rates of exports growth: Mexico (+4.7% per year) and Canada (-5.7% per year).
In value terms, the largest markets for graphite non-electrical articles exported from the United States were China ($81M), Germany ($53M) and Mexico ($37M), with a combined 45% share of total exports.
China, with a CAGR of -0.1%, recorded the highest growth rate of the value of exports, in terms of the main countries of destination over the period under review, while shipments for the other leaders experienced a decline.
Export Prices By Country
The average graphite non-electrical articles export price stood at $39,460 per ton in 2024, falling by -38% against the previous year. Over the period under review, the export price continues to indicate a pronounced curtailment. The most prominent rate of growth was recorded in 2023 an increase of 137% against the previous year. As a result, the export price attained the peak level of $63,650 per ton, and then reduced markedly in the following year.
There were significant differences in the average prices for the major foreign markets. In 2024, amid the top suppliers, the country with the highest price was Italy ($300,635 per ton), while the average price for exports to China ($13,197 per ton) was amongst the lowest.
From 2013 to 2024, the most notable rate of growth in terms of prices was recorded for supplies to Italy (+16.2%), while the prices for the other major destinations experienced more modest paces of growth.