
Principle
In an ideal imaging system, the PSF appears as a distinct Airy pattern, as shown in Fig. 1a. However, in the presence of scattering media, photons emitted from a point object diverge into two categories. The first category comprises near-ballistic photons, which include unscattered photons and those slightly scattered but still retaining most of the object’s information. The second category consists of photons that have undergone multiple scattering, diverging from their original trajectories and losing the object’s information. The perturbation of these scattered photons on the PSF is predominantly characterized by a decrease in contrast for non-zero frequency signals within the frequency domain53. Relative to the object details, the image background is more attributable to low-frequency signals, which consequently leads to the target image being obscured by the background light. Simultaneously, the high-frequency noise introduced by scattering further complicates the discernment of high-frequency details of the target.
Fig. 1: PSFs in imaging systems.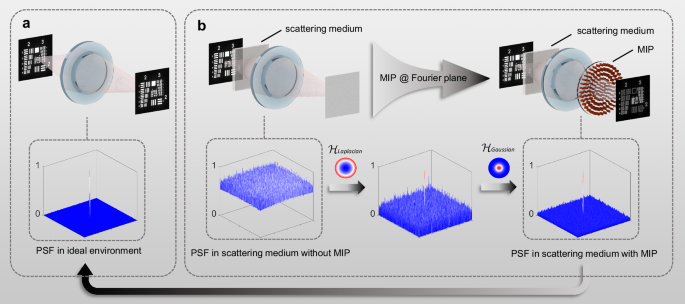
a The PSF of the imaging system in the ideal environment. It appears as a distinct Airy pattern. b The PSF of the imaging system in a scattering medium exhibits high background interference and significant noise, resulting in blurred and noisy images. In contrast, the MIP simultaneously performs the Laplacian and Gaussian operations in the imaging system, effectively enhancing image contrast and reducing Gaussian noise.
A straightforward way to recover obscured information is to tailor the deformed PSF back into its nearly ideal form through optical modulation, which can be effectively achieved in the Fourier plane. As depicted in Fig. 1b, we apply the Laplacian operation and the Gaussian operation simultaneously to modulate the PSF in the frequency domain when the scattering media is present. On one hand, since image contrast is highest at the edges, the Laplacian operation enhances edge information, thereby increasing the contrast between the image and the background. On the other hand, the Gaussian operation reduces noise and improves the details of the image. These operations collectively produce a net effect equivalent to bandpass filtering on the PSF and are implemented using a single metasurface, referred to as the “meta-image-processor (MIP),” to process the scattered components effectively.
The complete imaging process is rigorously derived in Supplementary Discussion 1 and Fig. S1 in the Supplementary Information, providing PSFmeta(xI, yI) and Eout(xI, yI) as the PSF and the output complex field enhanced by the MIP. They correspond to the PSF and the output field of the single-lens system through the scattering medium without the MIP, denoted by PSFsca(xI, yI) and Esca(xI, yI), respectively:
$$PS{F}_{meta}({x}_{I},{y}_{I})\propto {{{\mathcal{H}}} }_{meta}({k}_{x},{k}_{y})\otimes PS{F}_{sca}({x}_{I},{y}_{I})$$
(1)
$${E}_{out}({x}_{I},{y}_{I})\propto { {{\mathcal{H}}} }_{meta}({k}_{x},{k}_{y})\otimes {E}_{sca}({x}_{I},{y}_{I})$$
(2)
where ⊗ denotes the two-dimensional convolution operation and \({ {{\mathcal{H}}} }_{meta}({k}_{x},{k}_{y})\) is the Fourier transform of the transfer function of the MIP hmeta(xF, yF); xF-yF denotes the Fourier plane, xI-yI denotes the image plane, and (kx, ky) describes the spatial frequency in the frequency domain.
To design this MIP, it is essential to comprehend the representation of the Laplacian and Gaussian operators in the frequency domain. The Laplacian operator is a second-order differential operator, while the Gaussian operator is of the Gaussian function. These operators directly operate on the PSF to engineer its frequency components, yield the form as:
$${{{\mathcal{H}}}} ({k}_{x},{k}_{y})={{{\mathcal{H}}} }_{L}({k}_{x},{k}_{y})\otimes {{{\mathcal{H}}} }_{G}({k}_{x},{k}_{y})$$
(3)
where \({{{\mathcal{H}}} }_{L}({k}_{x},{k}_{y})=\frac{{\partial }^{2}}{\partial {{k}_{x}}^{2}}+\frac{{\partial }^{2}}{\partial {{k}_{y}}^{2}}\) and \({{{\mathcal{H}}} }_{G}({k}_{x},{k}_{y})={e}^{-\frac{({k}_{x}^{2}+{k}_{y}^{2})}{2{\sigma }^{2}}}\), respectively. Therefore, the transfer function of the MIP hmeta(xF, yF) is then given by ref. 46:
$${h}_{meta}({x}_{F},{y}_{F})={{{\mathcal{F}}} }^{-1}\{{{{\mathcal{H}}} }_{meta}({k}_{x},{k}_{y})\}={h}_{L}({x}_{F},{y}_{F}){h}_{G}({x}_{F},{y}_{F})$$
(4a)
$${h}_{L}({x}_{F},{y}_{F})= {{{\mathcal{F}}} }^{-1}\{{{{\mathcal{H}}} }_{L}({k}_{x},{k}_{y})\}={{{\mathcal{F}}} }^{-1}{\left\{\frac{{\partial }^{2}}{\partial {{k}_{x}}^{2}}+\frac{{\partial }^{2}}{\partial {{k}_{y}}^{2}}\right\}}_{\begin{array}{c}{k}_{x}\to {x}_{F}\\ {k}_{y}\to {y}_{F}\end{array}}\\ \propto -({{x}_{F}}^{2}+{{y}_{F}}^{2})$$
(4b)
$${h}_{G}({x}_{F},{y}_{F})={{{\mathcal{F}}} }^{-1}\{{{{\mathcal{H}}} }_{G}({k}_{x},{k}_{y})\}={{{\mathcal{F}}} }^{-1}{\left\{{e}^{-\frac{({{k}_{x}}^{2}+{{k}_{y}}^{2})}{2{\sigma }^{2}}}\right\}}_{\begin{array}{c}{k}_{x}\to {x}_{F}\\ {k}_{y}\to {y}_{F}\end{array}}\propto {e}^{-\frac{{\sigma }^{2}}{2}({{x}_{F}}^{2}+{{y}_{F}}^{2})}$$
(4c)
where \({{{\mathcal{F}}} }^{-1}\{ \cdot \}\) denotes the inverse Fourier transform, σ is the standard deviation of the Gaussian distribution. According to Eq. (4a), the resulting MIP function required for the optical modulation can be expressed as:
$${h}_{meta}(x,y)=-\frac{({x}^{2}+{y}^{2})}{{R}^{2}}{e}^{-\frac{{\sigma }^{2}({x}^{2}+{y}^{2})}{2{R}^{2}}}$$
(5)
It is noted that Eq. (5) is normalized by employing x = xF / R and y = yF / R for the MIP with a radius of R43. This equation is phase-independent, indicating that the phase of each meta-atom in the MIP should remain constant with respect to the changes in spatial position.
Design and fabrication
The MIP is composed of meta-atoms shaped as crystalline silicon (c-Si) elliptical pillars, allowing independent control of both amplitude and phase. Upon the incidence of right-circularly polarized (RCP) light, the MIP modulates the phase response of the converted left-circularly polarized (LCP) component of the outgoing light by adjusting the in-plane rotation angles of the meta-atoms, utilizing Pancharatnam-Berry (PB) phase characteristics. Meanwhile, the amplitude control can be realized by altering the geometric dimensions, thereby changing the conversion efficiency of the polarized light. As shown in Fig. 2a, the meta-atoms are seated on a silica substrate and embedded in hydrogen silsesquioxane (HSQ). Each meta-atom has a period of 260 nm, a height of 400 nm, and a minor axis length of 80 nm. The amplitude and phase of light are independently controlled by adjusting the major axis lengths and the in-plane rotation angles of the meta-atoms. The optical responses of the meta-atoms at a designed wavelength of 633 nm are simulated and the detailed simulation configuration is provided in Methods. The simulation results, as depicted in Fig. 2b, show that the conversion efficiency from RCP to LCP, which indicates the amplitude, can be continuously adjusted from 0 to 100% as the major axis lengths of the meta-atoms vary from 90 nm to 190 nm. To precisely match the required transfer function of Eq. (4), we derive a trajectory (black curve) in both the conversion efficiency map (Fig. 2b) and the phase map (Fig. 2c) to maintain a constant phase while allowing for varying amplitude. The meta-atoms with corresponding major axis lengths and rotation angles along this trajectory are then arranged to form the MIP. Figure 2d presents the phase and amplitude responses of these selected meta-atoms.
Fig. 2: Design and optical response of the meta-atoms.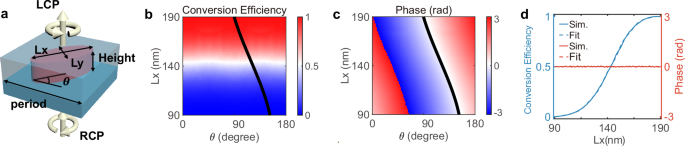
a Schematic diagrams of the elliptical meta-atoms. b The conversion efficiency map from RCP light to LCP light at 633 nm, with varying major axes Lx and minor axes Ly of the meta-atoms and the fixed angle θ at 0°. This conversion efficiency denotes the amplitude of the output field. c The phase map shows the variations with different major axis lengths and rotation angles of the meta-atoms. The black curves in (b) and (c) represent the trajectory fitted for the design. The desired meta-atoms structures are selected along this trajectory to achieve the required phase and amplitude control for the MIP. d The phases and conversion efficiencies of the selected meta-atoms.
In this work, the MIP is designed with a radius (R) of 0.5 mm. The standard deviation σ is chosen to be 2.3 to balance the imaging contrast and the transmission (see Supplementary Discussion 2 and Fig. S2 in the Supplementary Information for details). To validate the optical response of the MIP, a scaled-down one with a radius of 20 μm is analyzed. Figure 3a, b present the theoretical amplitude and phase profiles of the MIP, calculated according to Eq. (5), while the simulated responses using FDTD are presented in Fig. 3c, d. By investigating the cross section of the MIP (as shown in Fig. 3e), it is observed that the amplitude and phase responses closely match the theoretical predictions. Although a slight phase shift occurs near the center, this deviation is negligible due to the near-zero amplitude response within this region. Given a scattered PSF shown in Fig. 3f – see the details of the simulated PSF in Supplementary Discussion 11, the simulated recovered PSF assisted by the MIP is presented in Fig. 3g, demonstrating the effectiveness of our design. Following the process provided in Methods, the actual MIP sample with R = 0.5 mm is fabricated. The scanning electron microscopic (SEM) images of the resulting structures is displayed in Fig. 3h and i. The experimentally measured transmission of the MIP is 19.6%.
Fig. 3: Design and fabricated results of the MIP.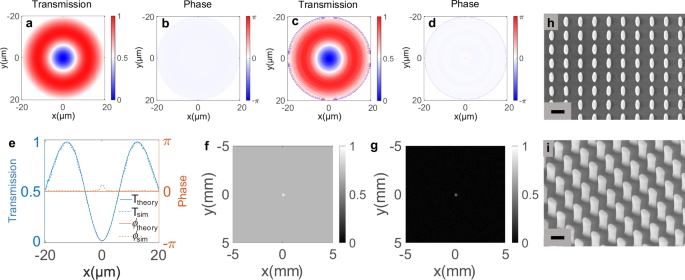
a The theoretical amplitude and (b) phase profiles of the scaled-down MIP with a radius of 20 μm. c, d show the corresponding simulated results, respectively. e The theoretical and simulated values of the normalized amplitude and phase at cross section of the MIP. f A given scattered PSF and g its simulated recovered result assisted by the MIP. SEM images of h the Top view and i the 30° slanted view of the fabricated MIP. Scaled bar: 200 nm.
Imaging performance under strongly scattering conditions
In our experimental imaging demonstration, we showcase the performance of the MIP in imaging through a strongly scattering medium. The experimental setup is depicted in Fig. 4a. To create the scattering condition, a 10 mm thick cuvette is filled with fat emulsion solution and placed between the lens and the target object. The MIP is positioned at the Fourier plane of the lens. Figure 4b presents the experimental results, where the ground truth images are obtained when the cuvette is filled with distilled water. We gradually add fat emulsion solution into the cuvette to increase the concentration until the image of the target object became nearly indistinguishable. During this process, we compare the imaging results under different scattering conditions. First, the target object obscured by the scattering medium is imaged directly without the MIP, while the polarizers and quarter-wave plates are kept in place to ensure consistency of the polarization states, matching the conditions with the MIP. The corresponding imaging results are shown in the first row of Fig. 4b. Next, the MIP is introduced, and the polarization states are matched accordingly. Five scattering conditions, with optical thicknesses (OTs) of 13.65, 14.77, 15.93, 17.05, and 18.20, are recorded and analyzed. The detailed measurement and calculation of the OTs are provided in Fig. S6, Fig. S7 and Table S1 in the Supplementary Information. These results show that the MIP effectively increases the optical imaging depth through the scattering medium, extending it from an OT of 13.65 to 15.93. It clearly demonstrates the strong capability of the MIP to reveal hidden information. This effect leads to some degradation to the resolution, which is Group 4, Element 2 when OT becomes 15.93 (see Fig. S8 and Supplementary Discussion 6). It is also noted that only the edge information is enhanced since the Laplacian operation is utilized to tailor the PSF. This is not a necessarily negative effect in some cases where the scale of target is very small and occupies only a few pixels in the image. Additionally, some extreme scattering environments hinder machine vision technology from achieving high-precision detection and recognition, while the MIP provides possible solutions to these cases.
Fig. 4: Experimental setup and imaging results.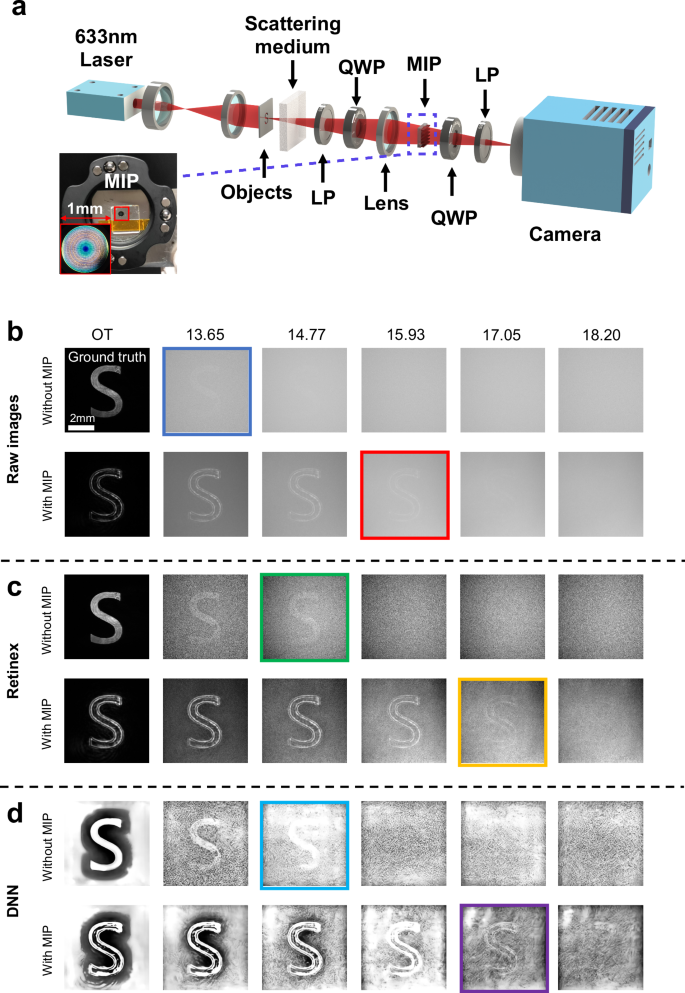
a The schematic demonstration of the imaging system. In the experiment, the MIP is adhered to an iron aperture plate and fixed on a removable coaxial system cage plate. b The raw images, c corresponding Retinex post-processed, and (d) DNN post-processed images without and with the MIP. b–d compare the imaging results through the scattering medium with varying optical thicknesses. The first column displays the images obtained when the cuvette is filled with distilled water, serving as a ground truth without significant scattering. In each row from top to bottom: the Blue box: maximum OT (13.65) for the resolvable raw image without the MIP; red box: maximum OT (15.93) for the resolvable raw image with the MIP; green box: the maximum OT (14.77) for the resolvable image without the MIP but with Retinex post-processing; yellow box: the maximum OT (17.05) for the resolvable image with the MIP and with Retinex post-processing; cyan box: the maximum OT (14.77) for the resolvable image without the MIP but with DNN post-processing; purple box: the maximum OT (17.05) for the resolvable image with the MIP and with DNN post-processing.
The imaging depth and clarity can be further enhanced by applying post-processing techniques to the results. We apply two popular methods, the Retinex-based and DNN-based techniques, to the raw images obtained without the MIP, shown in the Fig. 4c and d, respectively. These techniques improve the clarity of the target; however, when the OT surpasses a certain threshold, the target signal becomes completely obscured by scattering, making it impossible to restore the image using post-processing alone. In our experiment, images with OT values greater than 14.77 could not be recovered by either method. In contrast, since the MIP physically reveals hidden information, the recovered details can be further enhanced by both post-processing methods, successfully extending the OT to a challenging value of 17.05. This significant imaging depth demonstrates great potential for applications in challenging conditions, such as dense fog, haze, underwater environments, and deep tissue imaging. As the optical thickness of the scattering medium increases, the signal-to-noise ratio (SNR) of the captured image drops below the detection threshold of the camera’s dynamic range, ultimately limiting the effectiveness of the MIP.
Applications
A cataract is a cloudy area in the lens or vitreous body of the eye that leads to a decrease in vision. This eye condition not only significantly degrades human visual acuity but also complicates the diagnostic process for examining the fundus. Here, we demonstrate the potential application of the MIP for enhancing the diagnostic performance of a fundus camera in the presence of cataracts, which offers significant benefits for patients suffering from both fundus disease and cataracts.
Figure 5a depicts the experimental setup. In the demonstration, an eye model (Ocular Inc, OEMI-7, as shown in Fig. 5b) injected with a concentration of 0.31% fat emulsion solution inside is used to simulate a cataract-affected eye. A vascular structure (as shown in Fig. 5c) is patterned at the fundus of the eye model. A laser source with a wavelength of 488 nm, which is widely used in fundus fluorescein angiography, is used in the experiment, causing the vascular structure to emit fluorescence at a peak wavelength of ~633 nm under the laser excitation. This condition mimics the fundus autofluorescence (FAF) phenomenon54 observed in ophthalmic diagnosis. Figure S9 in the Supplementary Information shows the fluorescent spectrum of the vascular structure in the eye model.
Fig. 5: Fundus camera with the MIP and the imaging results.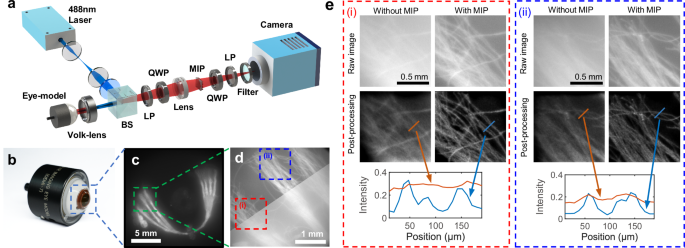
a Configuration of fundus camera setup. b The eye model utilized in the application. c The vascular structure patterned at the fundus of the eye model in florescent mode. d Comparison of the imaging results for vascular structure through simulated cataract. The upper half of the image shows the imaging results without the aid of the MIP, while the lower half displays the same image enhanced by the MIP. e Magnified images in areas (i) and (ii) in d. They demonstrate the capability of the MIP to recover lost details when combined with pre-processing techniques, whereas these details cannot be retrieved by post-processing techniques alone.
The imaging results of the vascular structures at the fundus, with and without the MIP, are compared in Fig. 5d. The two results are combined in a single image for a visual comparison of contrast. The upper half shows the imaging result assisted by the MIP, where both contrast and clarity are significantly improved compared to the lower half, which shows the direct imaging result without the MIP. Furthermore, two magnified regions at the ends of the vascular structures are compared in Fig. 5e. The blind deconvolution algorithm is applied here. The results demonstrate that the details lost due to scattering are recovered with the assistance of the MIP, and these details are further enhanced by the post-processing techniques. Without the MIP, however, the post-processing techniques alone are unable to retrieve the lost information under such strongly scattering conditions. To clarify, the MIP processing is designed to preserve only the edges of the vascular pattern. However, since the pattern itself is only a few pixels wide, the edges effectively constitute the entire pattern. This outcome is actually beneficial for the application, as it maintains precise dimensional fidelity while dramatically improving contrast.